
Palantir Q1 2026 10-Q: Margin Story, Ongoing Dilution

By Chad Hartman
Published · Last updated
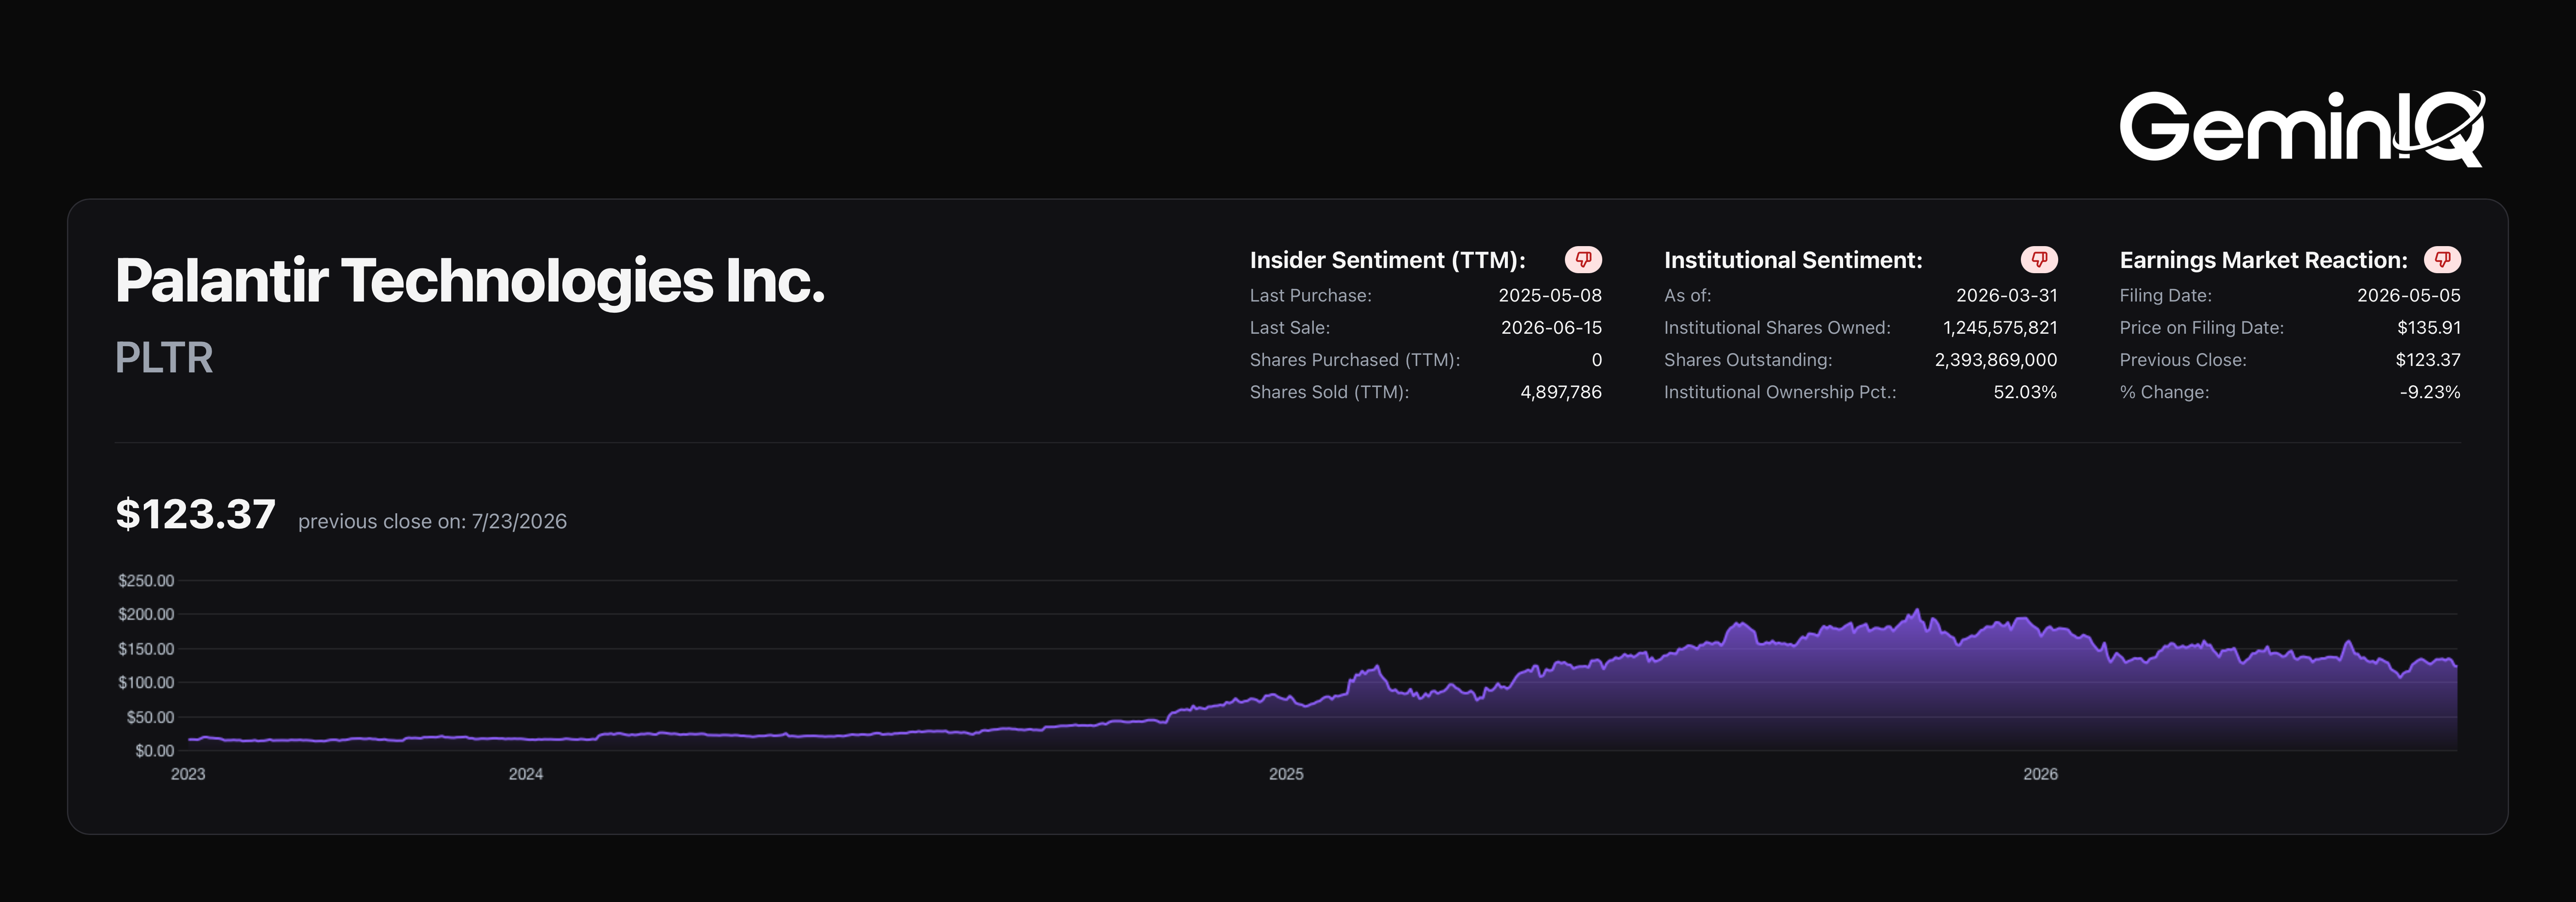
Palantir ($PLTR) just filed its Q1 FY2026 10-Q (filed May 5, 2026). The operating leverage story here is real: trailing twelve-month operating margin has climbed to 38.1%, up from 10.8% at the end of FY2024. That's a genuine, dramatic improvement worth taking seriously. Alongside it, basic shares outstanding have grown more than 7% over roughly the same stretch. Both things are true at once, and neither should be ignored in favor of the other.
| Field | Value |
|---|---|
| Ticker | $PLTR |
| Filing | Q1 FY2026 10-Q |
| Filed | May 5, 2026 |
| Period End | March 31, 2026 |
| Operating Margin (TTM) | 38.1% |
| Basic Shares Growth (2yr) | +7.3% |
The Margin Expansion Story
The operating leverage narrative around this stock is not hype. The trend is sustained and the numbers back it up.
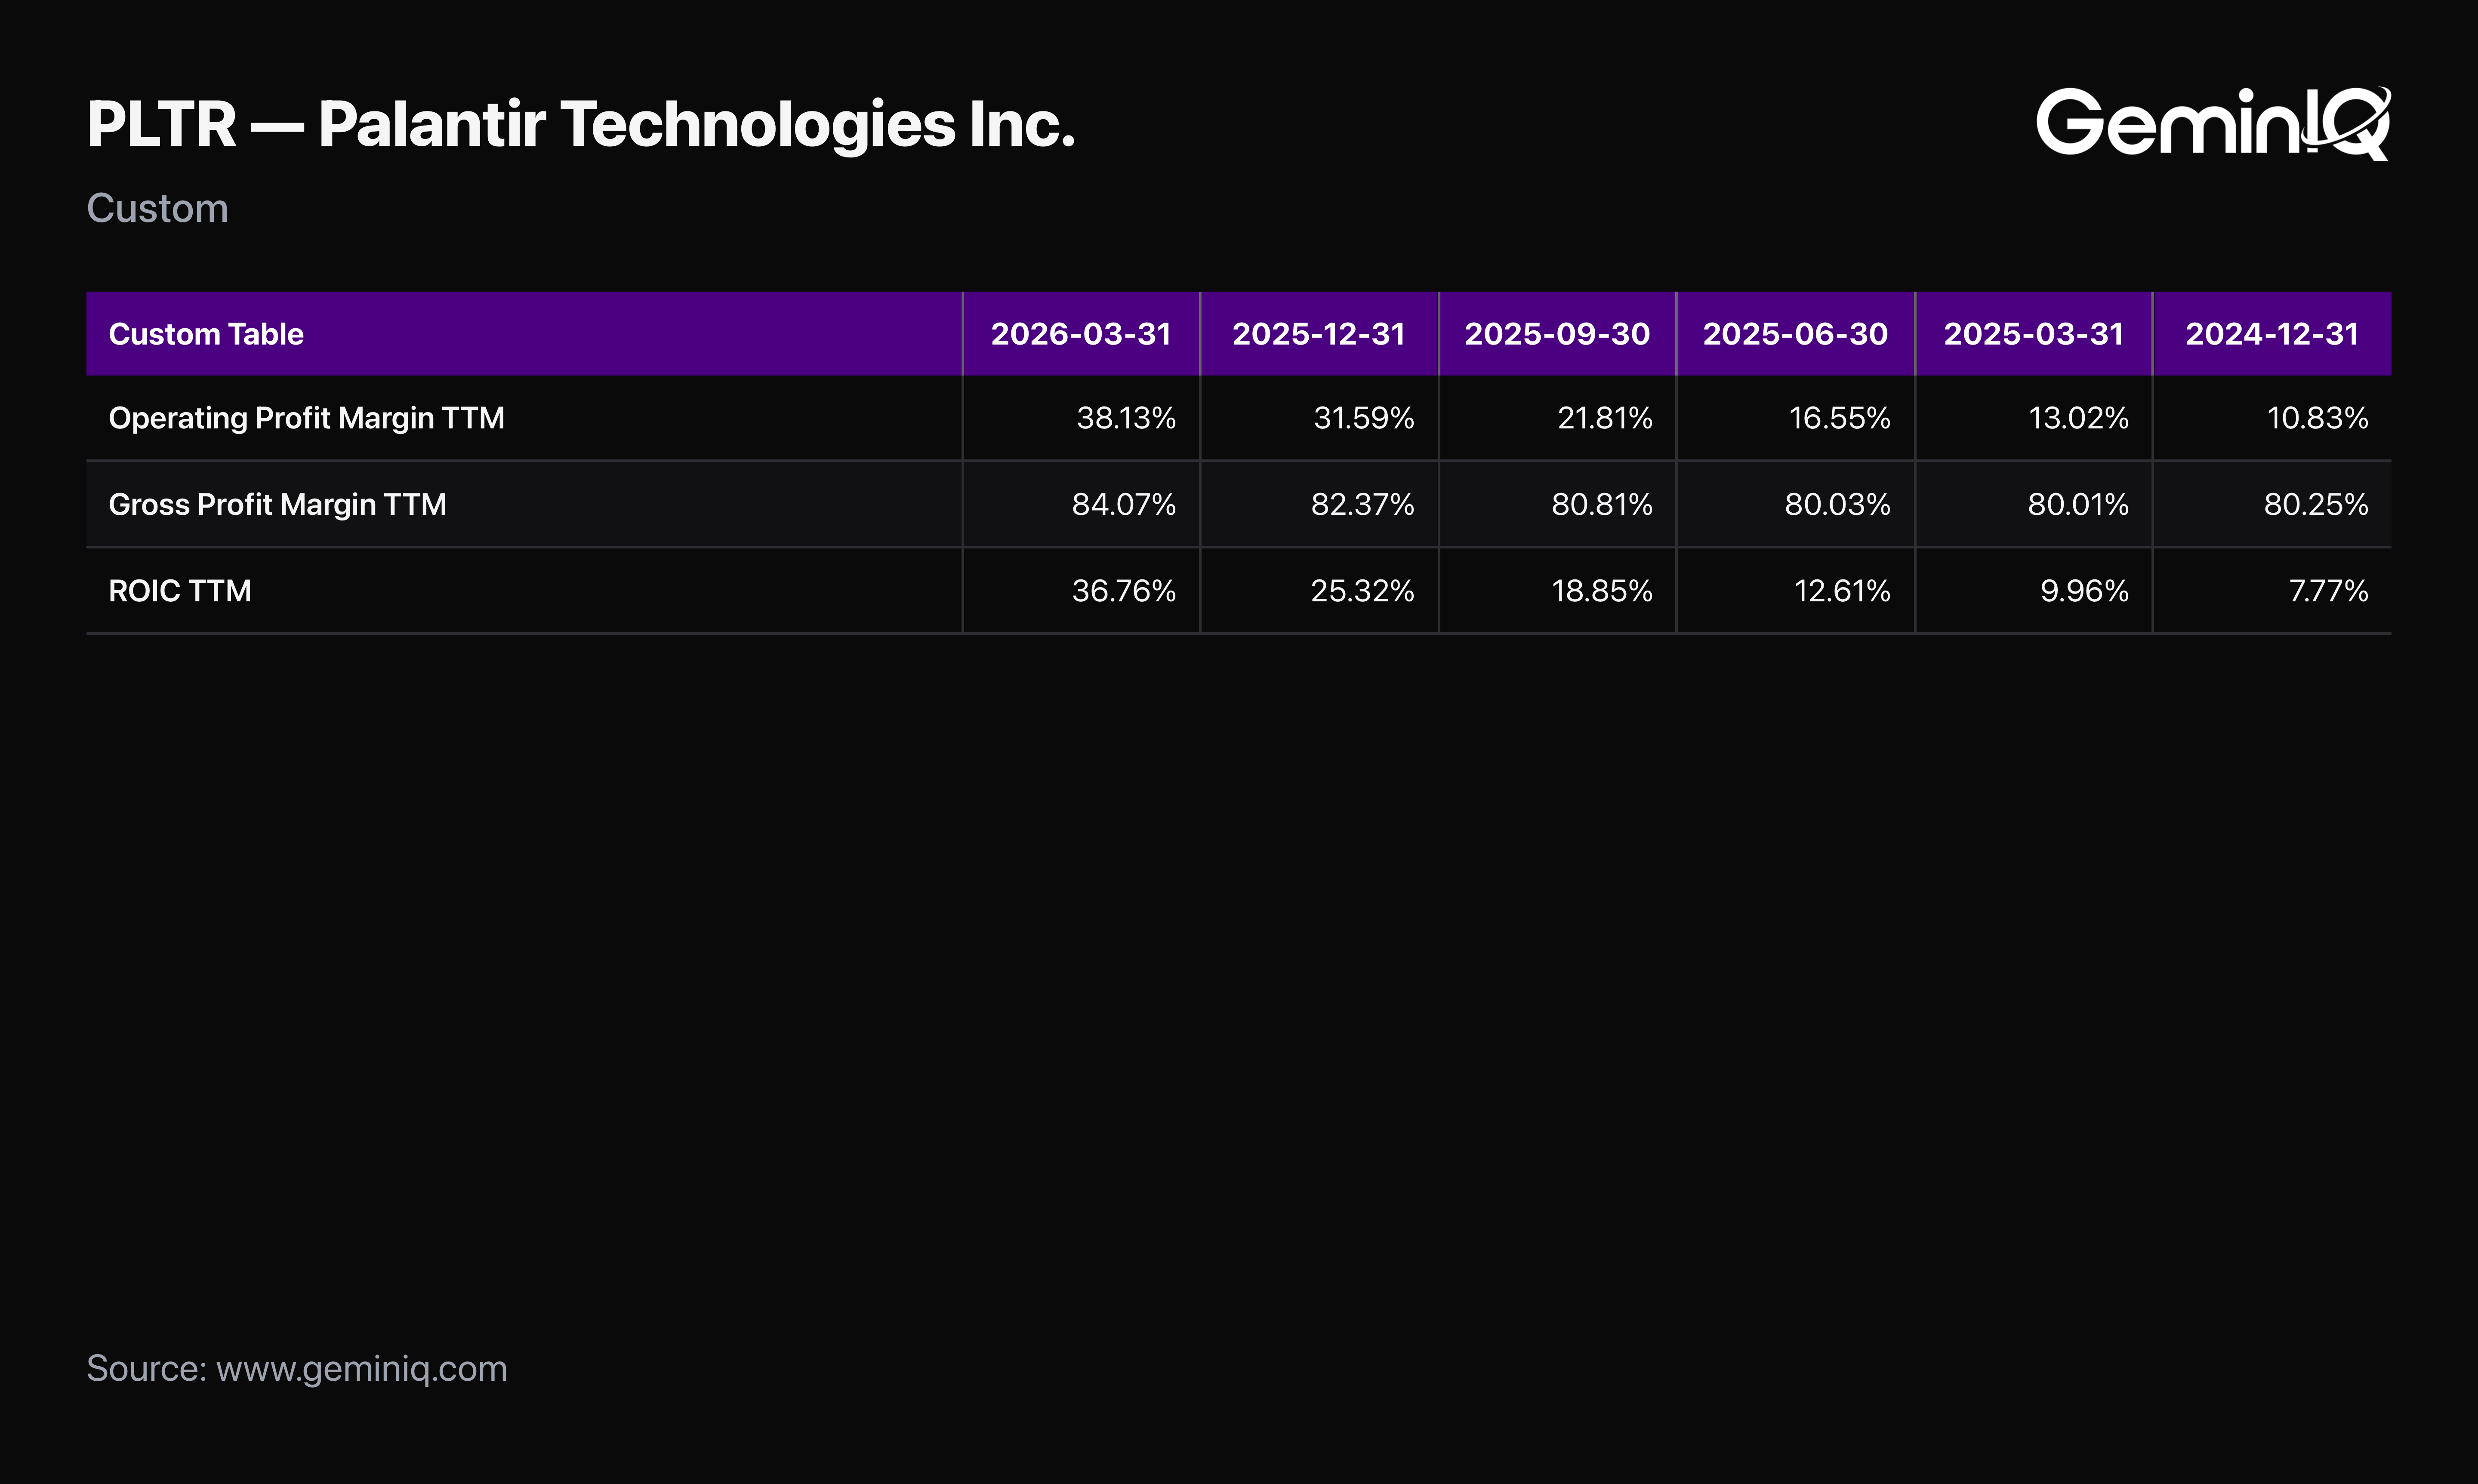
The Data: Palantir's TTM Operating Margin has climbed from 10.8% at the end of FY2024 to 38.1% as of this filing, a steady, multi-quarter climb rather than a single strong quarter. TTM Gross Margin sits at 84.1%. TTM Net Income is $2.28 Billion on TTM Revenue of $5.22 Billion. TTM Return on Invested Capital has climbed alongside it, from 7.8% to 36.8% over the same period.
The GeminIQ Edge: Pulling Calculated Metrics as a full trend, rather than a single snapshot, confirms this margin expansion has compounded quarter over quarter rather than arriving in one jump. That distinction matters — a steady multi-quarter trend is a far stronger signal than a single beat.
The Share Count Keeps Climbing
Margin expansion tells you how efficiently Palantir runs. Share count tells you how much of that efficiency actually accrues to a given shareholder over time.
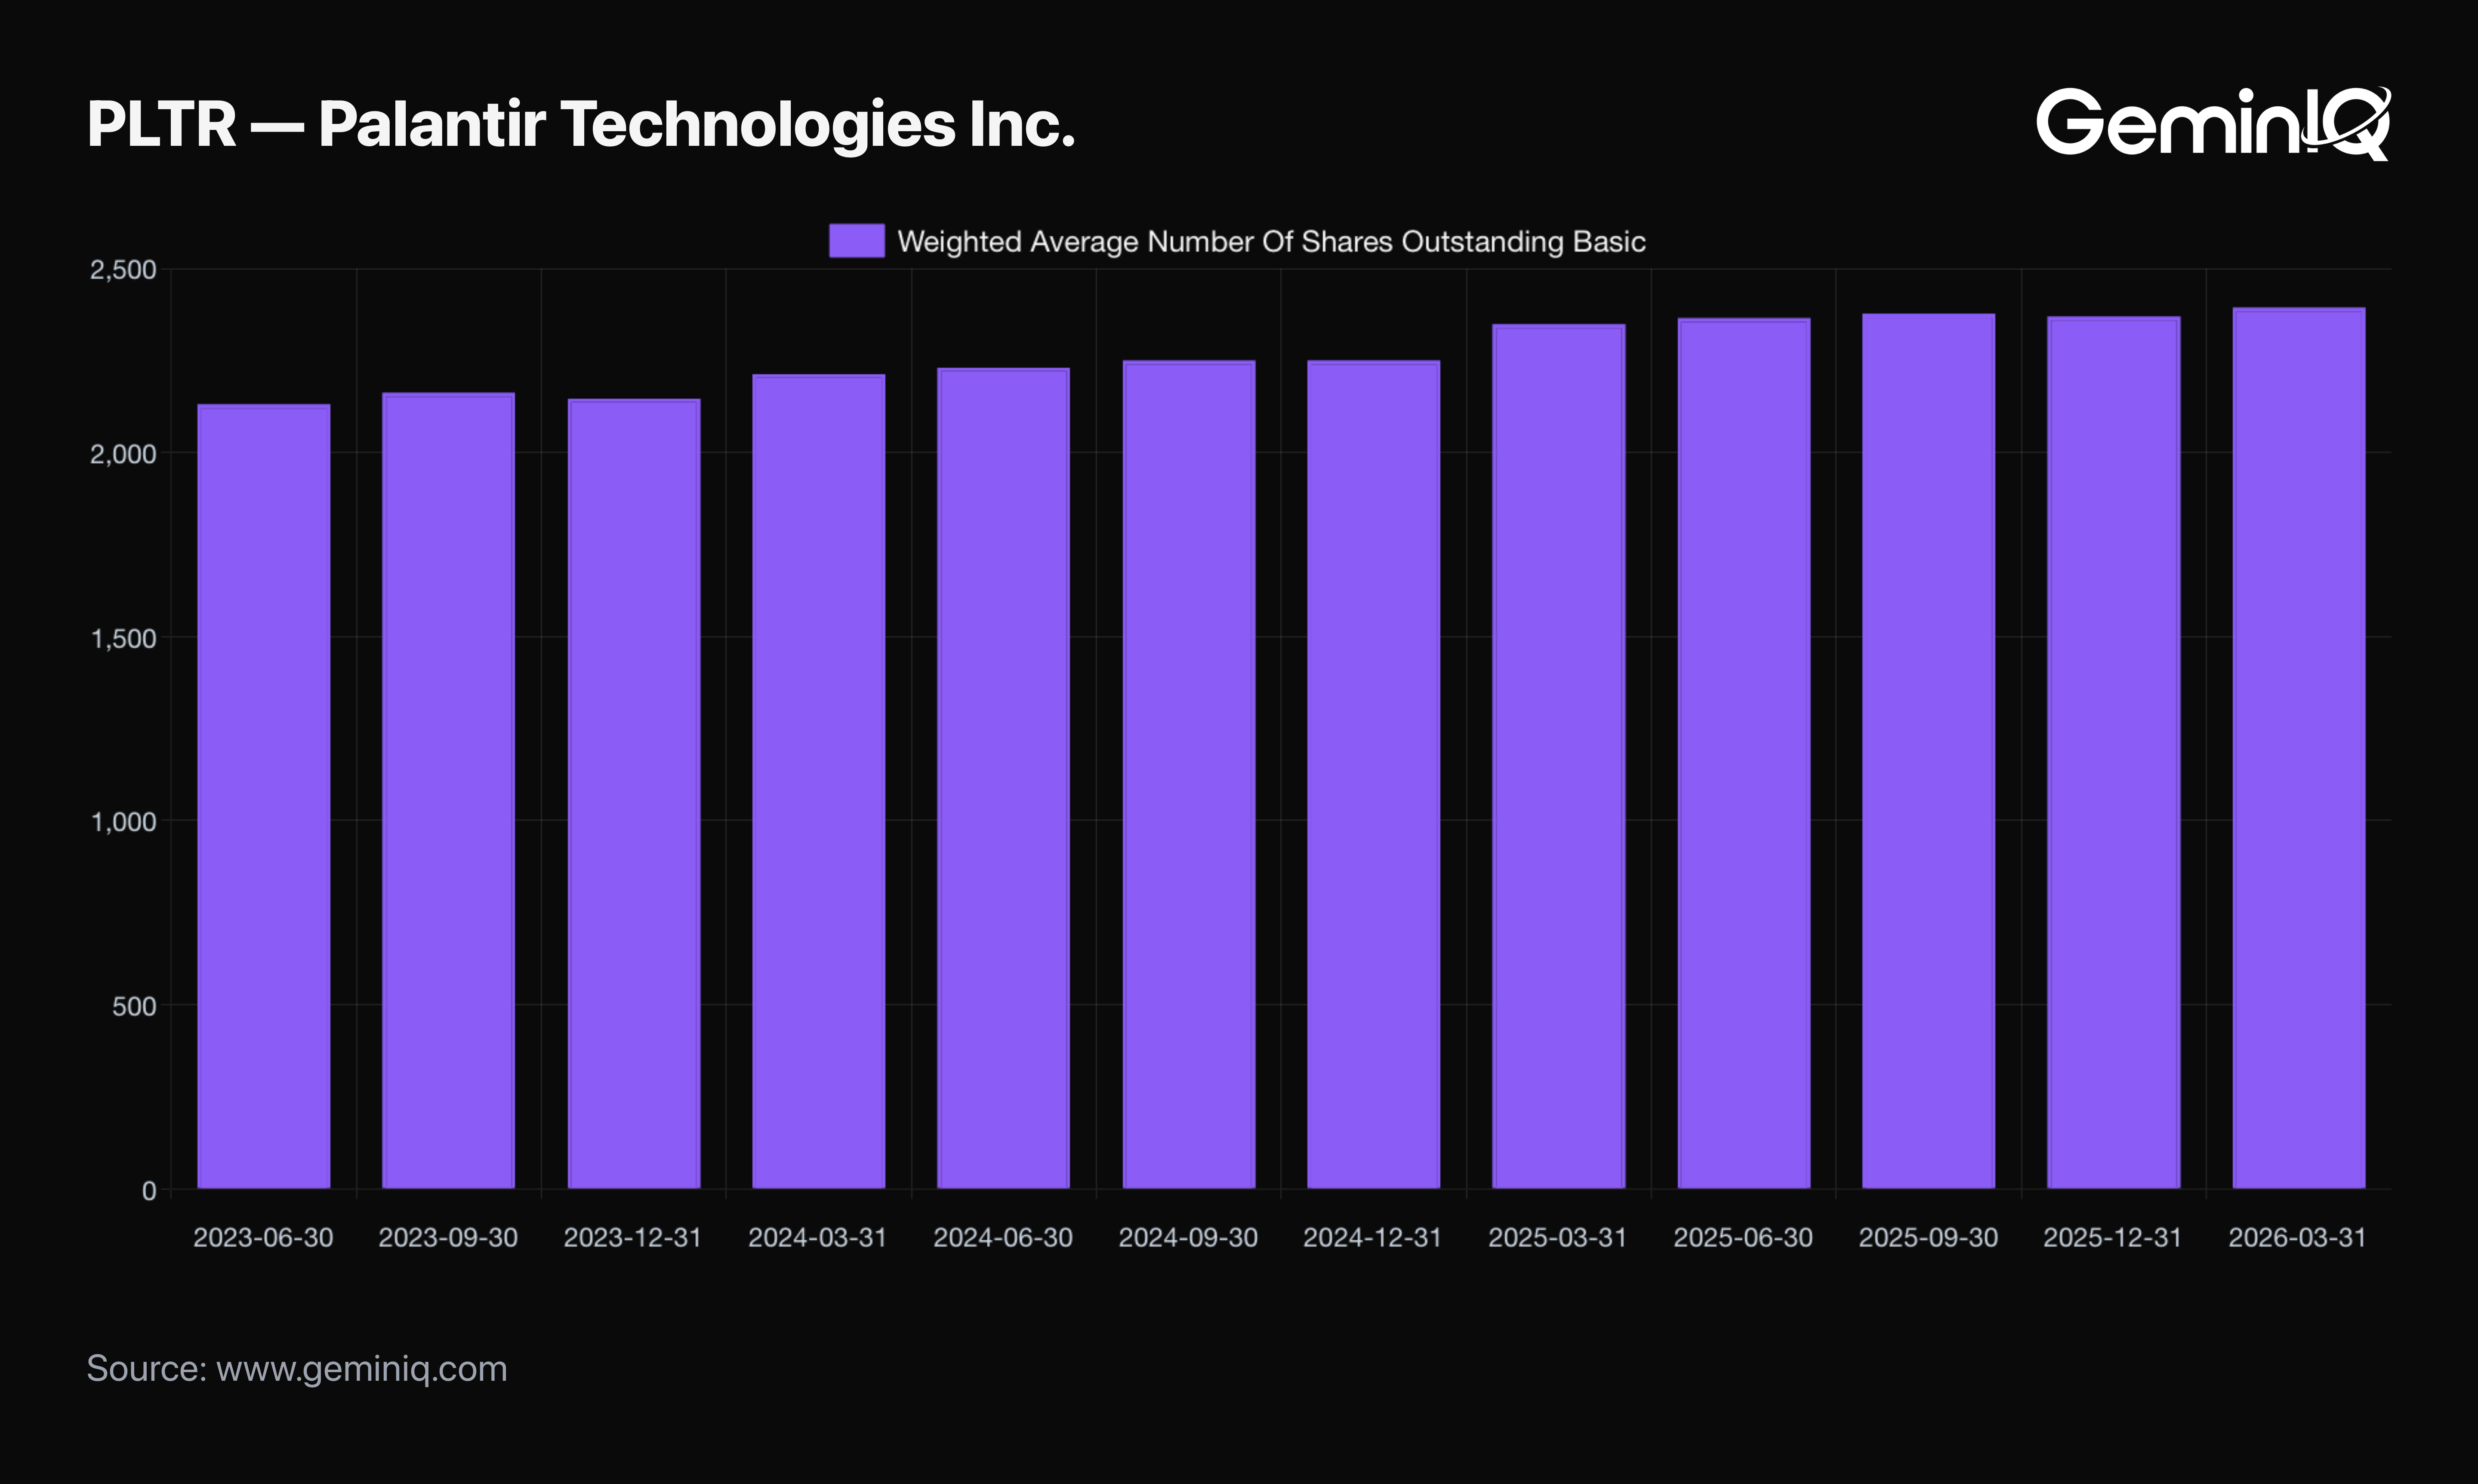
The Data: Basic shares outstanding have grown from approximately 2.232 Billion in mid-2024 to 2.394 Billion as of this filing, an increase of roughly 7.3% over two years. Diluted shares stand at 2.571 Billion. This is a continued, gradual increase rather than a flat or shrinking share count.
The GeminIQ Edge: Pulling Financial Statements share count data across a full multi-year trend, rather than a single period in isolation, shows the direction clearly: management's margin gains are real, but they're being spread across a growing share base rather than a fixed or shrinking one.
The Free Cash Flow Machine
Alongside the margin expansion, the cash conversion story remains genuinely strong.
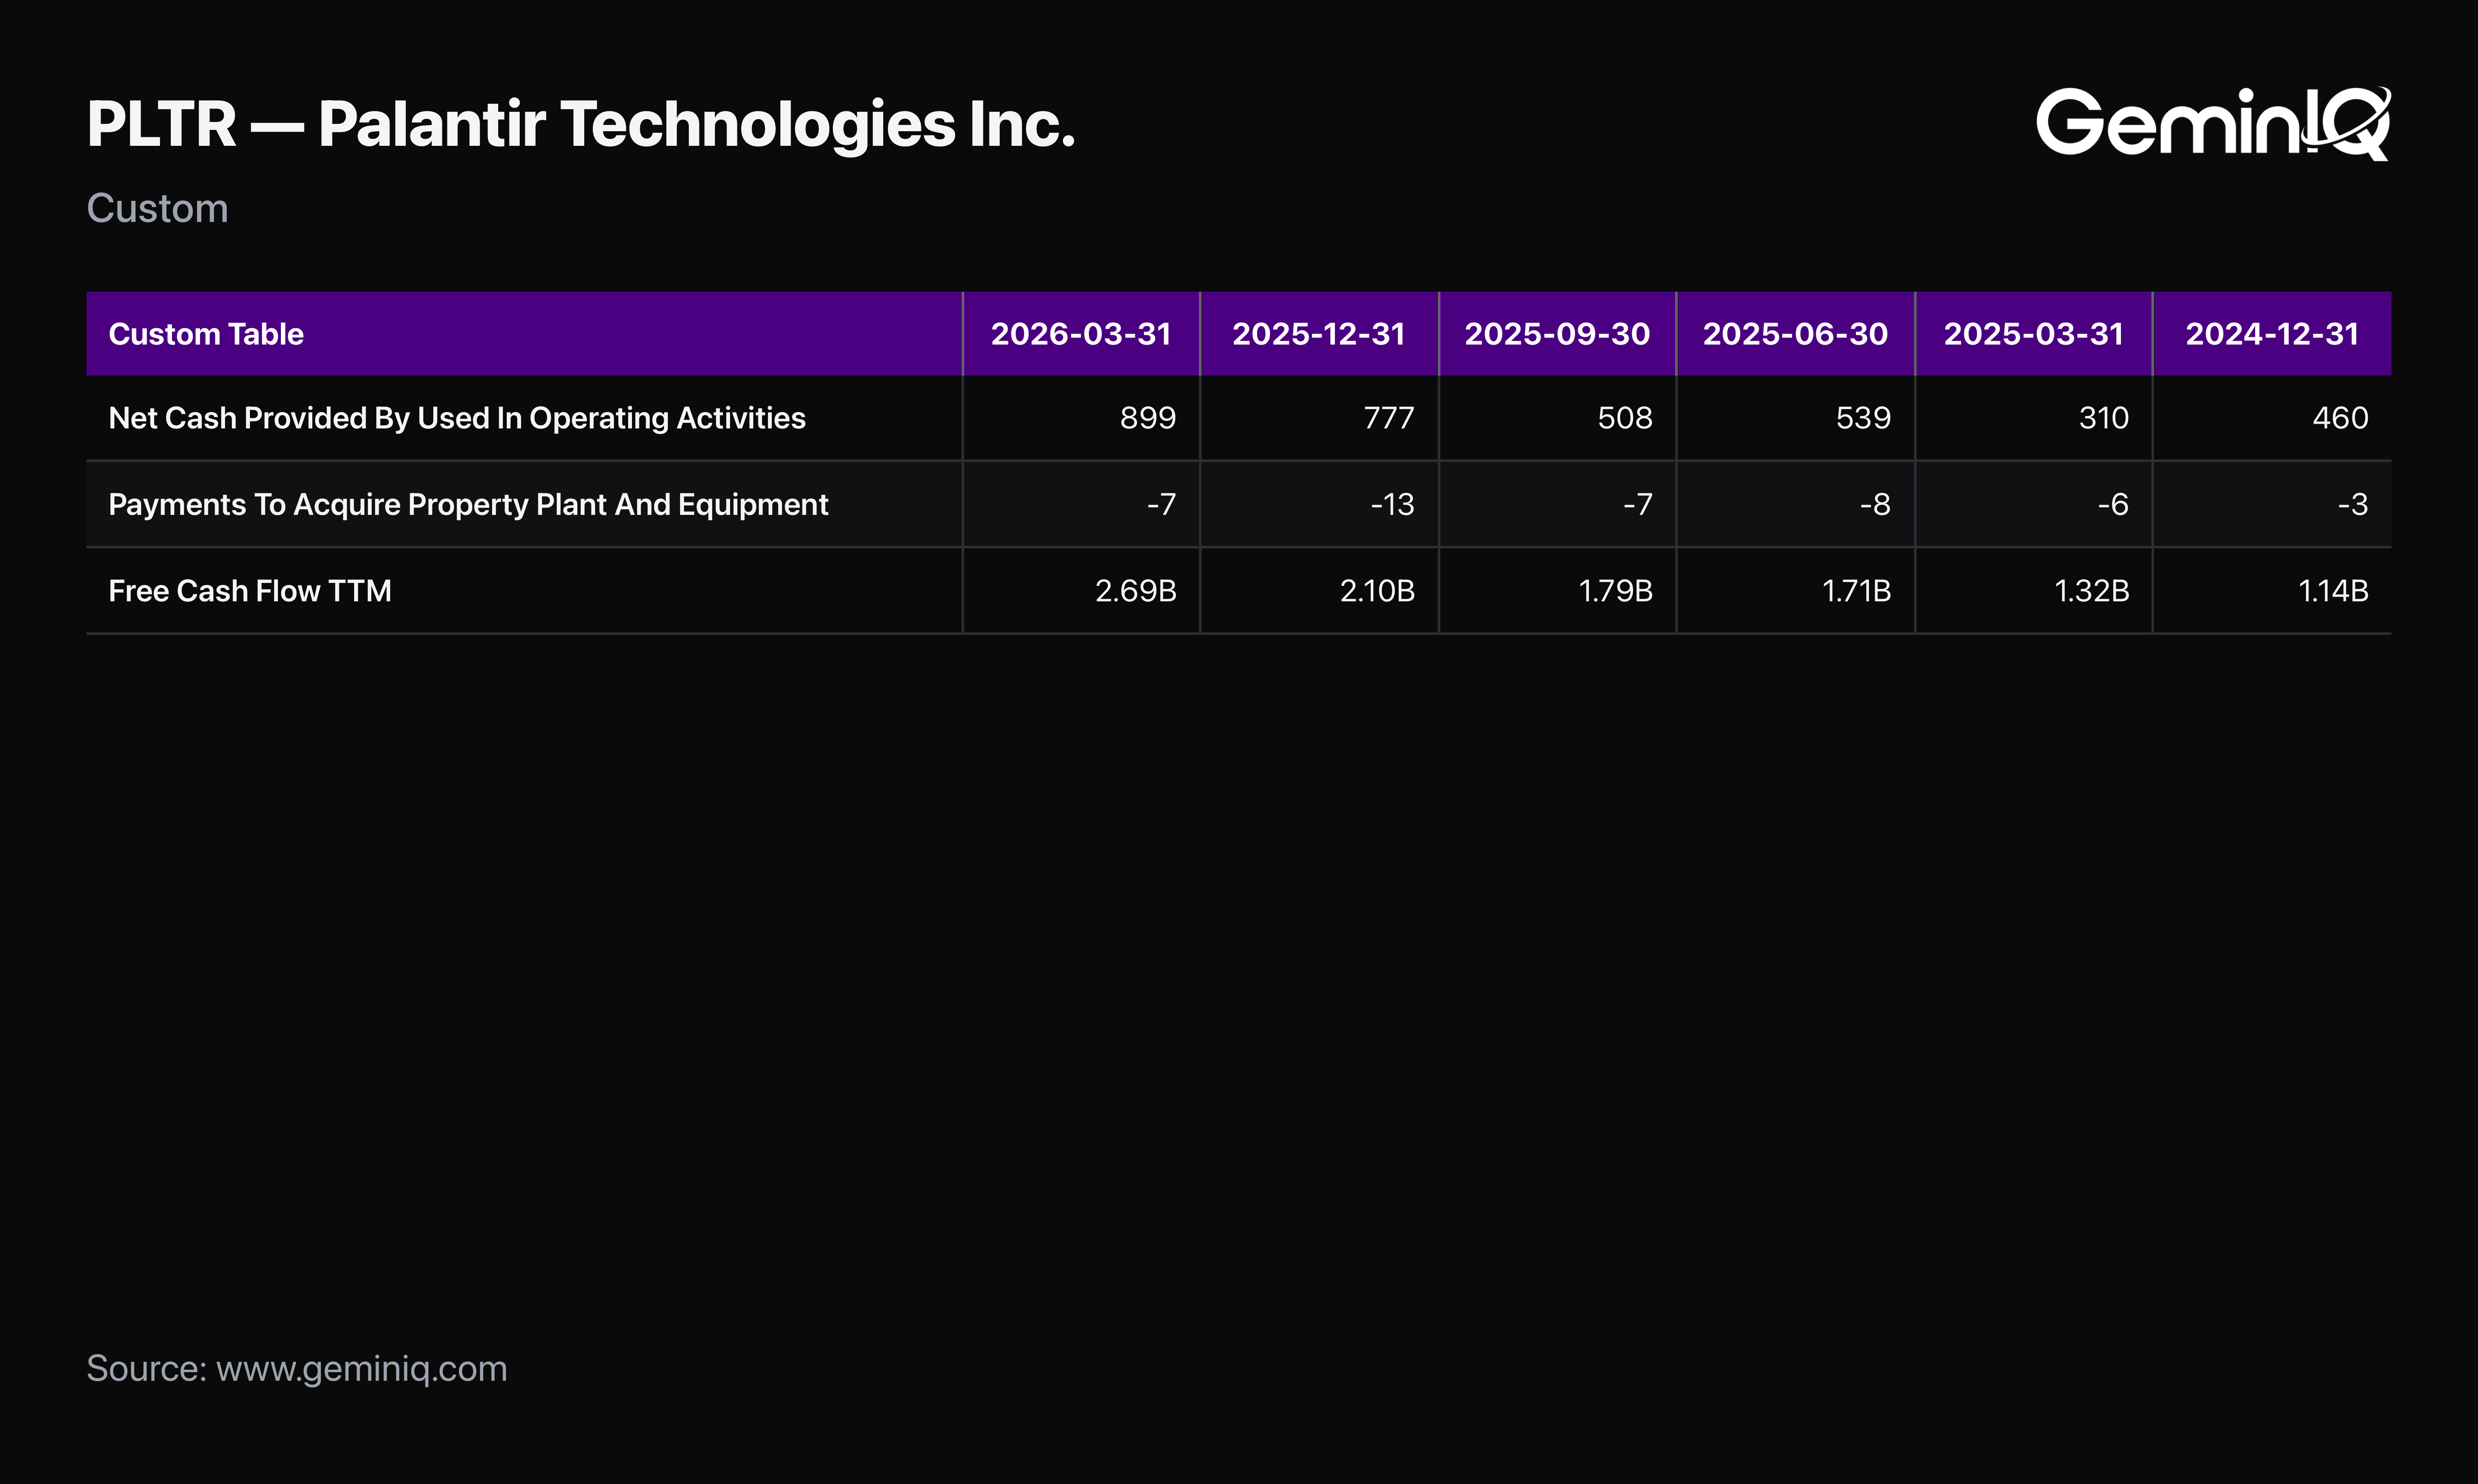
The Data: Palantir's TTM Operating Cash Flow is $2.72 Billion against TTM CapEx of just $35.1 Million, for TTM Free Cash Flow of $2.69 Billion — a capital-light model converting the vast majority of operating cash flow directly into free cash flow.
The GeminIQ Edge: Pulling Financial Statements cash flow data directly shows just how little capital this business needs to reinvest in itself relative to the cash it generates, a structural characteristic of a software-driven model rather than a one-time efficiency gain.
Smart Money and the Insider Record
Two different signals around Palantir worth checking on their own terms.
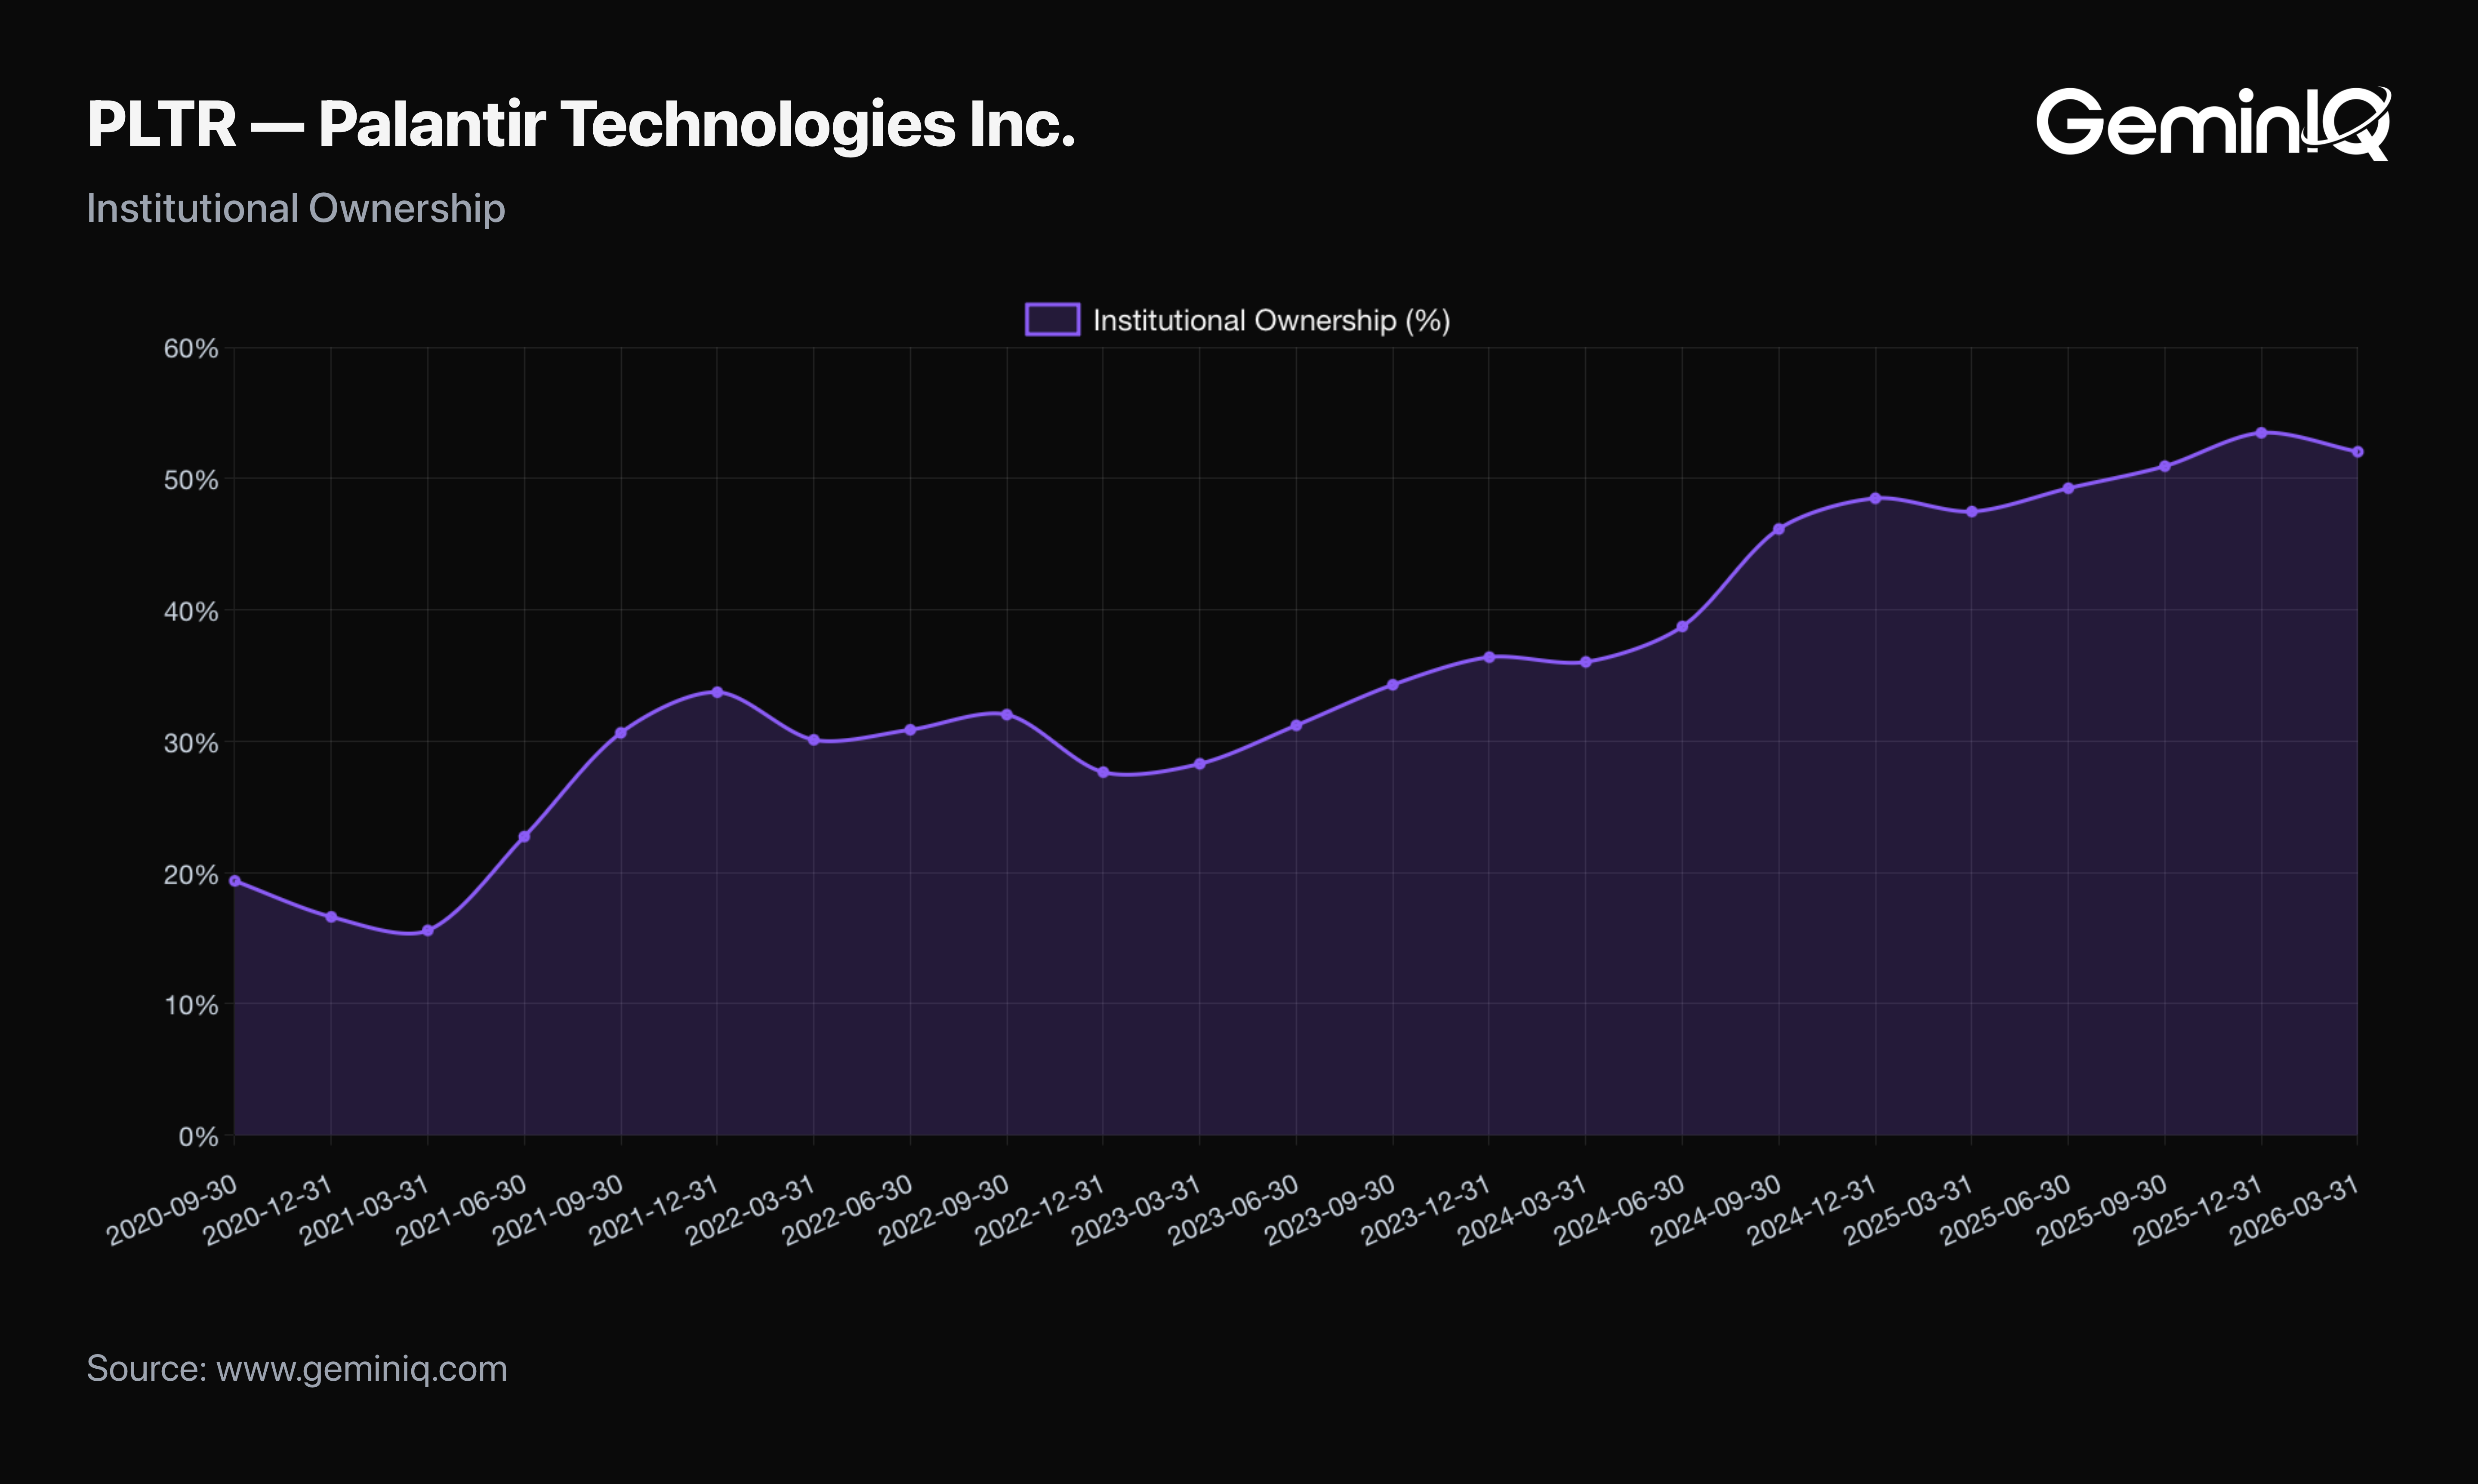
The Data: Institutional Ownership has climbed from 48.5% in December 2024 to 52.0% as of the most recent 13F (March 2026, filed with the standard lag). Insider Transactions show an overwhelmingly sale-weighted record: 625 sales against a single purchase in the available history.
The GeminIQ Edge: The institutional climb is a modest, steady positive. The insider record is the more striking of the two — a 625-to-1 sale-to-purchase ratio is a considerably more lopsided pattern than typical for a mature large-cap, and it's worth weighing against the stock's valuation (currently trading at roughly 153x trailing earnings) rather than dismissing as routine equity-comp-driven selling.
Frequently Asked Questions
What is Palantir's current operating margin?
Palantir's TTM Operating Margin is 38.1%, up from 10.8% at the end of FY2024, a sustained multi-quarter expansion rather than a single-quarter improvement.
Is Palantir still diluting shareholders?
Yes. Basic shares outstanding have grown from approximately 2.232 Billion in mid-2024 to 2.394 Billion as of the Q1 FY2026 10-Q, an increase of roughly 7.3% over two years.
How strong is Palantir's free cash flow?
TTM Free Cash Flow is approximately $2.69 Billion, on TTM Operating Cash Flow of $2.72 Billion against TTM CapEx of just $35.1 Million, reflecting a highly capital-light business model.
When did Palantir last file its 10-Q, and what period does it cover?
Palantir's most recent filing is a Form 10-Q filed May 5, 2026, covering the fiscal quarter ended March 31, 2026 (Q1 FY2026).
Wall Street's data. Main Street's price.
Institutional terminals charge thousands a year for as-filed accuracy. GeminIQ gives you the same thing for a fraction of the cost: financials built directly from raw SEC EDGAR filings, not third-party APIs, with full XBRL traceability back to the original 10-K or 10-Q. No normalized guesswork, just calculated metrics, charts, screeners, and watchlists built on numbers exactly as the company reported them. Start researching now at GeminIQ.com.
All financial figures cited in this article reference Palantir Technologies Inc.'s Q1 FY2026 10-Q (filed May 5, 2026, period ending March 31, 2026). All SEC filings are publicly available at SEC EDGAR.
Disclaimer: The content in this blog is for educational and entertainment purposes only and does not constitute financial, legal, or tax advice. Investing involves risk, including the loss of principal. The views expressed are my own and not intended as financial advice or a guarantee of future performance.