
Peloton Stock Collapse: The Warnings Were in the Filings

By Chad Hartman
Published · Last updated
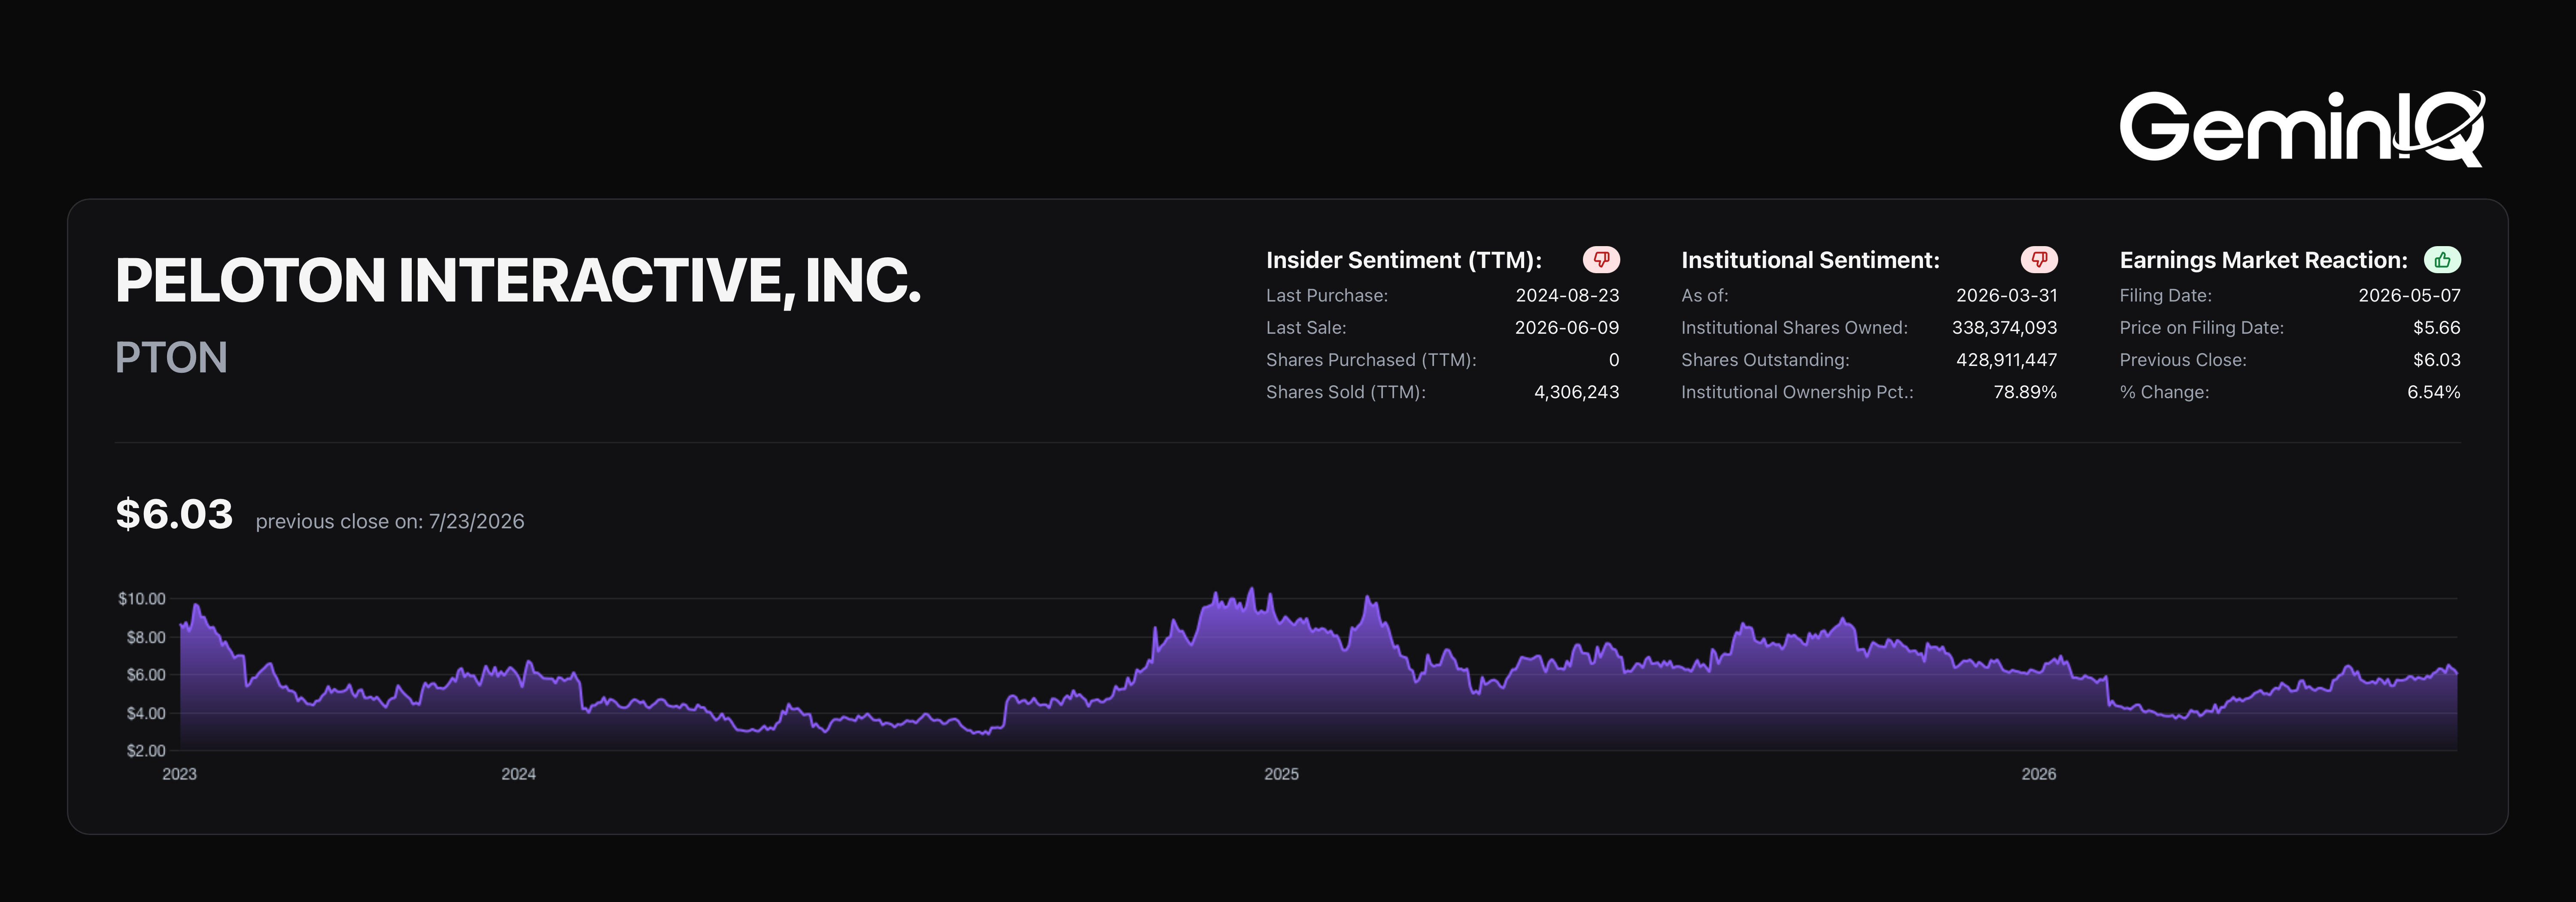
Peloton Interactive ($PTON) closed out 2020 at an all-time high of $151.72 a share. By the end of its March 2026 quarter, that same share changed hands for $4.29 — a decline of 97.2%. The story everyone tells is that a pandemic-era fad met an inevitable reckoning, and that nobody could have called the turn until the stock was already in freefall. But standard financial media doesn't read the footnotes. Read Peloton's own 10-Qs in the order they were filed, and the warning signs were already stacked three deep a full quarter before Peloton's board pushed out its founder-CEO in February 2022 — while the warehouse was still filling with unsold hardware and the people running the company had already banked more than a billion dollars selling their own shares.
Every figure in this study is drawn from Peloton Interactive's own 10-K and 10-Q filings, filed between November 2019 and May 2026, covering fiscal periods from its September 2019 IPO quarter through its March 2026 quarter — 27 consecutive quarterly filings read in the order the company filed them, joined to how the stock actually traded in the one to three months after each filing hit SEC EDGAR.
The Growth Years, 2019–2021
The market's belief during this stretch wasn't complicated: Peloton was the future of fitness, and the pandemic had handed it a permanent tailwind. The revenue numbers backed that story up, quarter after quarter, in a way that made the eventual reversal look unthinkable.
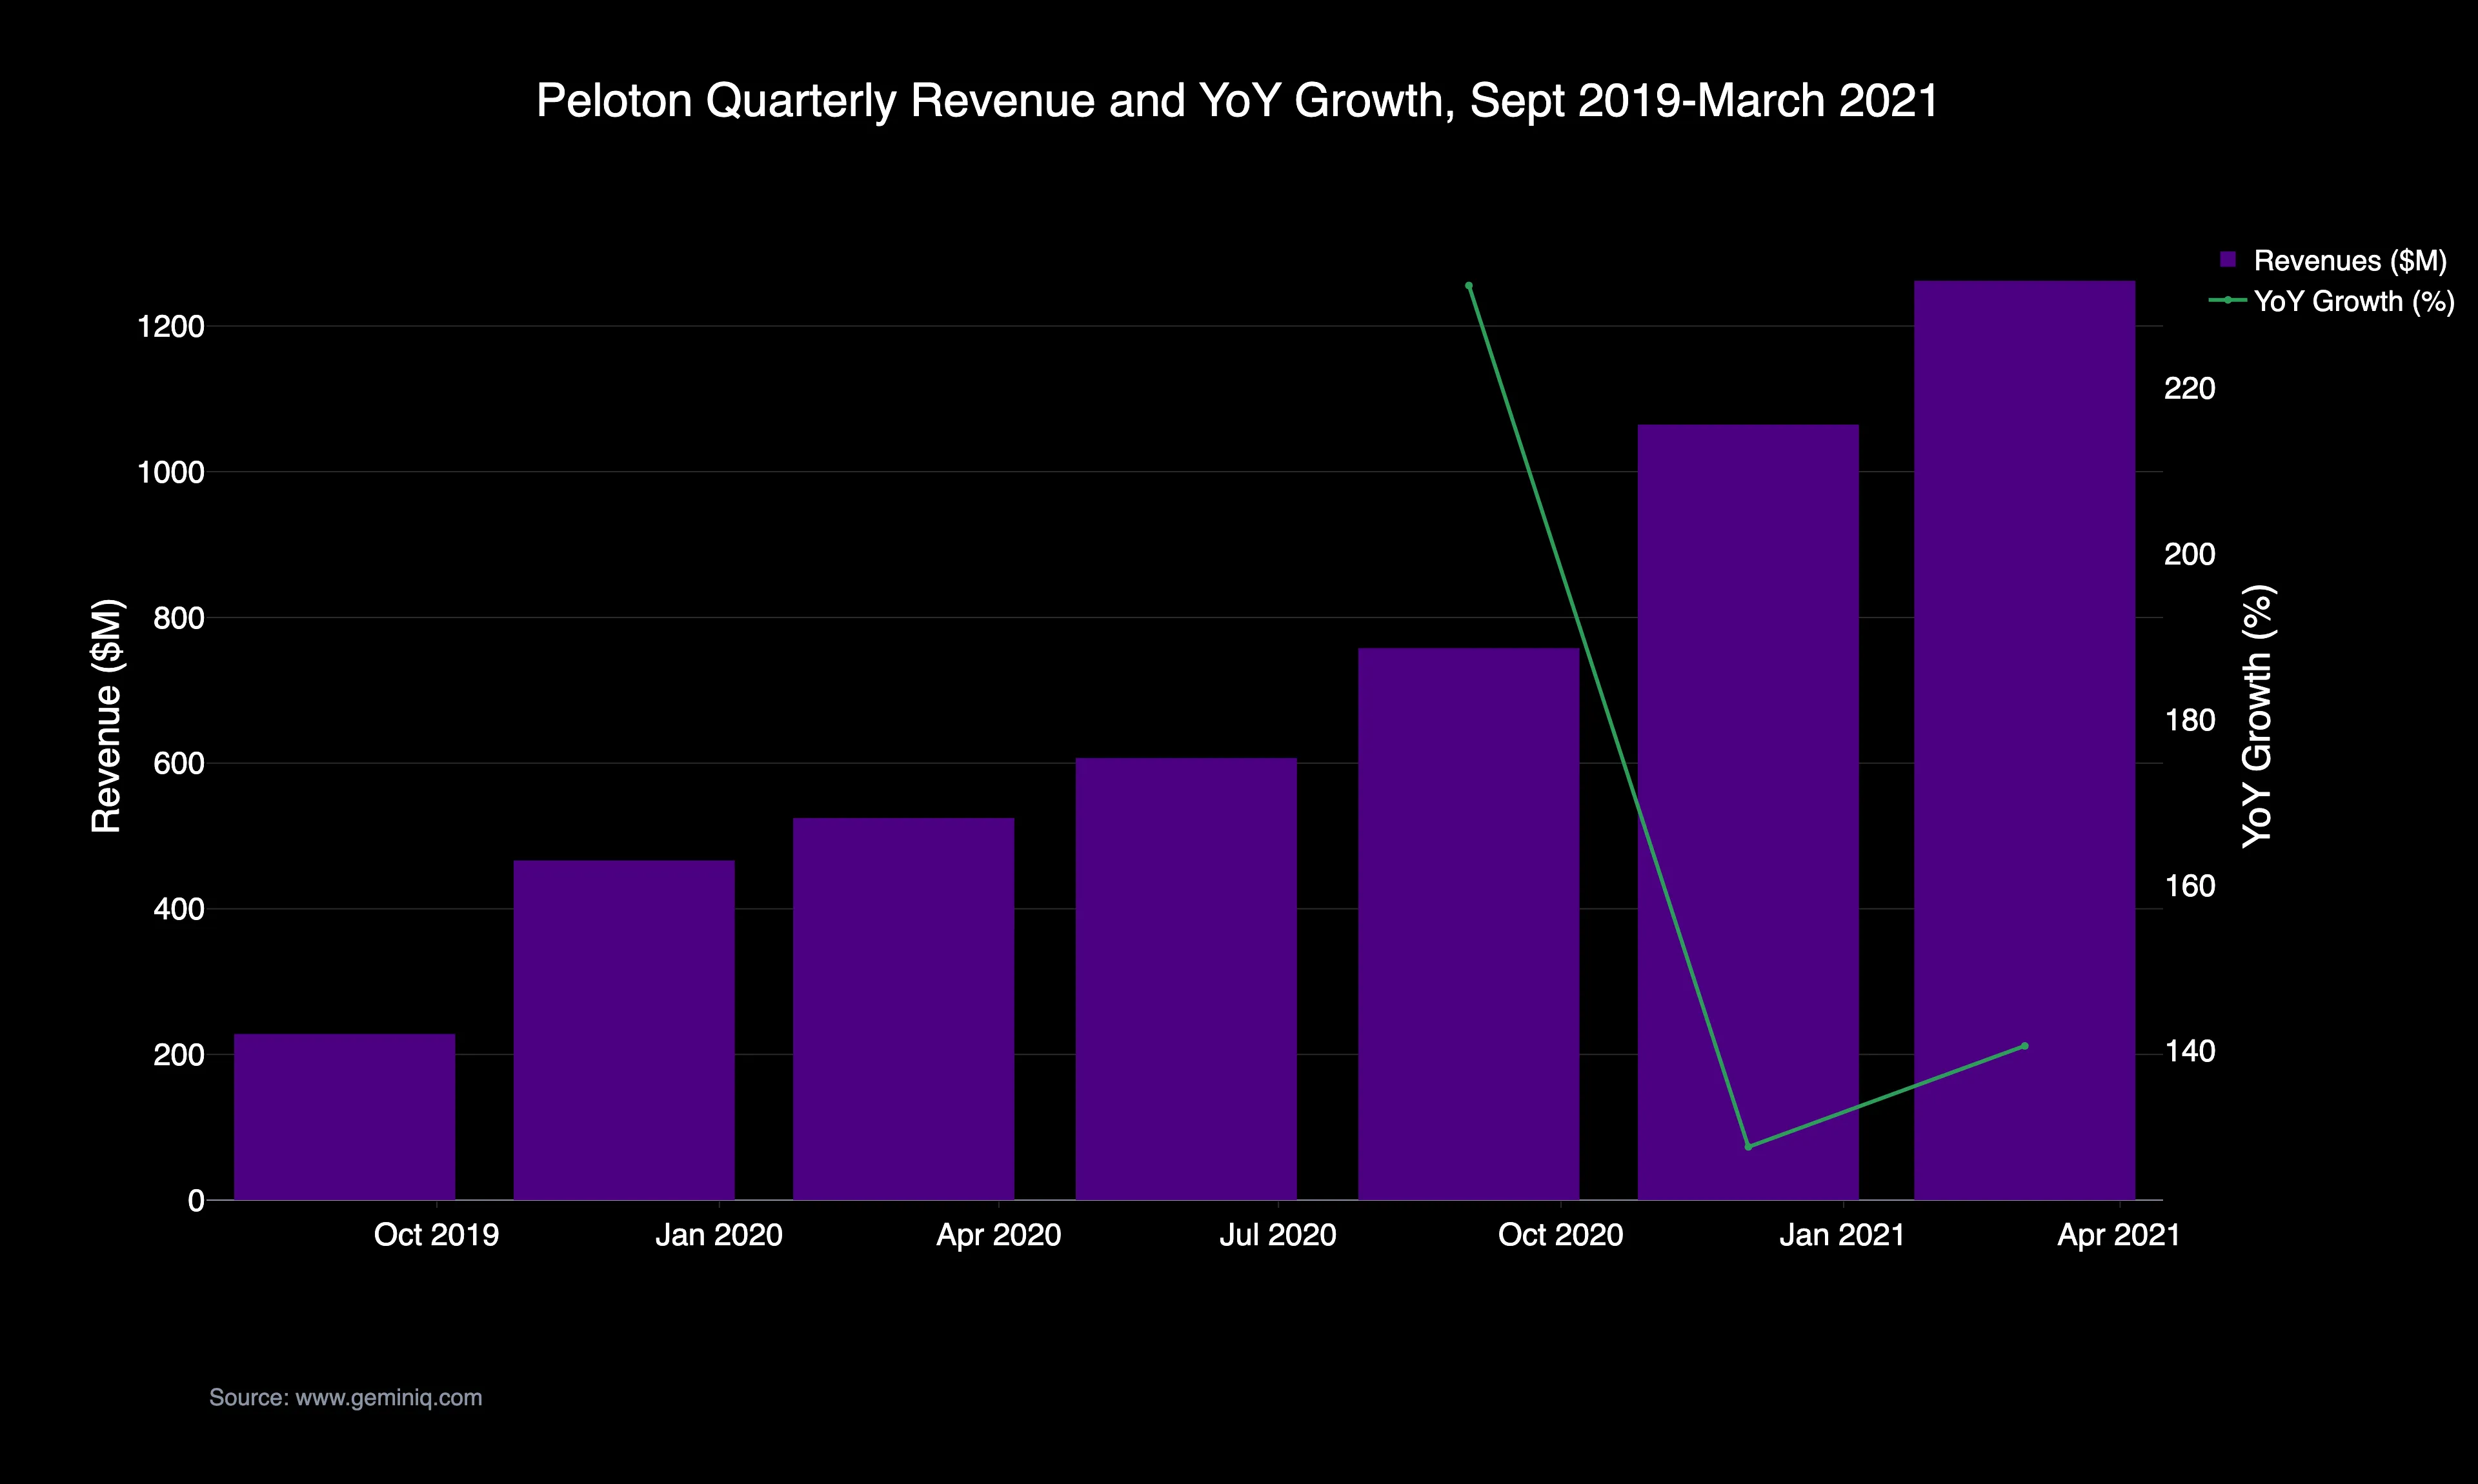
The Filing Data: Peloton's Revenues grew from $228.0 Million in its first quarter as a public company (September 2019) to $757.9 Million by September 2020 — a 232.4% year-over-year jump. The acceleration didn't stop there. By December 2020, the same quarter the stock closed at its $151.72 all-time high, quarterly Revenues reached $1,064.8 Million, up 128.4% year-over-year; by March 2021 they reached $1,262.3 Million, up 140.6%. On paper, growth was still accelerating.
The Signal: Underneath the headline growth, Peloton was building manufacturing and warehouse capacity — including its own U.S.-based Peloton Output Park facility — sized for a demand curve that assumed the pandemic buying pattern was permanent rather than pulled-forward. The filings don't show a company managing a temporary surge; they show a company committing capital as if 200%-plus growth was the new baseline. That assumption is exactly what the next four quarters would break.
The Warehouse That Outran the Register
By mid-2021, the media narrative was still "growth stock normalizing" rather than "growth story ending." The stock had already pulled back from its December 2020 high, but a pullback after a 400%-plus pandemic run reads as healthy, not terminal. It wasn't being read against the balance sheet.
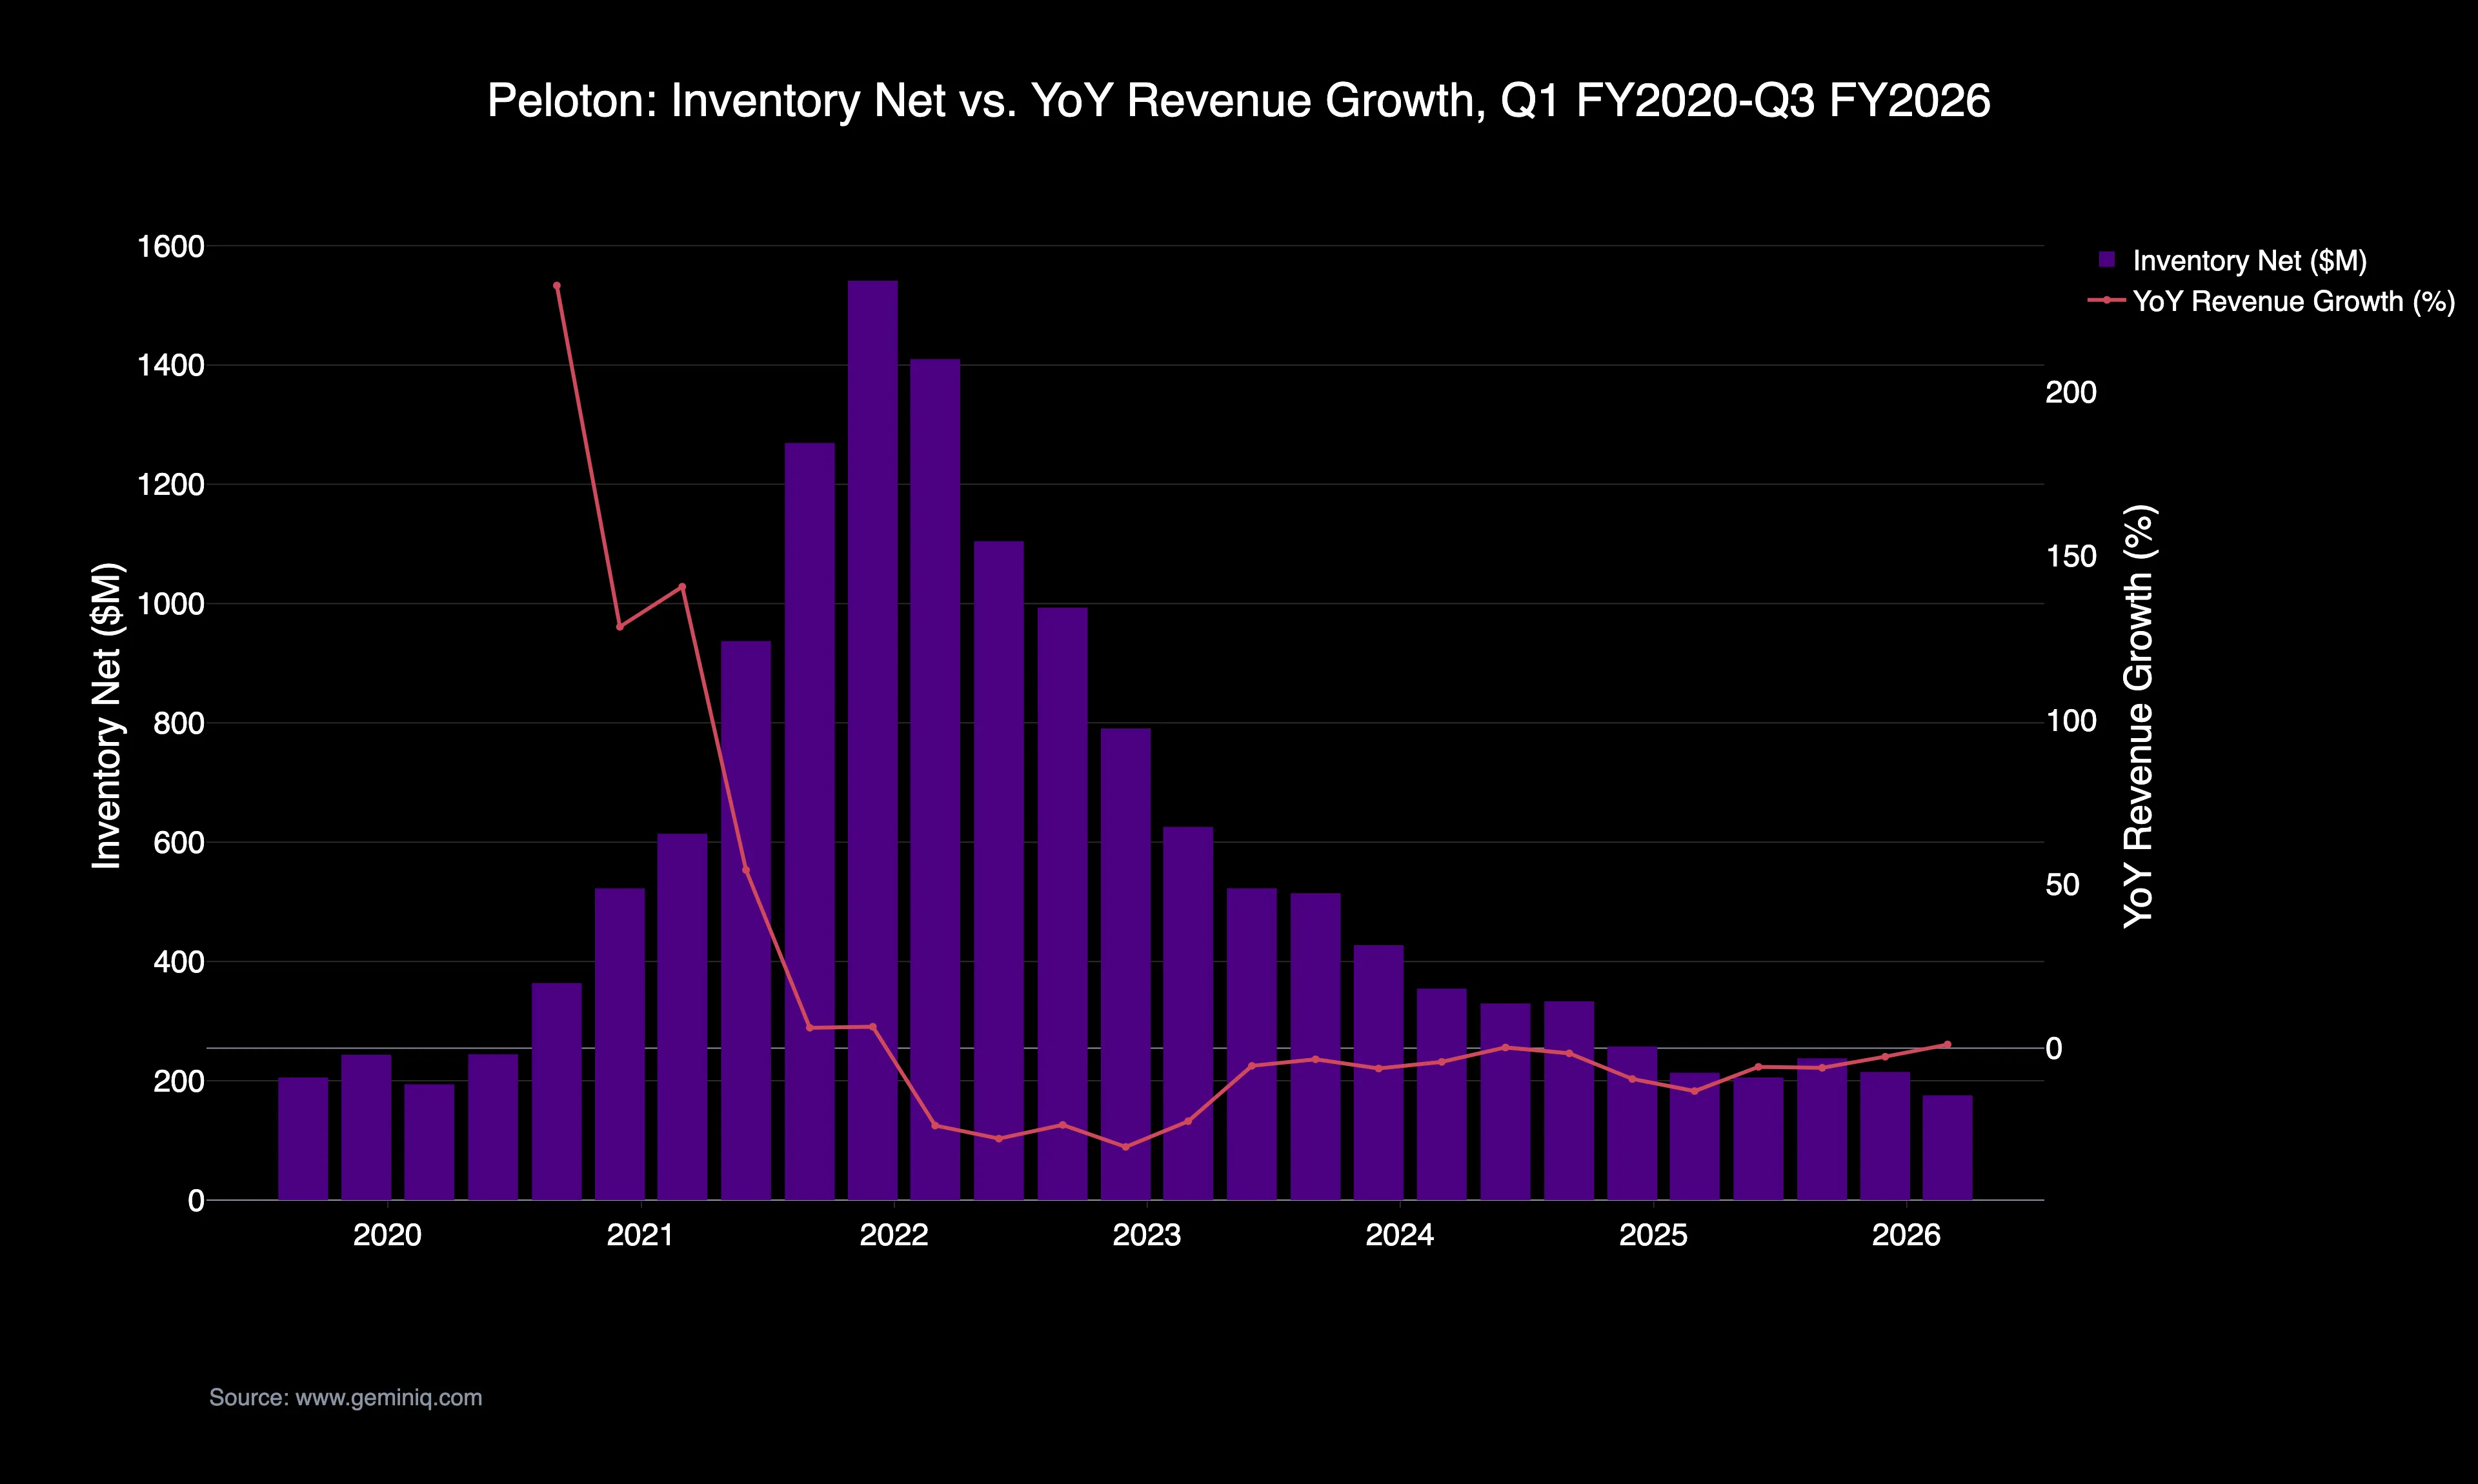
The Filing Data: In the June 2021 quarter, Peloton's Revenues grew just 54.3% year-over-year — a sharp deceleration from the 140.6% posted the quarter before — while Inventory Net climbed to $937.1 Million, an all-time high at the time. By the September 2021 quarter, revenue growth had collapsed further to 6.2% year-over-year, and Inventory Net had grown to a new record of $1,269.2 Million. Days Inventory Outstanding, GeminIQ's calculated measure of how long inventory sits before it sells, rose from 66.9 days in March 2021 to 84.0 days in June 2021 to 111.2 days in September 2021. By the December 2021 quarter — the same quarter Peloton's board would announce a leadership change — Inventory Net peaked at $1,541.3 Million with Days Inventory Outstanding at 130.2 days. Year-over-year revenue growth, in that same filing, had fallen to just 6.5%.
The Signal: A retailer holding inventory for 130 days while its own sales growth has crashed to single digits is not managing seasonal stocking — it's sitting on unsold product it can't move. GeminIQ's Days Inventory Outstanding metric turned the disconnect into a single trackable number nearly a full year before it showed up as a headline. The eventual reckoning arrived in the June 2022 quarter. Cost Of Goods Sold of $708.5 Million exceeded Revenues of $678.7 Million outright, and Gross Profit went negative, at -$29.8 Million, as accumulated inventory finally hit the income statement through markdowns and write-downs. The inventory sat on the balance sheet in plain view the entire time — as did what Peloton's own executives were doing with their own shares.
What Insiders Did With Their Own Shares
The bull case through 2020 and 2021 leaned heavily on conviction — the idea that the people who built Peloton believed in the growth story as much as the market did. GeminIQ's raw Form 4 feed tells a different story about where that conviction actually went.
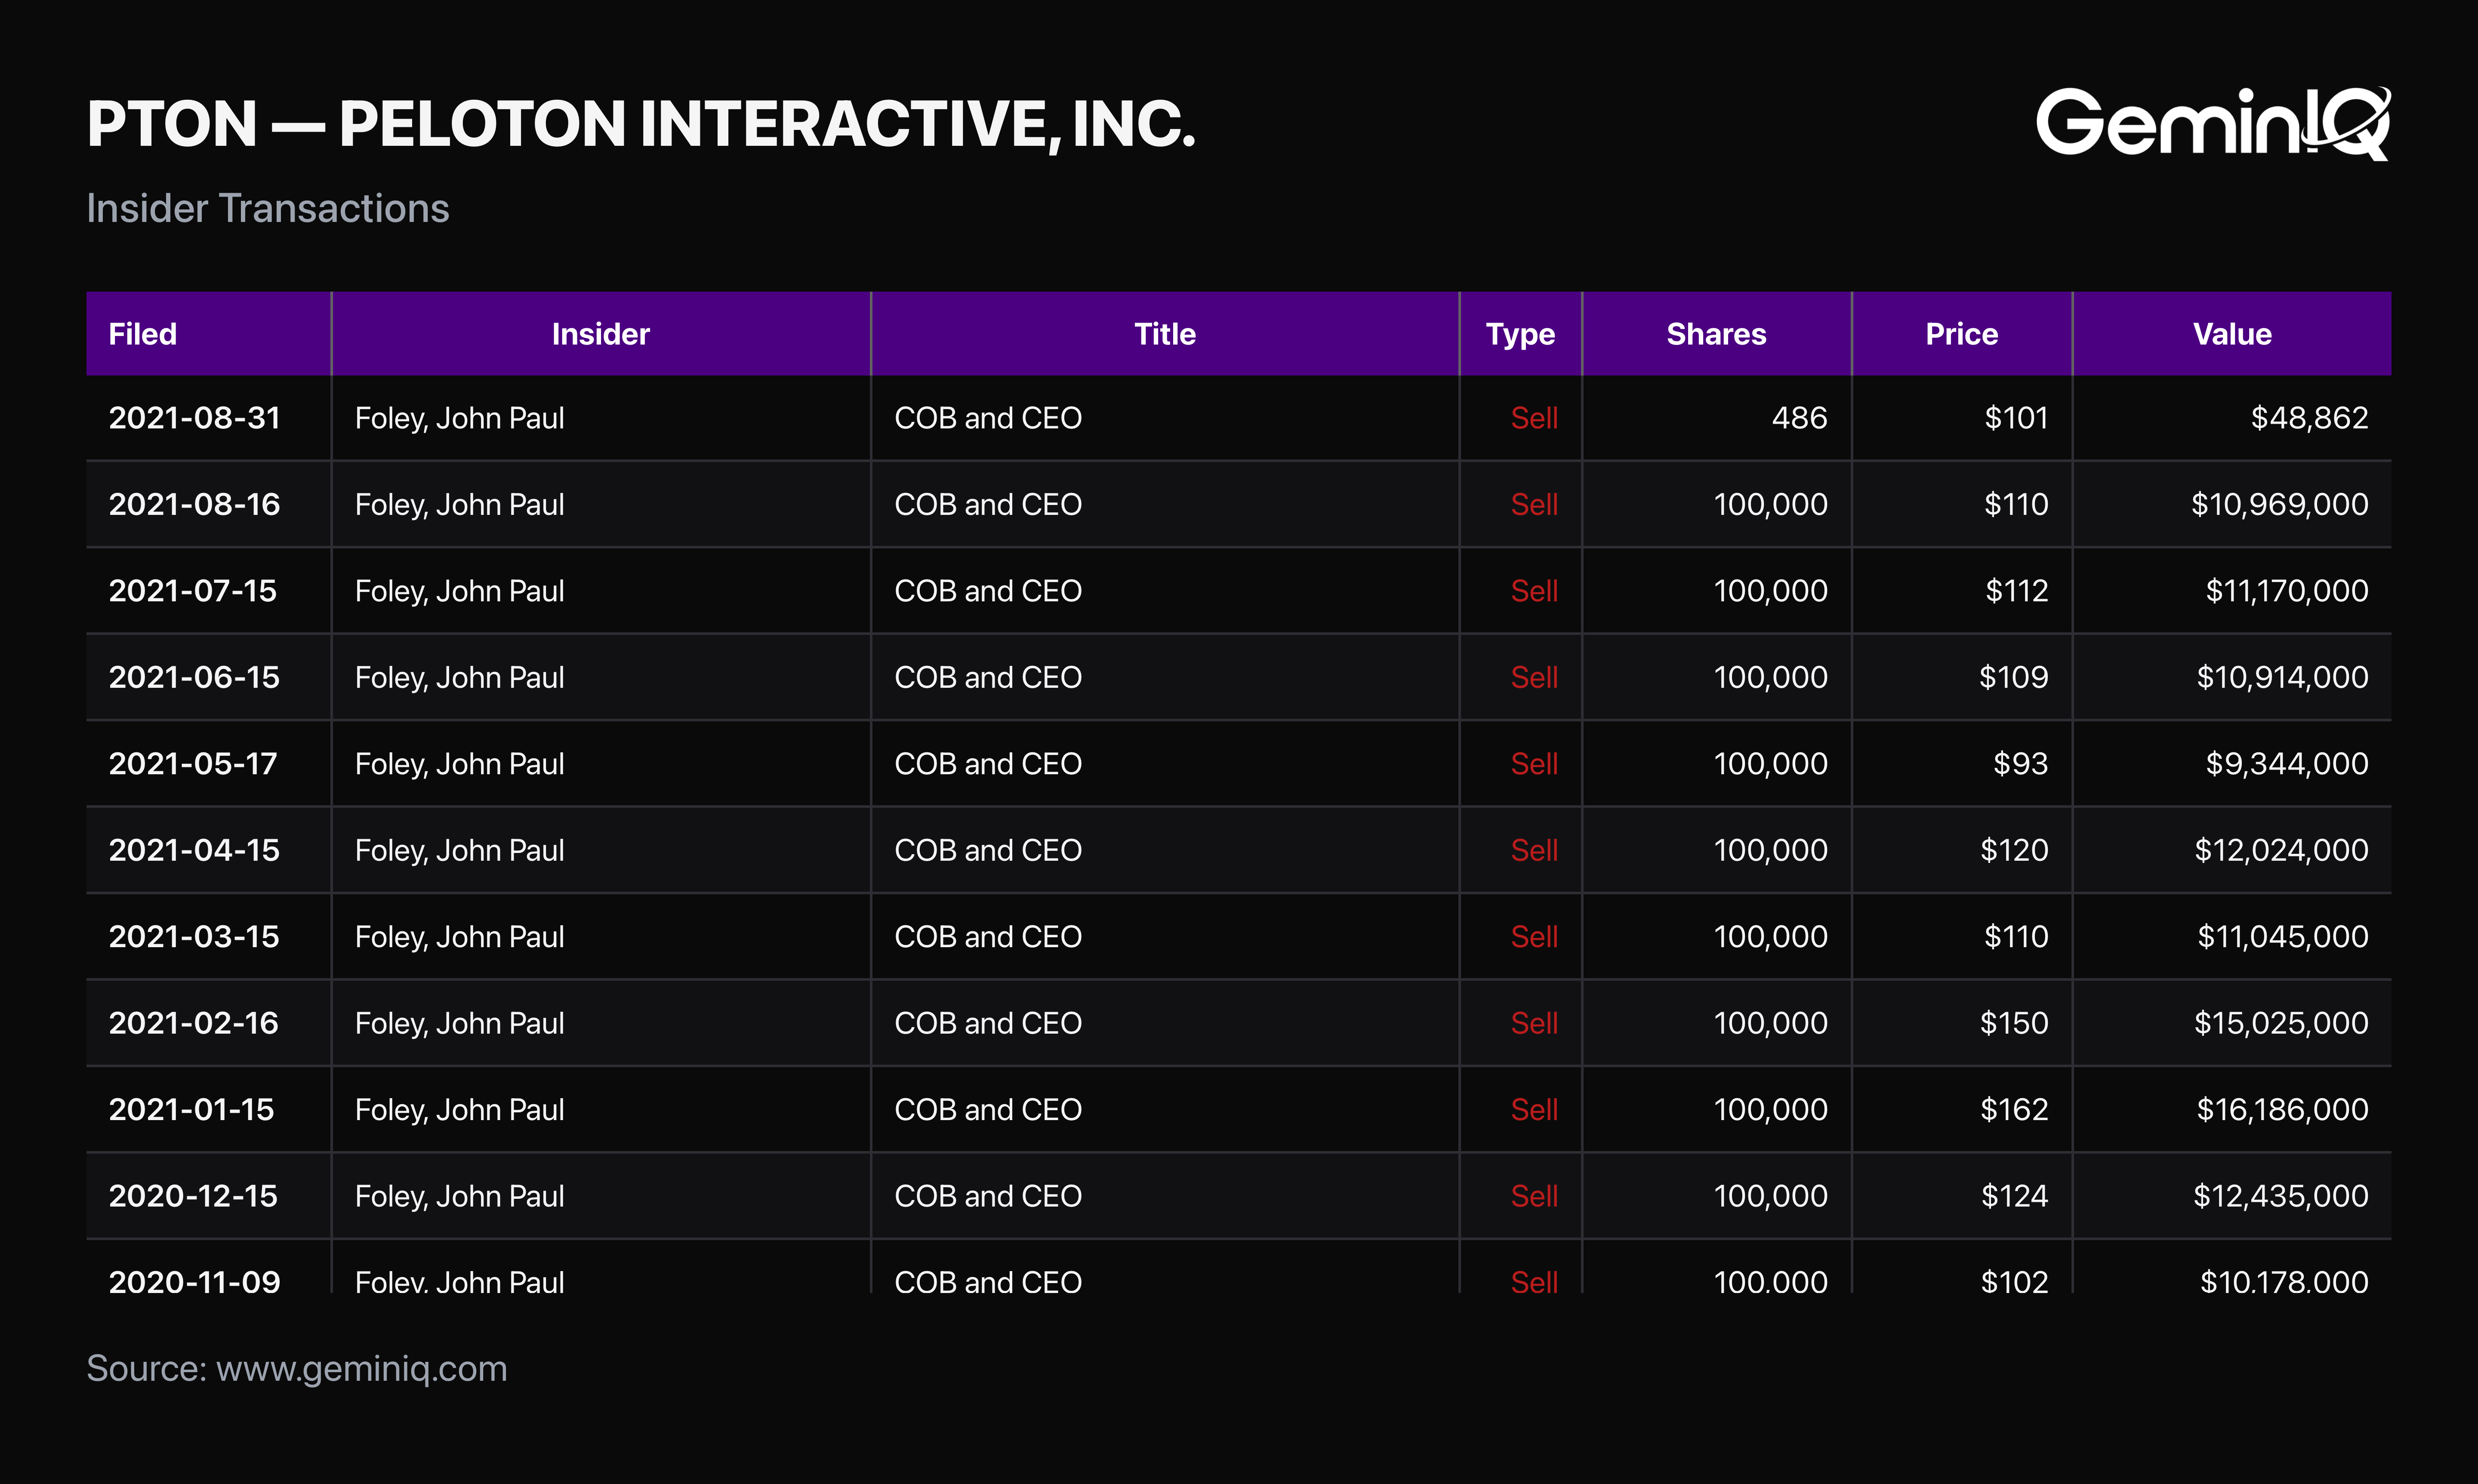
The Filing Data: Between November 2020 and August 2021, founder and then-CEO John Foley sold 100,000 shares in nearly every single month, at prices ranging from $93.44 to $161.86 a share, for a combined $119.3 Million. He was far from alone: over 2020 and 2021 combined, Peloton's officers and directors sold $1,042.2 Million worth of stock — 94.4% of every dollar of insider selling in the company's entire history through the most recent quarter in this study. Over that same two-year window, GeminIQ's 13F institutional ownership tracker shows institutional ownership of Peloton shares actually rose, from 69.2% in March 2021 to 81.4% by December 2021.
The Signal: The people with the earliest read on the inventory and growth numbers above were net sellers, consistently, at prices between $87 and $162, while outside institutional capital was still net buying into the decline. Institutional and insider Form 4/13F data on GeminIQ is quarterly, not real-time, so this isn't a live signal — it's a pattern visible only in hindsight, across the filings, exactly like the inventory buildup above. But the direction of that pattern — one founder, eleven monthly sales, zero purchases — is not something a single earnings call or press release would have surfaced.
The Dilution Ratio That Read 1.00 While the Share Count Kept Climbing
A screener glancing at Peloton's Dilution Ratio during its collapse would have seen almost nothing wrong. That's the trap.
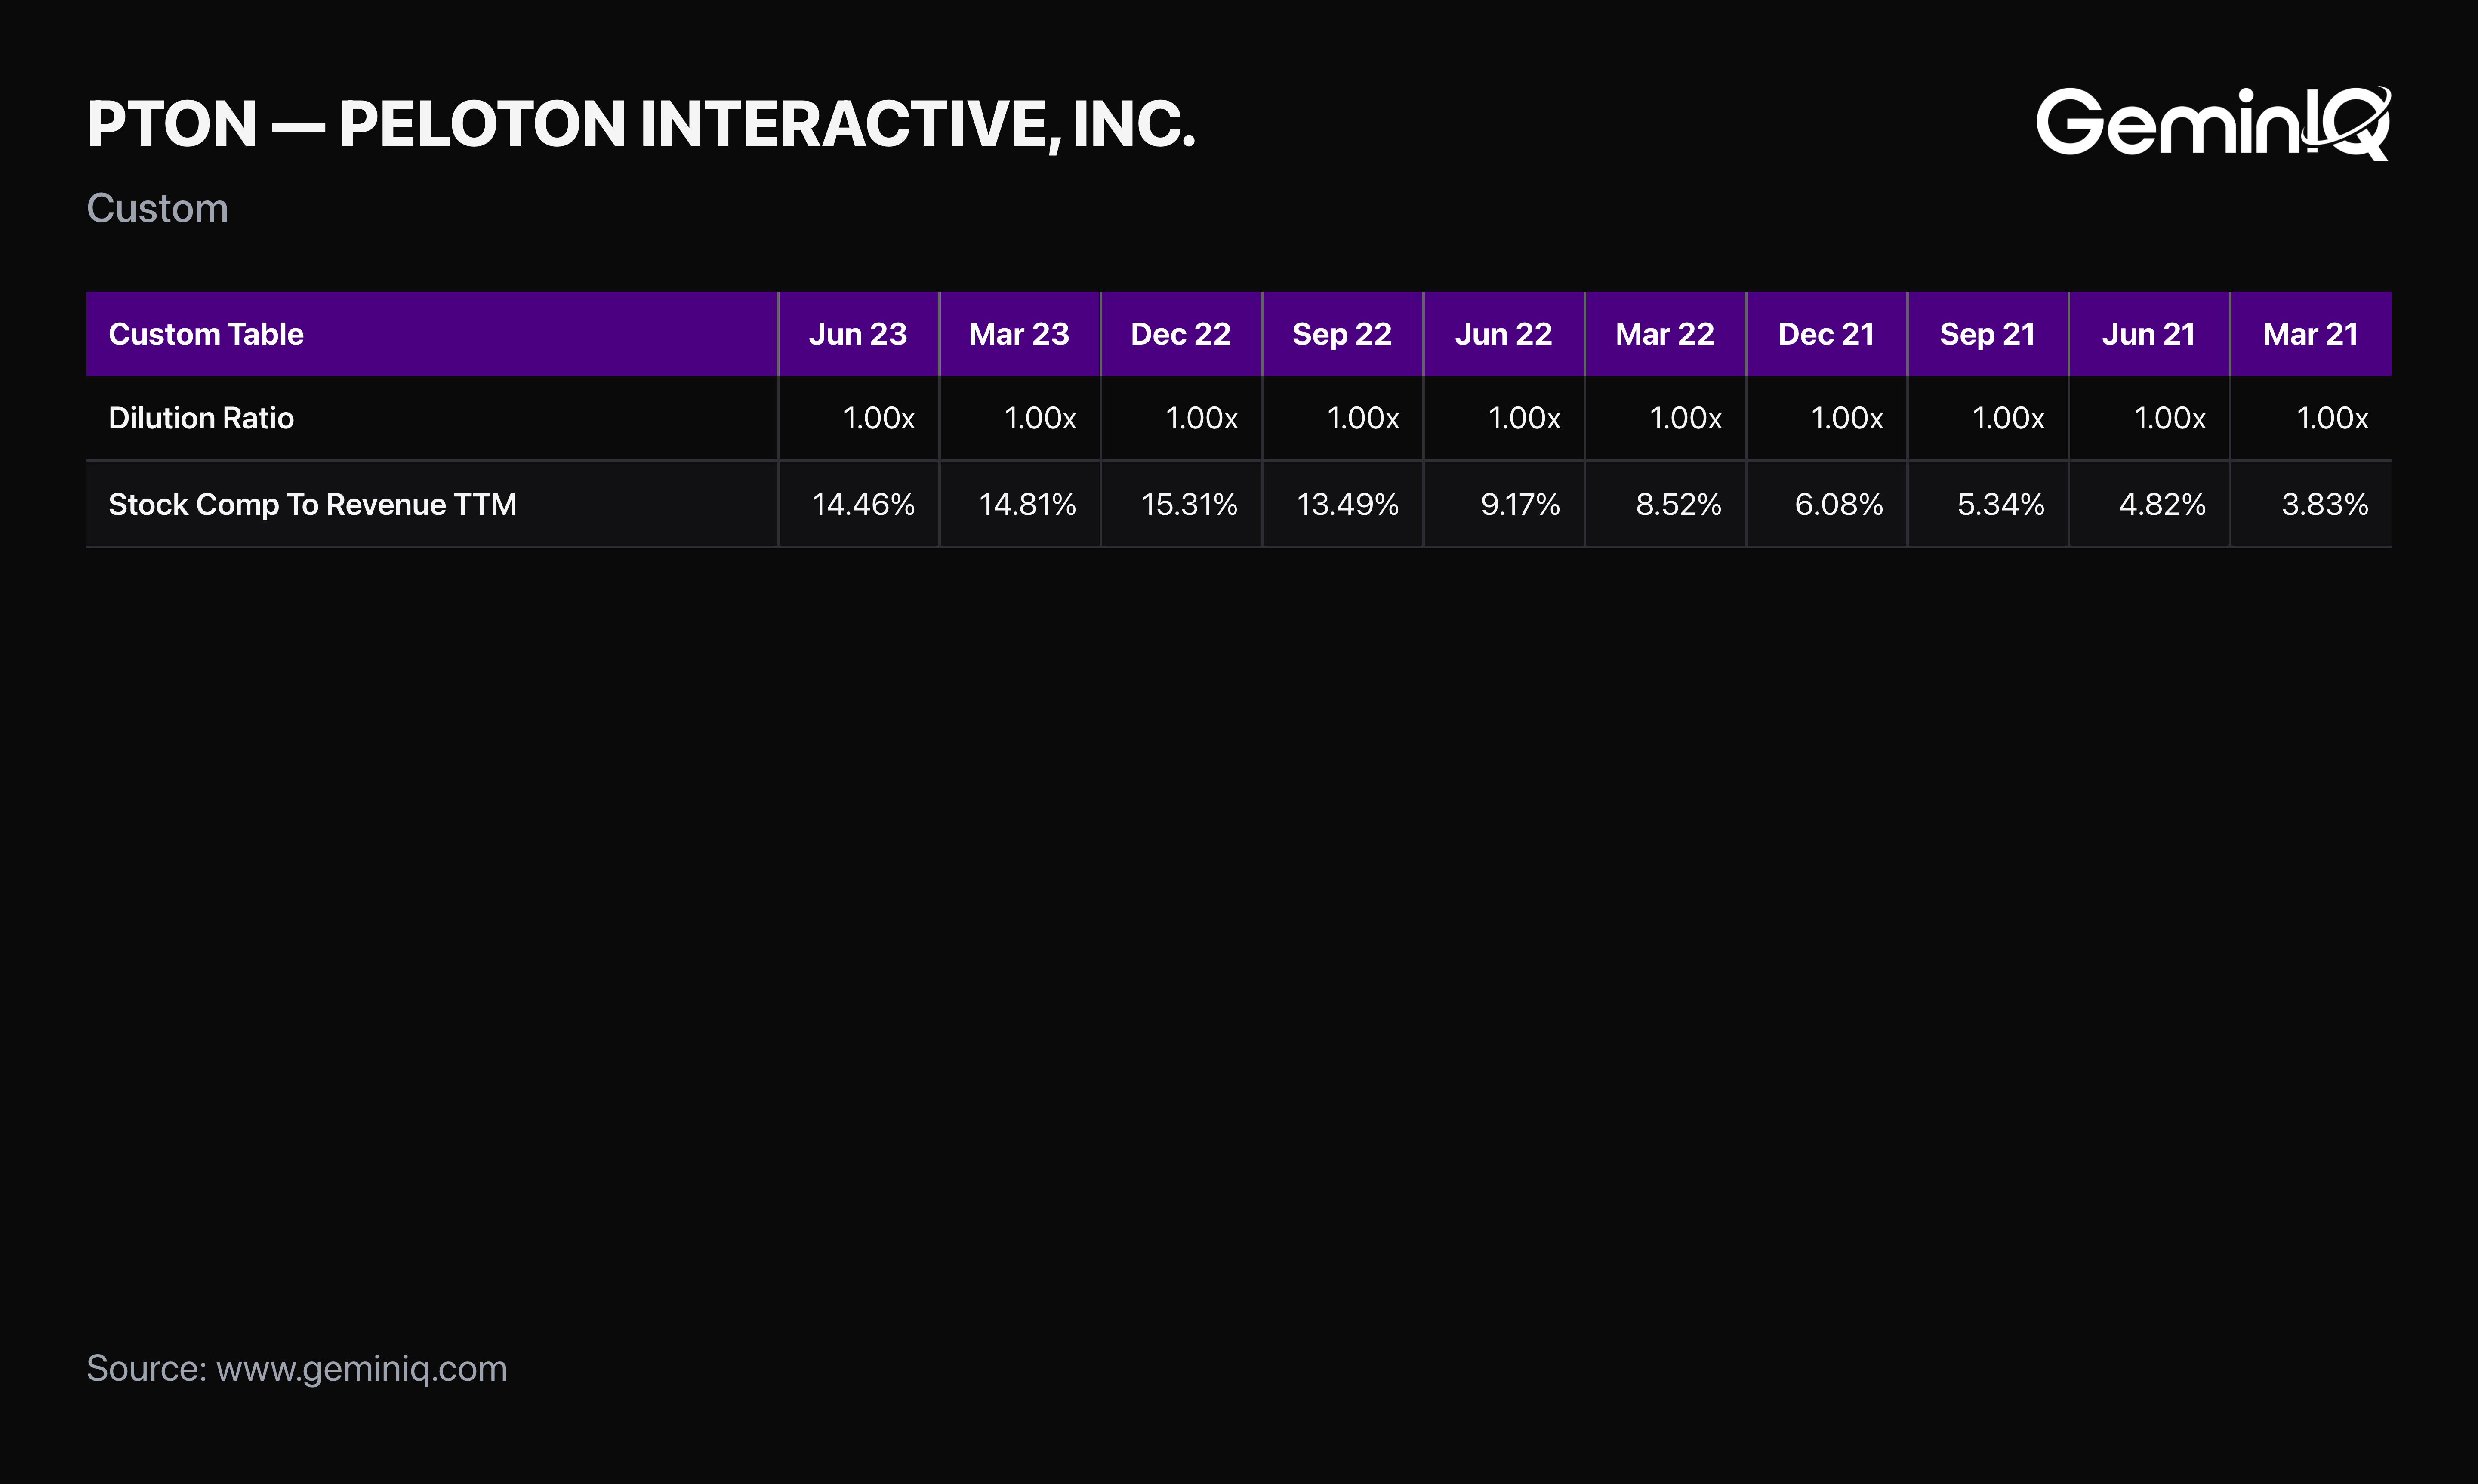
The Filing Data: GeminIQ's Dilution Ratio — diluted shares divided by basic shares — read a flat 1.00 for nearly every quarter from mid-2021 through 2025. Over that same stretch, Weighted Average Number Of Shares Outstanding Basic grew from 269,177,048 at Peloton's September 2019 IPO quarter to 428,911,447 by March 2026, a 59.3% increase, while Share Based Compensation climbed from $18.7 Million in the September 2019 quarter to a peak of $182.1 Million in a single quarter by September 2022. GeminIQ's Stock-Based Compensation to Revenue metric rose from 3.83% of trailing revenue in March 2021 to 15.31% by December 2022 — more than fifteen cents of every revenue dollar going to equity compensation at the peak.
The Signal: A Dilution Ratio of exactly 1.00 means GAAP's treasury-stock method found no dilutive securities worth counting — which happens automatically once a company is posting a net loss, because options and converts become anti-dilutive by rule. The dilution didn't stop; it just moved out of the ratio and into the raw share count and the SBC expense line, where the erosion still shows up. The tell is in what happened once Peloton edged back toward profitability: by September 2025, with a rare positive quarterly Net Income Loss of $13.9 Million, the Dilution Ratio finally moved off 1.00, to 1.04, and by March 2026 — another profitable quarter — it read 1.19, with Weighted Average Number Of Diluted Shares Outstanding of 512,261,196 against a basic count of 428,911,447. The metric worked exactly as designed the moment there was income for dilution to apply against. It just had nothing to measure against for four straight years of losses.
The Balance Sheet Cracks
The final signal isn't a single quarter — it's the trajectory of the balance sheet itself, and GeminIQ's Altman Z-Score turns that trajectory into a single number with documented distress thresholds.
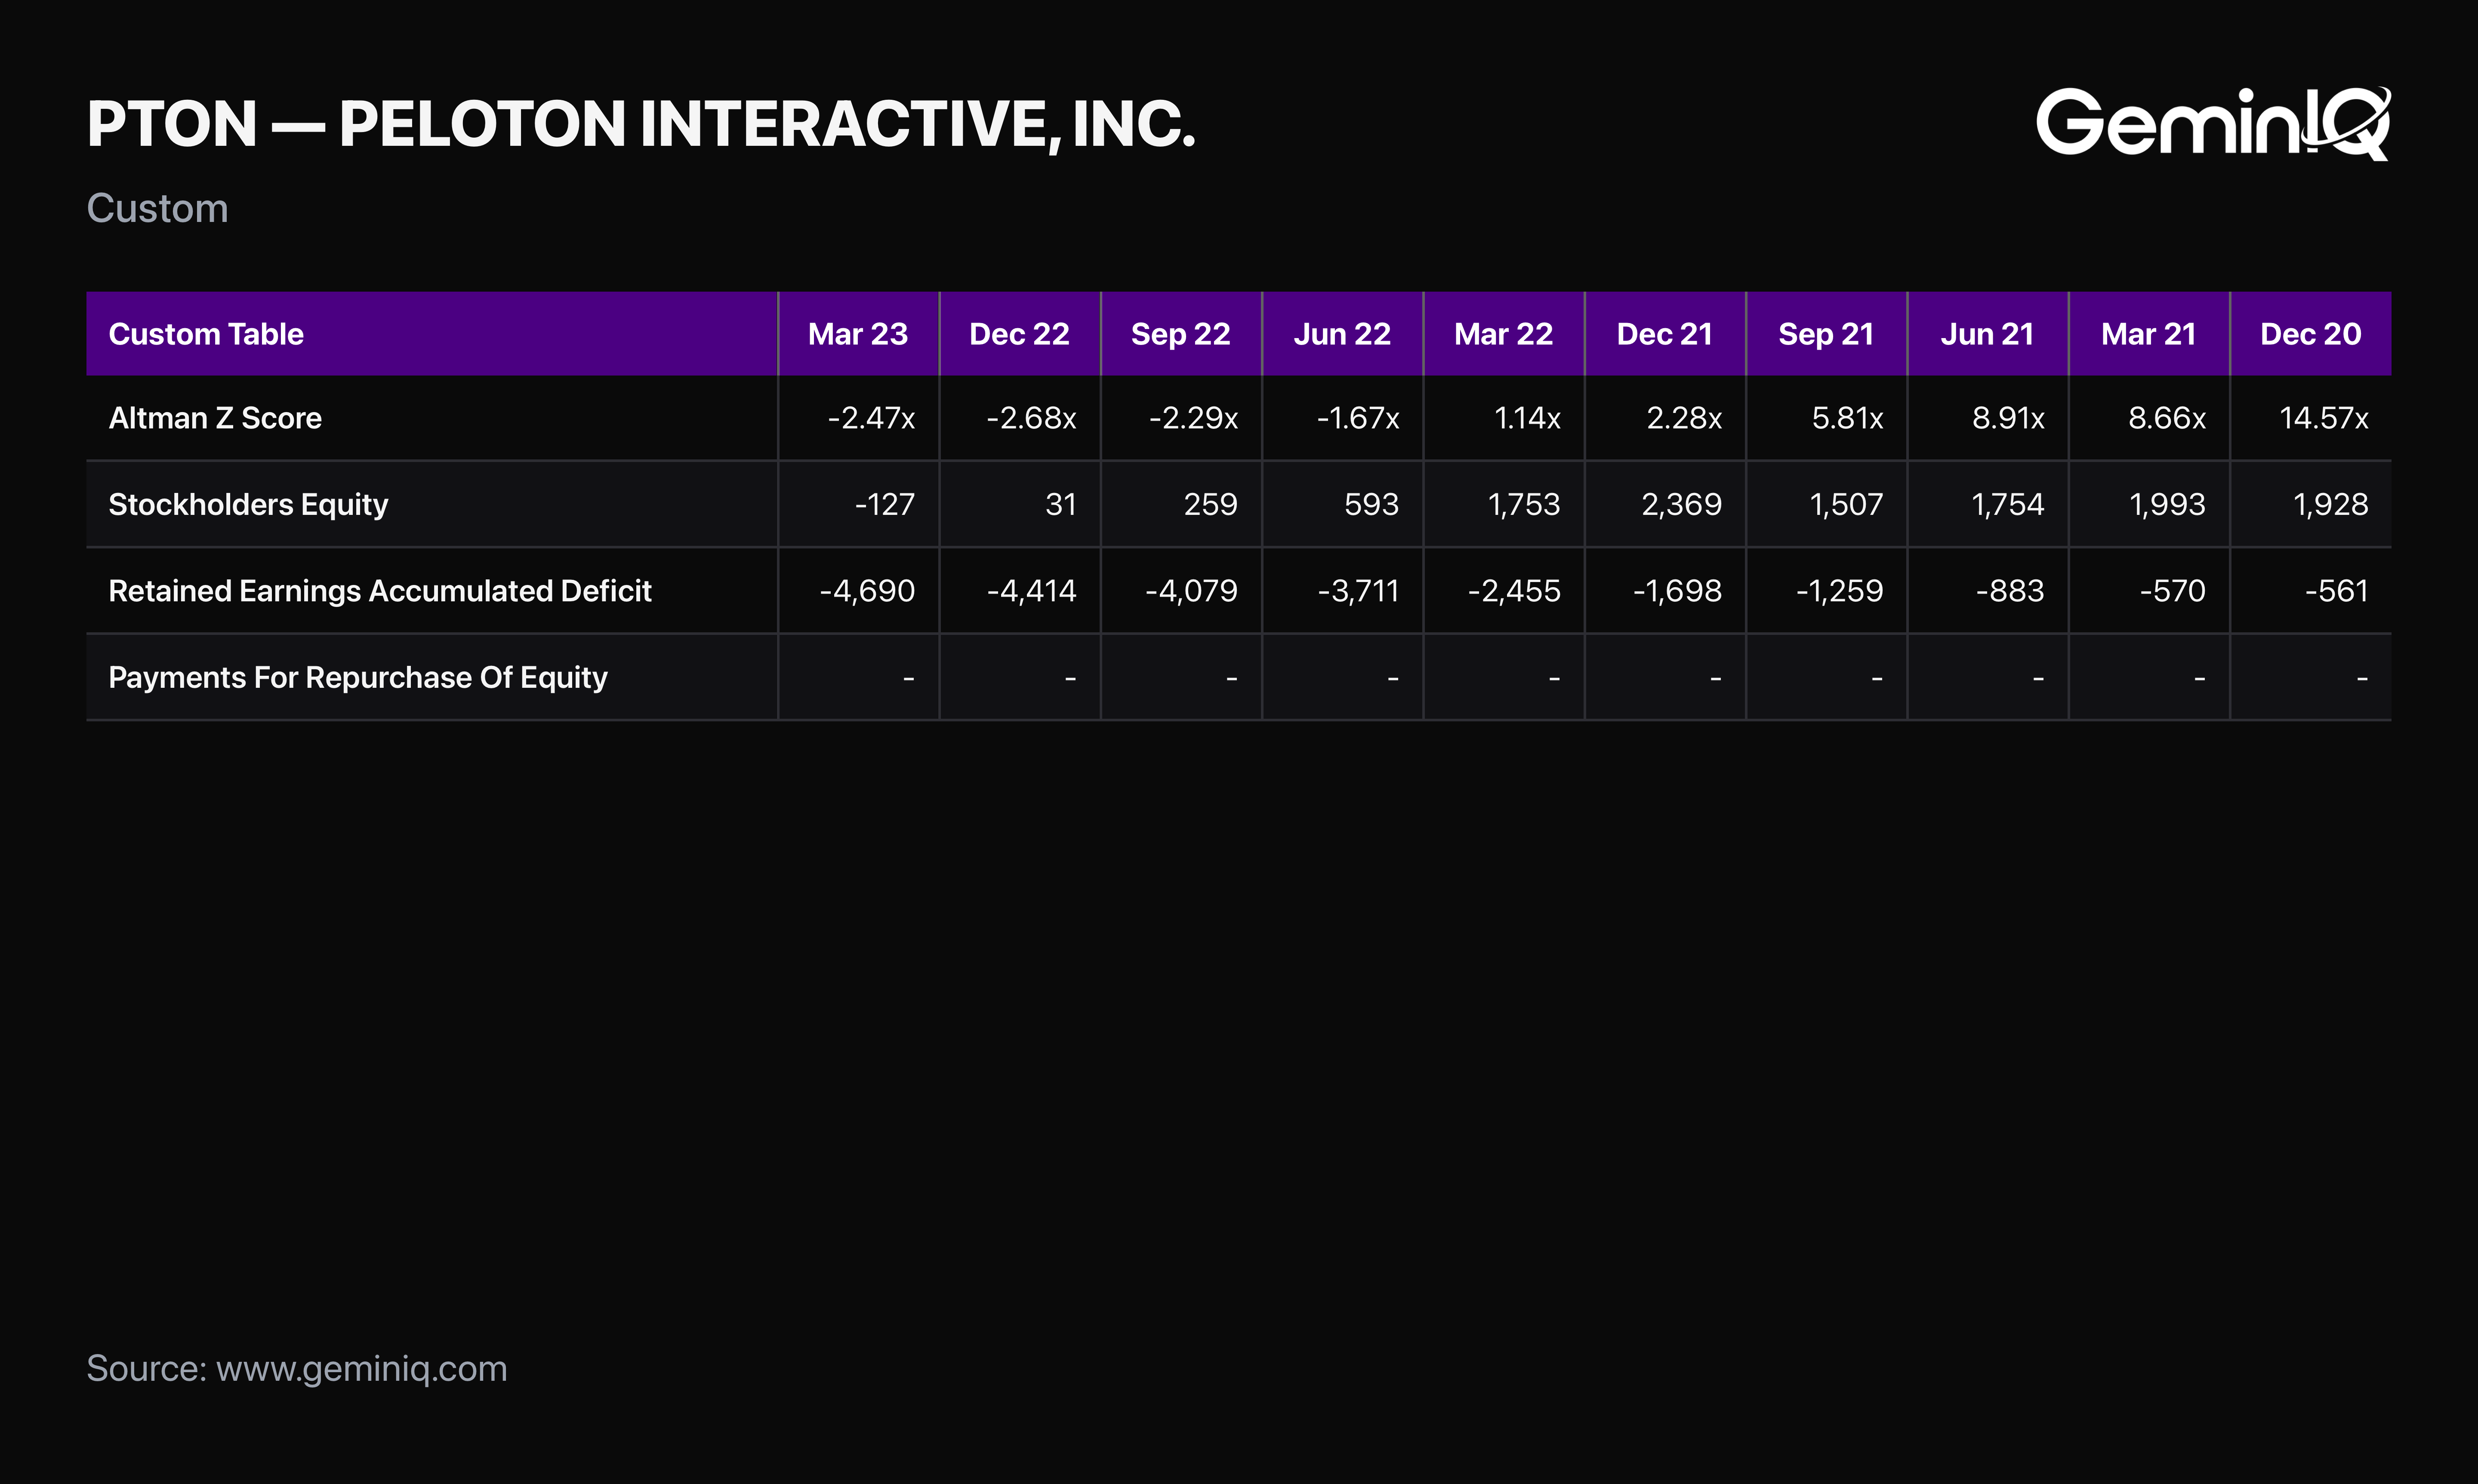
The Filing Data: Peloton's Altman Z-Score stood at 14.57 in December 2020 — deep in the "safe zone" above the 2.99 threshold. By September 2021 it had fallen to 5.81. By December 2021, the same quarter the board announced its leadership change, it had been cut more than in half again, to 2.28 — already below the 2.99 safe-zone line and into the "gray zone." By March 2022, it read 1.14, below the 1.81 distress-zone threshold. By June 2022 it was negative, at -1.67. Total Shareholders' Equity, which stood at $2,368.9 Million in December 2021, fell to $592.9 Million by June 2022 and turned negative for the first time in March 2023, at -$127.0 Million. By then, the accumulated Retained Earnings Accumulated Deficit had reached $4,690.0 Million. Unlike companies where negative equity reflects an aggressive buyback program against strong cash flow, Peloton's Payments For Repurchase Of Equity shows no meaningful buyback activity across this entire window — the negative equity here is accumulated losses, full stop.
The Signal: Each of the four post-filing return windows tracked in this study lines up with the deterioration above. The FY2021 annual report, filed August 27, 2021, was followed by a cumulative three-month return of -52.83%; the next 10-Q, filed November 5, 2021, was followed by -51.37%. Then came February 8, 2022 — the same day Peloton announced John Foley's departure as CEO and roughly 2,800 job cuts — when that quarter's 10-Q was followed by a cumulative three-month return of -52.88%. The final 10-Q in this window, filed May 10, 2022 and the first to report a negative Gross Profit, was followed by -26.43%. None of these figures predict what any stock does next; they describe, in this single company's own history, what happened after each filing landed.
What the Filings Said Before the Market Knew
Stack the signals against the calendar, and the September 30, 2021 10-Q — filed November 5, 2021 — is the point where three of them were already sitting in the same filing at once. Inventory Net had just hit a then-all-time high of $1,269.2 Million with Days Inventory Outstanding at 111.2 days, up from 66.9 days two quarters earlier. Year-over-year revenue growth had crashed to 6.2%, down from 140.6% two quarters before that. And John Foley had, by that point, sold 100,000 shares in ten of the previous eleven months, with no offsetting open-market purchases from company insiders anywhere in the record. The Altman Z-Score in that same filing had been cut nearly in half in a single quarter, from 8.91 to 5.81.
The stock closed that September quarter at $87.05 — down 43% from its all-time high, but still more than nineteen times higher than where it would eventually trade. The market had priced in a pullback. The filings, read together rather than one line at a time, were already describing something closer to a structural break. The CEO change and the goodwill impairment that "confirmed" the story to headlines wouldn't arrive for another four and five months, respectively — and by then the stock had already fallen another 60%.
Check Your Holdings
This isn't a Peloton-specific pattern — it's a repeatable check anyone can run against their own portfolio inside GeminIQ. Pull up Calculated Metrics for any company you hold and look at Days Inventory Outstanding next to trailing revenue growth: rising Days Inventory Outstanding alongside decelerating revenue growth for two consecutive quarters is the exact combination that showed up in Peloton's filings a year before the headlines caught up. Then open Insider Transactions and check whether officer and director activity is one-directional — persistent selling with zero open-market buying, especially from founders, is worth weighing against whatever management says on the earnings call. Finally, track the Altman Z-Score over four or five consecutive quarters rather than as a single snapshot; a score that's fallen out of the 2.99 safe zone into the 1.81–2.99 range is GeminIQ's raw-filing equivalent of a distress flag most aggregator-based screeners won't surface until it's already a headline.
Wall Street's data. Main Street's price.
Institutional terminals charge thousands a year for as-filed accuracy. GeminIQ gives you the same thing for a fraction of the cost: financials built directly from raw SEC EDGAR filings, not third-party APIs, with full XBRL traceability back to the original 10-K or 10-Q. No normalized guesswork, just calculated metrics, charts, screeners, and watchlists built on numbers exactly as the company reported them. Start researching now at GeminIQ.com.
All financial figures in this article are drawn from Peloton Interactive, Inc.'s 10-K and 10-Q filings, filed 2019–2026 and publicly available on SEC EDGAR.
Disclaimer: The content in this blog is for educational and entertainment purposes only and does not constitute financial, legal, or tax advice. Investing involves risk, including the loss of principal. The views expressed are my own and not intended as financial advice or a guarantee of future performance.