
Receivables Growing Faster Than Revenue: Weaker Returns Followed

By Chad Hartman
Published · Last updated
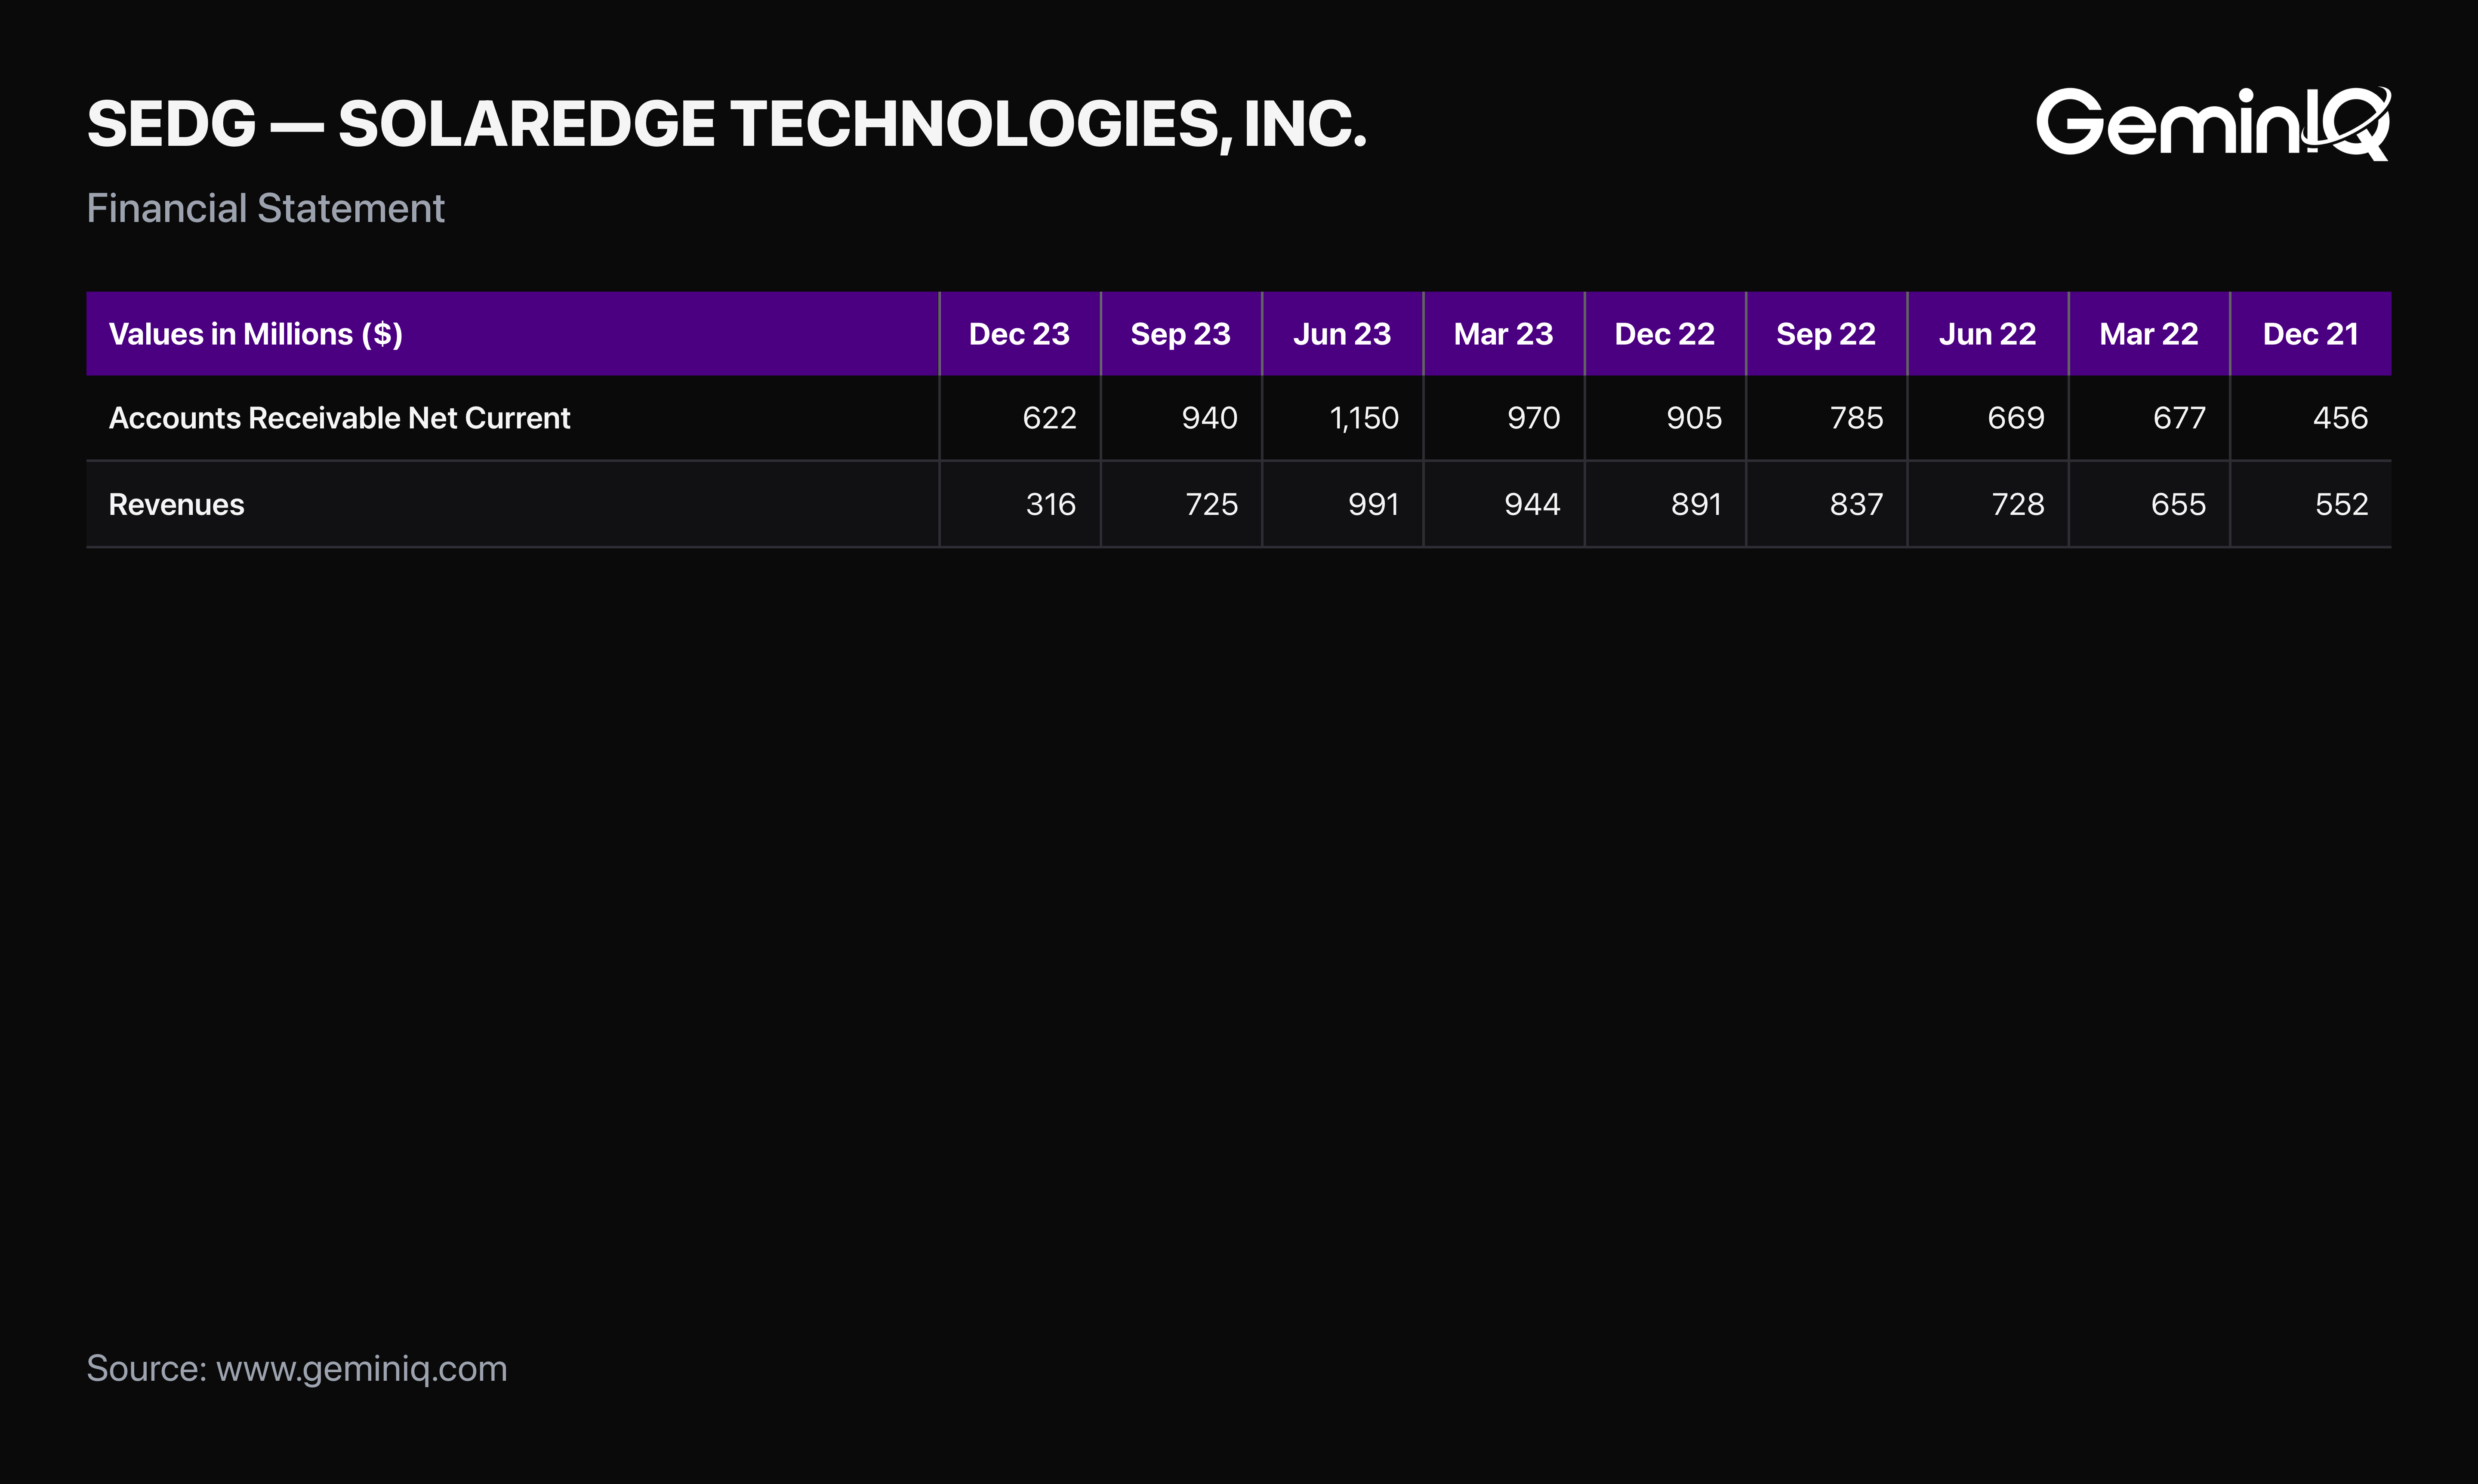
SolarEdge Technologies reported accounts receivable growth of 21.2% against revenue growth of negative 4.3% in the 10-K covering fiscal 2023 — a 25.5-point gap. That's the difference between how fast money owed to the company was growing and how fast the company was actually selling. The twelve months that followed produced a cumulative return of -78.12%. Receivables growing faster than revenue is one of the oldest checks in fundamental analysis, and it is also one of the easiest to verify directly: both figures sit on the filing itself, quarter over quarter, with no estimation required.
This study reads GeminIQ's as-filed universe of quarterly and annual filings, computing the year-over-year growth rate of each filer's trailing-twelve-month receivables figure against GeminIQ's pre-calculated Revenue Growth (1-Year) for each filing, joined to GeminIQ's post-filing market reaction data. 146,882 filing-periods across 5,679 companies have both growth figures computed; 98,668 of those filings also have post-filing return data available, drawn from GeminIQ's partial price-history coverage. The comparison window runs from each filing's own filed date out to twelve months, and every figure below is measured against the broader universe base rate, not against zero. This is a historical association measured over the sample window, not a forecast for any individual company.
The Pattern
Accounts receivable growing faster than revenue means a company is collecting cash more slowly relative to what it reports selling. That gap can open up because credit terms loosened to pull sales forward, because revenue was recognized before cash actually changed hands, or because a small number of customers are paying later than usual. None of that is visible in a headline revenue growth figure. It is visible immediately in the relationship between two lines that already sit on every 10-K and 10-Q: the receivables balance on the balance sheet and revenue on the income statement.
The Data
Filings were sorted into deciles by the spread between year-over-year receivables growth and revenue growth. The top decile — filings where receivables outpaced revenue by the widest margin — is compared against the rest of the universe at four post-filing checkpoints.
| Checkpoint | Top-Decile Gap Cohort (median) | Rest of Universe (median) |
|---|---|---|
| 1 month | 0.00% | 0.61% |
| 3 months | 1.33% | 1.84% |
| 6 months | 0.61% | 2.56% |
| 12 months | 1.90% | 6.02% |
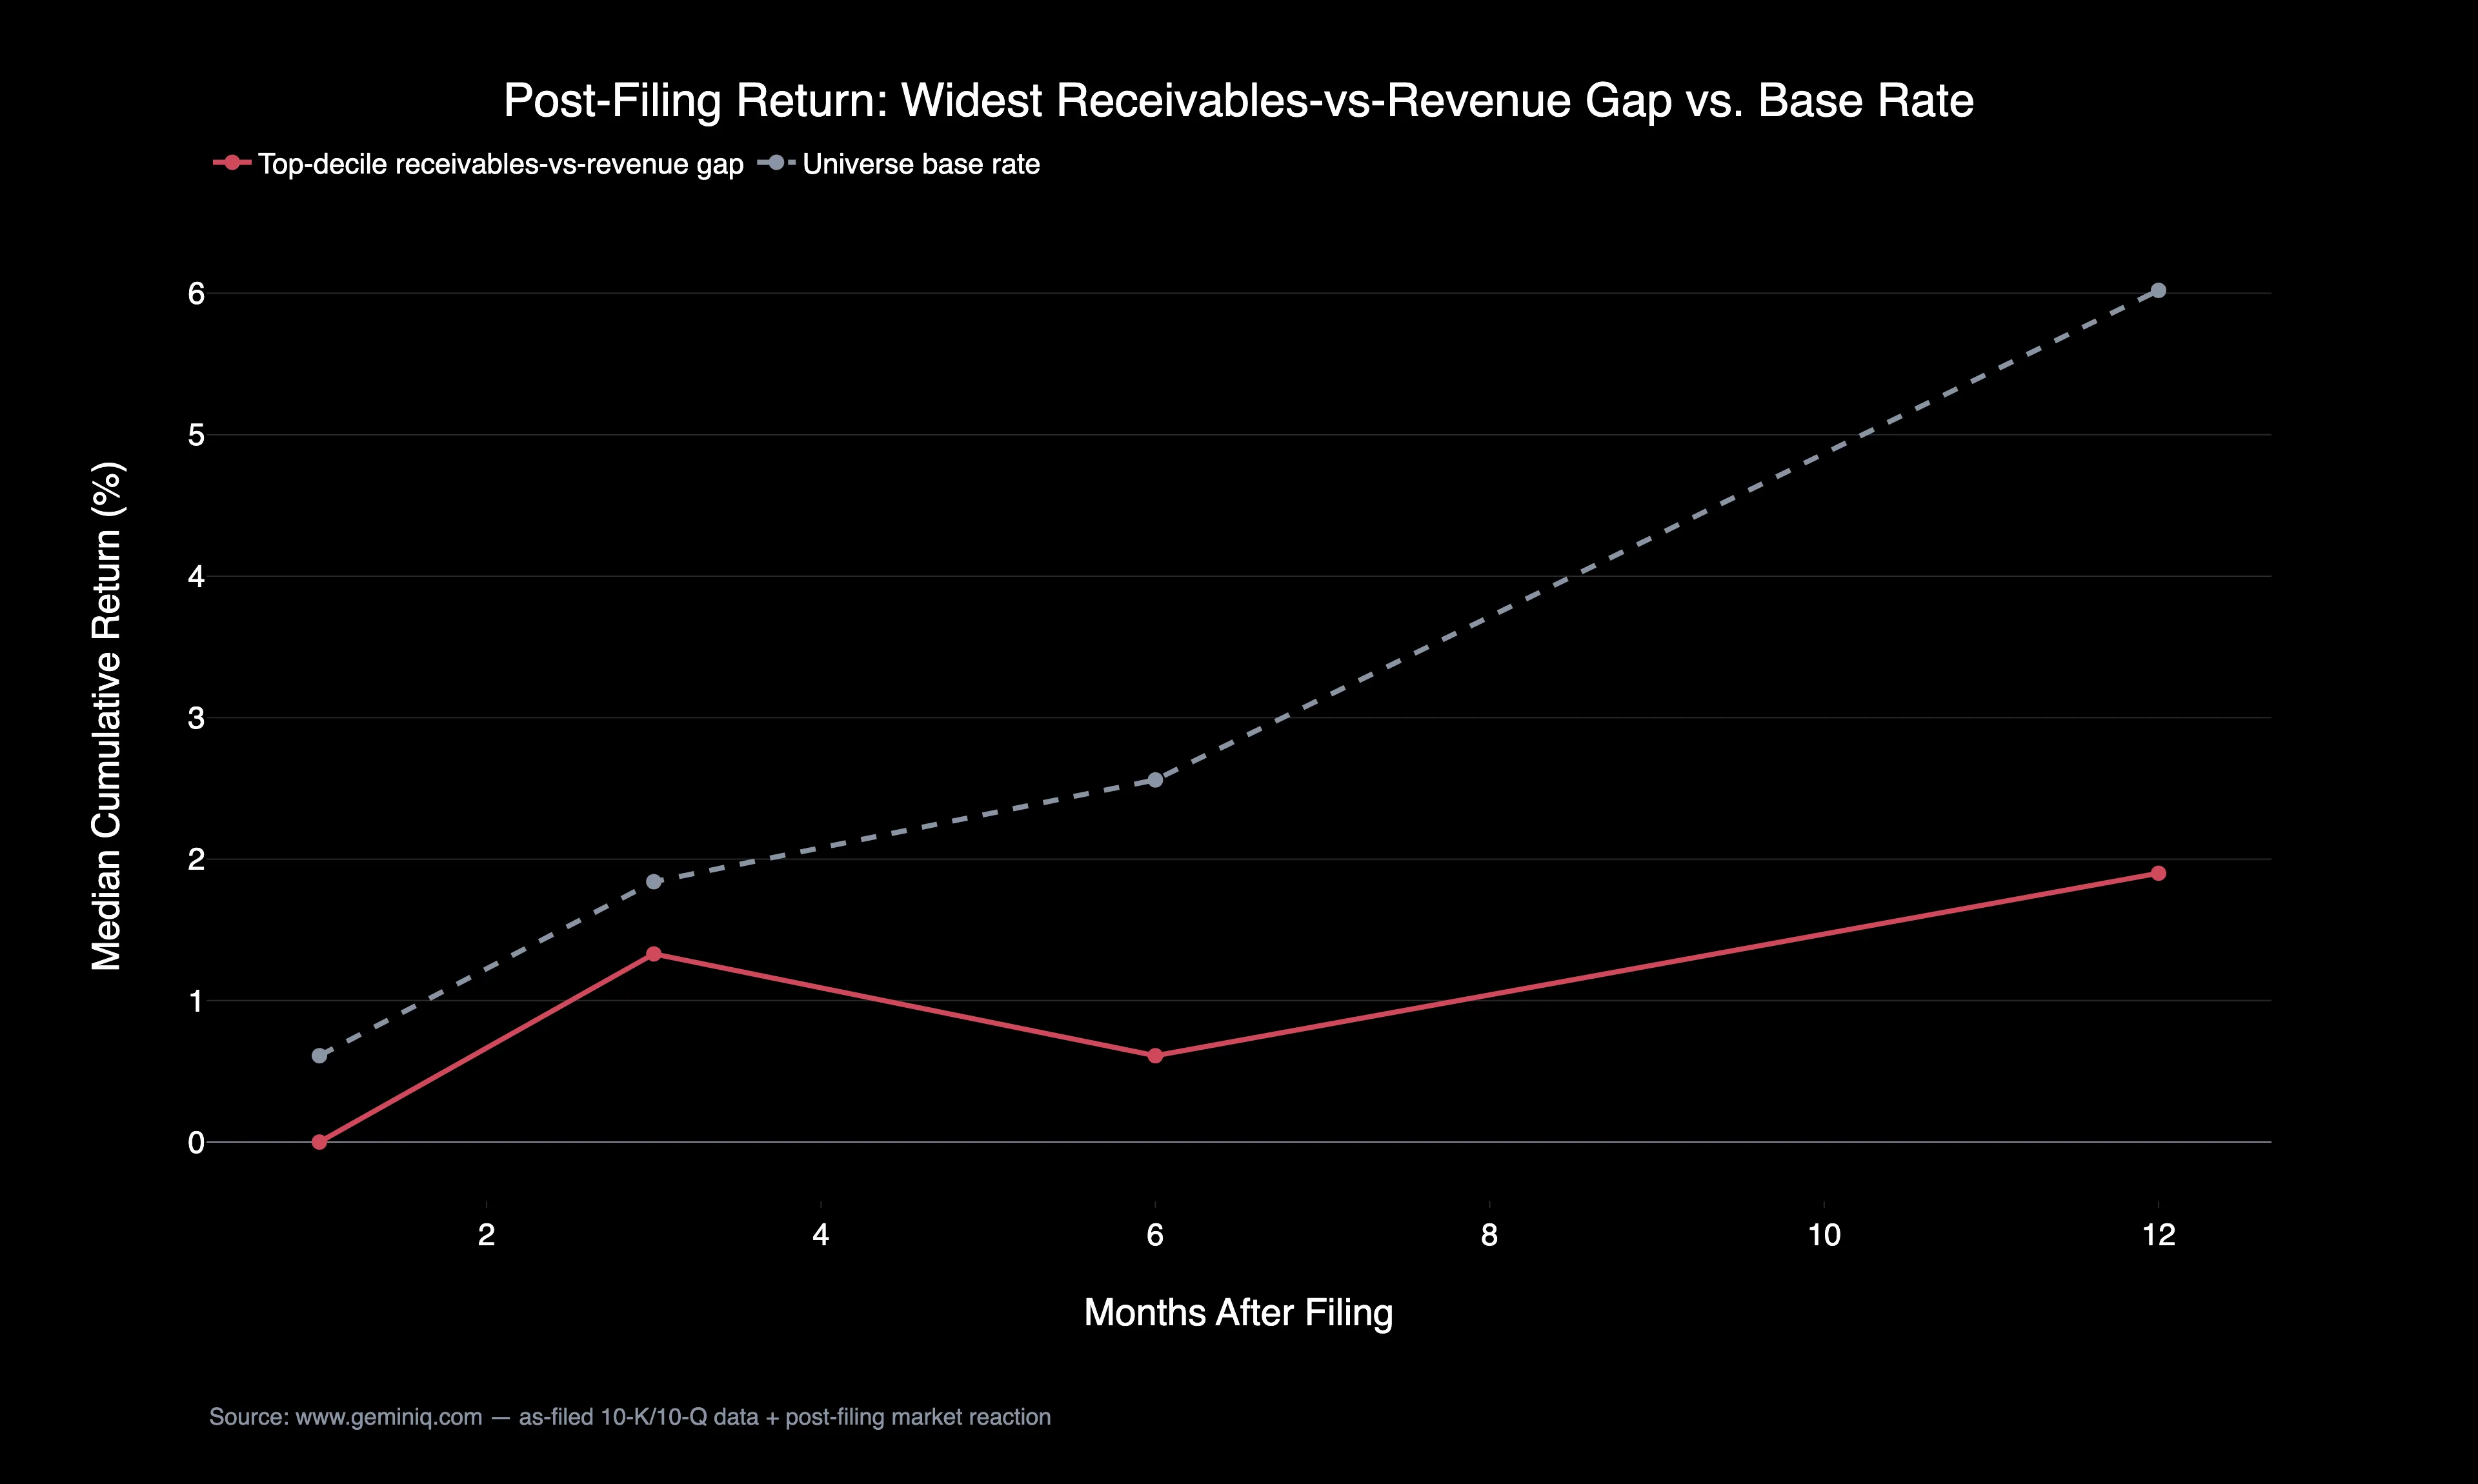
The gap is modest at the one- and three-month checkpoints and widens by twelve months, where the top-decile cohort trails the broader universe by roughly 4 percentage points. It is a real but not a dramatic effect, and it is sensitive to how the universe is defined. Restricting the comparison to companies with at least $100 Million in trailing revenue — filtering out the smallest, most illiquid names — narrows the gap at every checkpoint. At the three-month mark specifically, it even reverses, with the top-decile cohort modestly outperforming the base rate. The twelve-month gap holds up under that stricter filter, narrowing to roughly 2.25 percentage points rather than disappearing, but the effect is not as clean or as universal as the headline full-universe numbers alone would suggest.
The Extremes
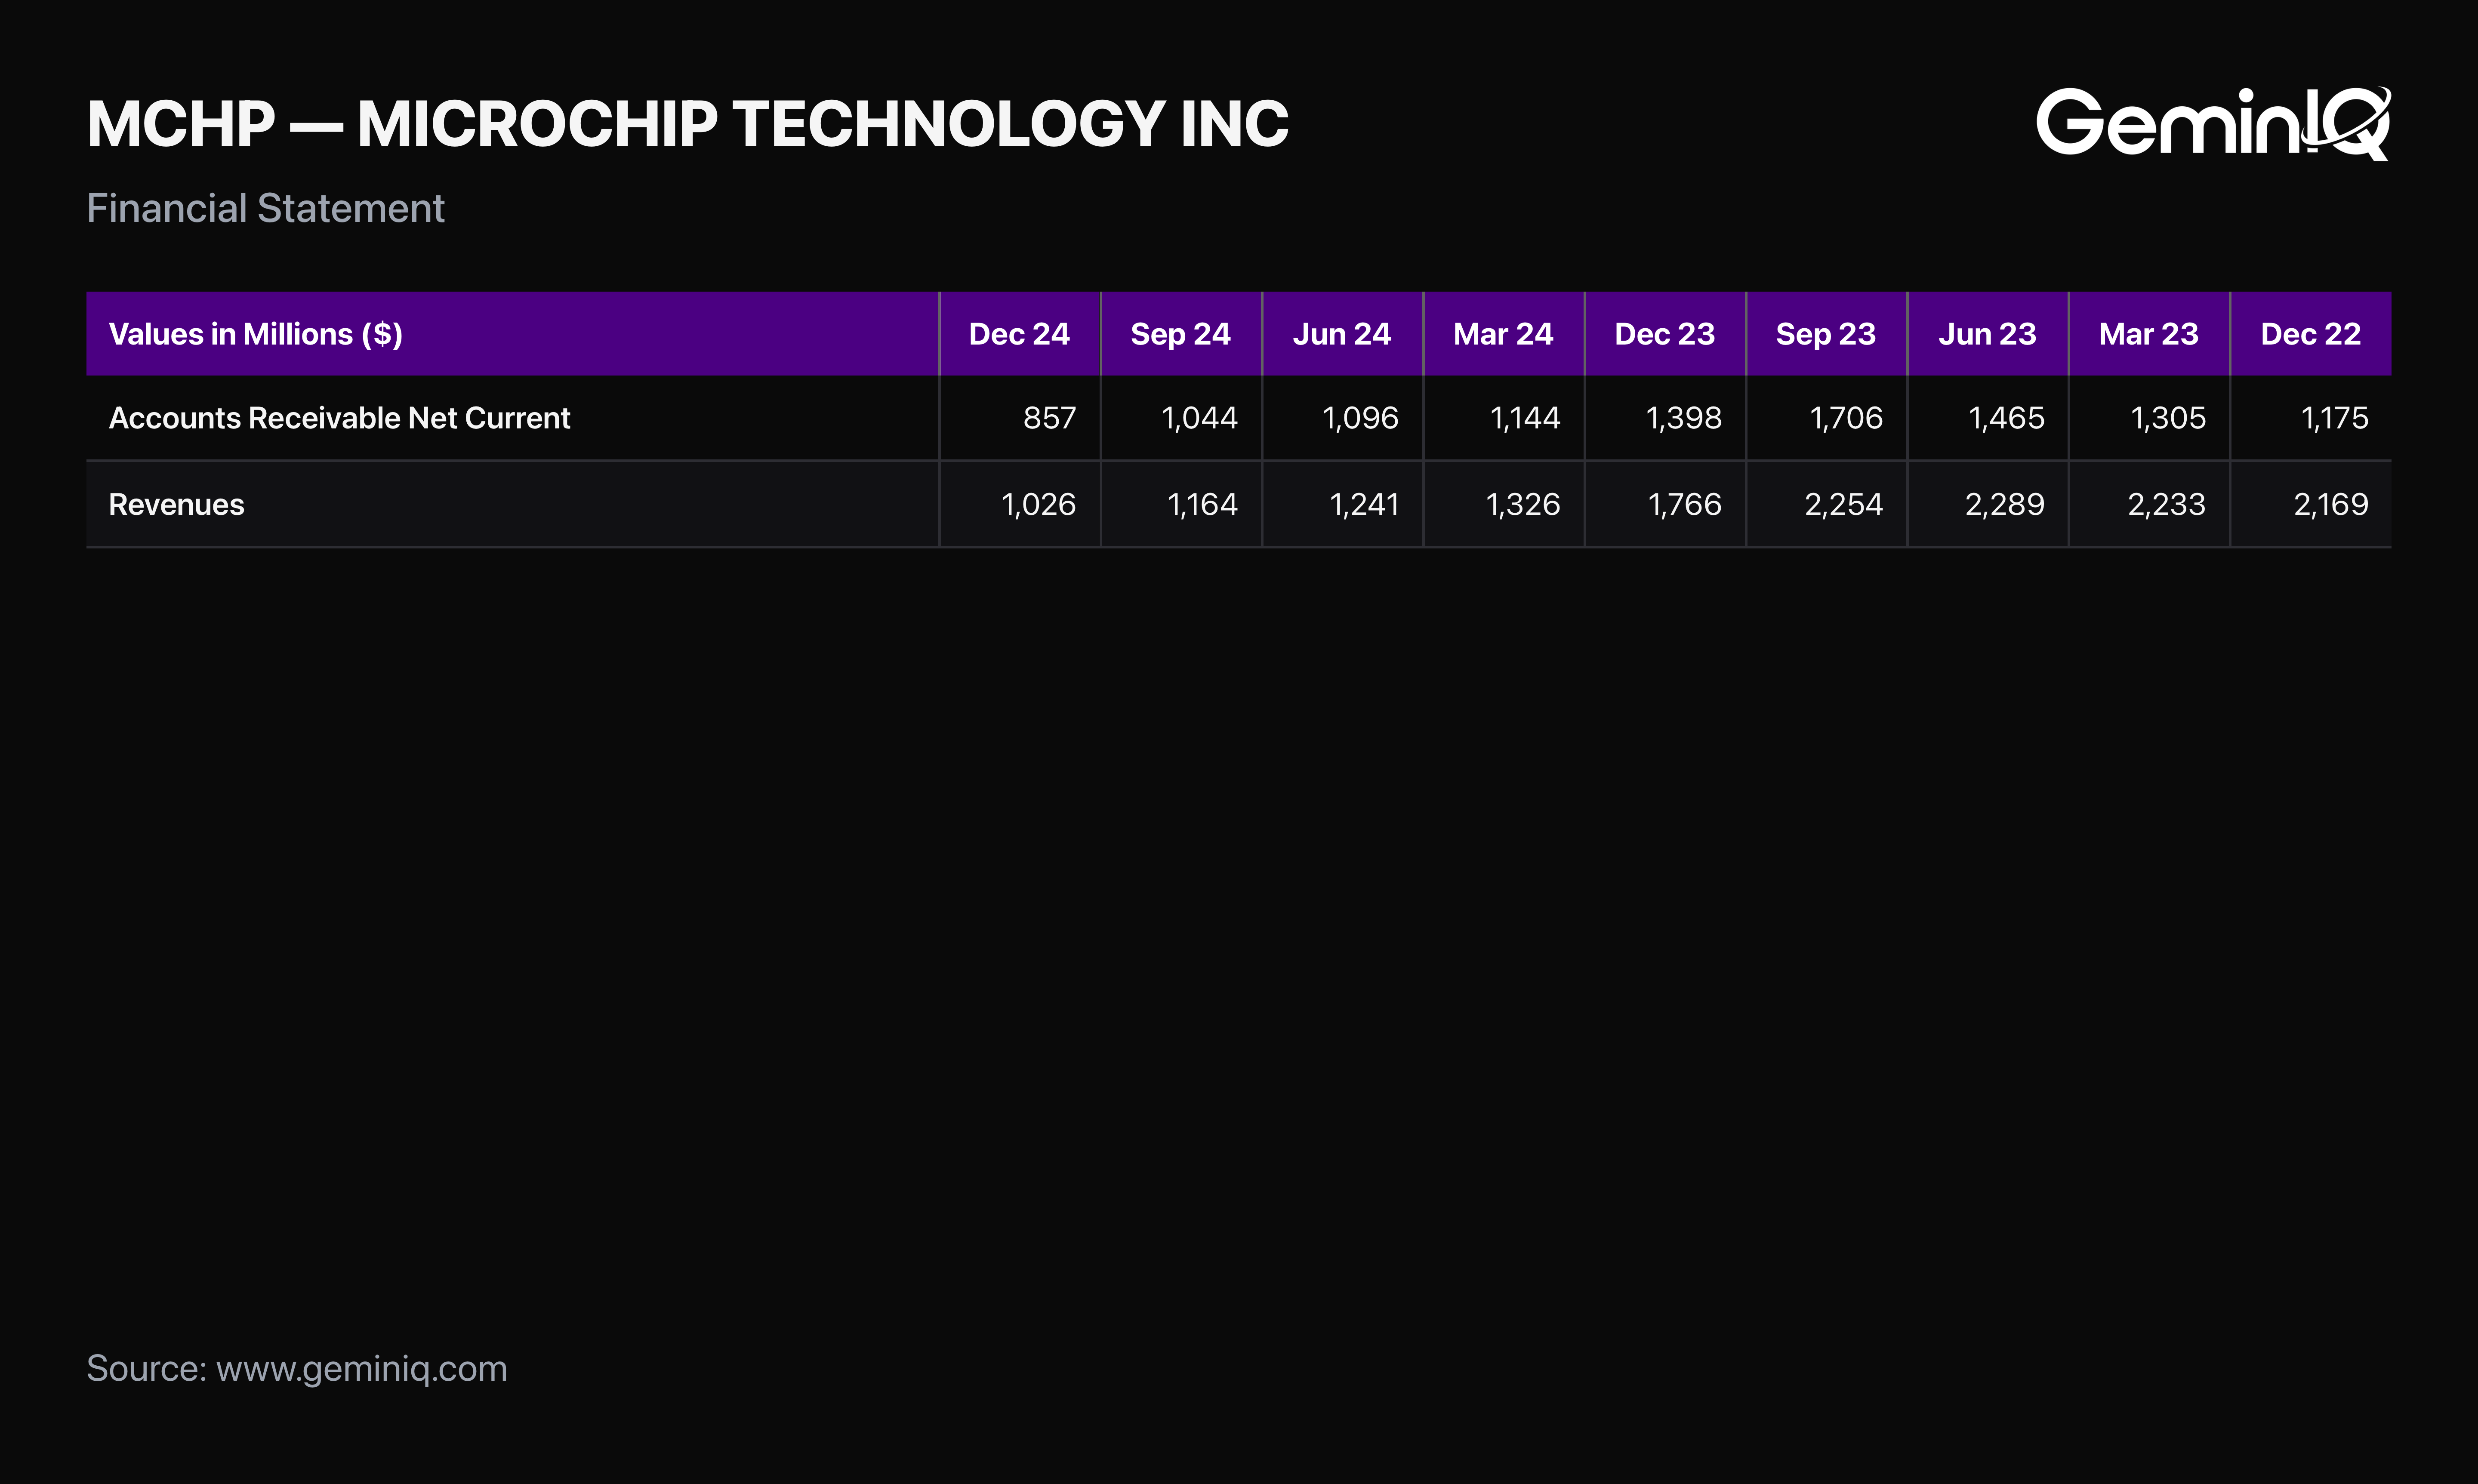
SolarEdge Technologies, cited in the opening, sits in a well-documented moment for the solar-inverter industry: fiscal 2023 receivables growing 21.2% against revenue that actually declined 4.3%. Distributors worked through a channel inventory glut that became a widely covered story across the sector in the following year. Microchip Technology shows a similar shape in the semiconductor downturn that followed: receivables grew 20.1% in the 10-K covering the fiscal year ended March 2024 while revenue fell 9.5%, a 29.6-point gap. The following twelve months produced a -59.92% return. Both cases sit inside industries that experienced genuine, publicly reported demand slowdowns in the same window — the receivables-versus-revenue gap was visible in the filing arithmetic before either became a widely covered story, not a standalone prediction of what followed.
The Method
Receivables Growth (1Y) compares each filing's trailing-twelve-month receivables figure — a rolling four-quarter sum built from each filer's raw receivables balance-sheet tag — to the trailing-twelve-month figure from four quarters earlier, the same TTM convention GeminIQ uses for its pre-calculated Deferred Revenue Growth metric. Revenue growth is GeminIQ's pre-calculated Revenue Growth (1-Year). Post-filing returns are cumulative from each filing's own filed date and are never compounded or added across checkpoints. Full methodology is covered in How GeminIQ Builds Filing Data Studies; this specific check is also one of seven covered in GeminIQ's balance sheet red flags checklist.
Check Your Holdings
Pull up any position's receivables trend on GeminIQ's Financial Statements view, sum the trailing four quarters, and compare that total to the same trailing-four-quarter total from a year earlier, then check that growth rate against the position's Revenue Growth (1-Year) in Calculated Metrics. A wide, growing gap isn't a guaranteed warning sign on its own — the base rate above shows the effect is real but modest, and sensitive to company size. But it's a two-line comparison anyone can run directly against the filing, rather than waiting for the headline.
Frequently Asked Questions
What does it mean when receivables grow faster than revenue?
It means the company is collecting cash more slowly relative to what it reports selling. Common causes include loosened credit terms used to pull sales forward, revenue recognized before cash is actually collected, or a concentrated customer paying later than usual. It's visible directly by comparing the trailing-twelve-month receivables figure to reported revenue growth over the same period.
How many filings does this finding cover?
146,882 filing-periods across 5,679 companies have both a receivables-growth and revenue-growth figure computed. 98,668 of those also have post-filing return data, with the top-decile cohort ranging from 9,723 filings at the one-month checkpoint down to 1,012 at twelve months, since only annual filings carry the full twelve-month return window.
Does a wide receivables-revenue gap always mean trouble ahead?
No. The effect narrows and becomes inconsistent once the comparison is restricted to larger, more liquid companies, and it reverses briefly at the three-month checkpoint under that stricter universe. It is a real but modest historical association at the full-universe level, not a reliable standalone signal for any individual company.
What's the sample size for the strongest gap cohort?
The top-decile cohort — filings where receivables outpaced revenue by the widest margin — ranges from 9,723 filings at the one-month checkpoint to 1,012 filings at the twelve-month checkpoint. Both figures sit comfortably above the roughly 200-filing floor this kind of comparison requires at every checkpoint measured.
Wall Street's data. Main Street's price.
Institutional terminals charge thousands a year for as-filed accuracy. GeminIQ gives you the same thing for a fraction of the cost: financials built directly from raw SEC EDGAR filings, not third-party APIs, with full XBRL traceability back to the original 10-K or 10-Q. No normalized guesswork, just calculated metrics, charts, screeners, and watchlists built on numbers exactly as the company reported them. Start researching now at GeminIQ.com.
Data Appendix: Universe of 5,679 companies drawn from GeminIQ's as-filed 10-K and 10-Q database, publicly available on SEC EDGAR. 146,882 filing-periods were screened for the spread between year-over-year growth in each filer's trailing-twelve-month receivables figure and GeminIQ's pre-calculated Revenue Growth (1-Year); 98,668 filings had matching post-filing return data, drawn from GeminIQ's partial price-history coverage. Accounts Receivable Growth (1Y) is derived from each filer's raw receivables balance-sheet tag, aggregated to a trailing-twelve-month basis, and is not itself a GeminIQ platform metric. The screen requires a prior-year receivables balance above $1 Million and a prior-year revenue balance above $10 Million, and winsorizes the top and bottom 1% of both the growth spread and the return figures to exclude divide-by-near-zero and extreme-outlier artifacts. Methodology: How GeminIQ Builds Filing Data Studies.
Disclaimer: The content in this blog is for educational and entertainment purposes only and does not constitute financial, legal, or tax advice. Investing involves risk, including the loss of principal. The views expressed are my own and not intended as financial advice or a guarantee of future performance.