Sono-Tek (SOTK) Q2 FY2027 Earnings: Revenue Up 1%, Opex Up 10%

By Chad Hartman
Published · Last updated
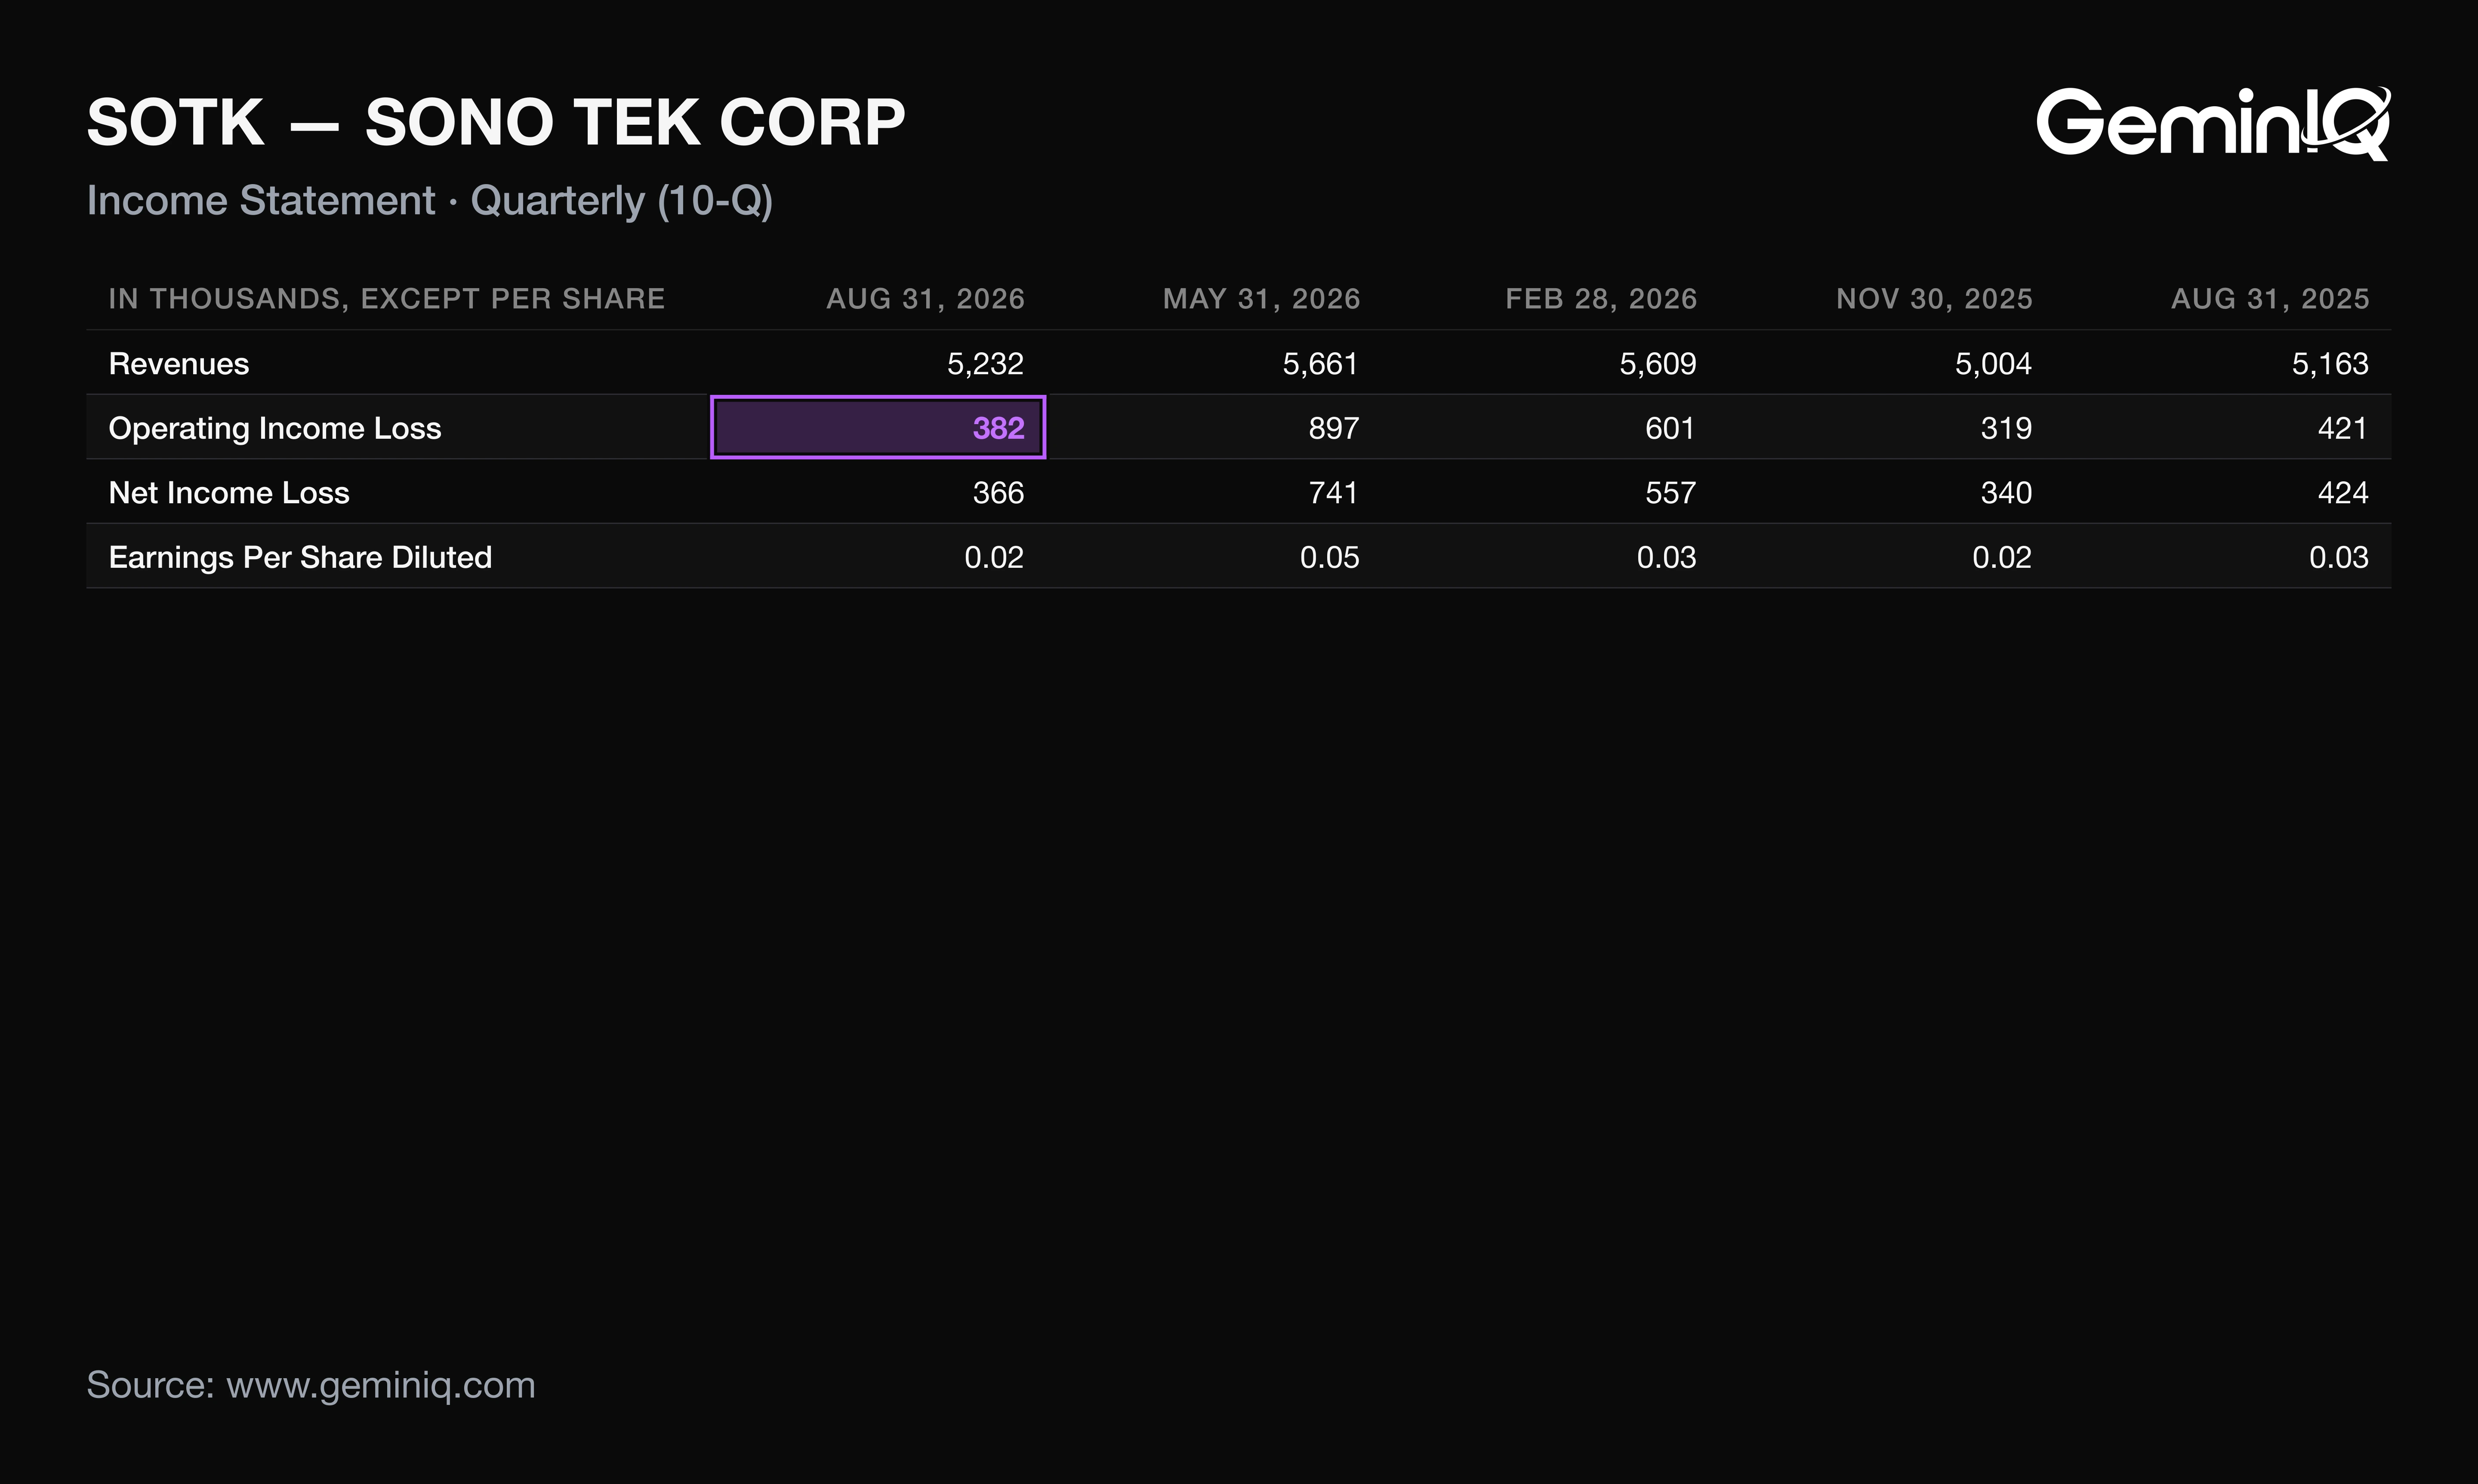
Sono-Tek (SOTK) reported Q2 FY2027 revenue of $5.23 million, up 1.3% year over year, and diluted EPS of $0.02 against $0.03, for the quarter ended August 31, 2026; the earnings release and the 10-Q both came on October 14, 2026. Gross profit rose 6.8%, yet operating income fell 9.4% to $382,000 because operating expenses grew 10.0%. The release led with six-month results, and the 10-Q shows that most of the quarter's gross-margin gain came from the installation line, with cash flow carried by one-time receivable collections.
| Field | Value |
|---|---|
| Company | Sono-Tek ($SOTK) |
| Quarter | Q2 FY2027, period ended August 31, 2026 |
| Earnings release | October 14, 2026 (Form 8-K) |
| 10-Q filed | October 14, 2026 |
| Revenue | $5.23 Million (+1.3% YoY) |
| Diluted EPS | $0.02 (vs. $0.03 a year earlier) |
| Operating margin | 7.3% (-0.9 pts YoY) |
| Operating cash flow (TTM) | $7.45 Million |
| Operating expenses (YoY) | +10.0% ($2.39 Million) |
Sono-Tek Q2 FY2027 Revenue, EPS and Operating Margin
Sono-Tek's Q2 FY2027 operating income was $382,000, down from $421,000 a year earlier, on revenue of $5.23 million. Gross margin rose 2.7 points to 52.9%. Operating income still fell, because operating expenses absorbed more than the gross profit added.
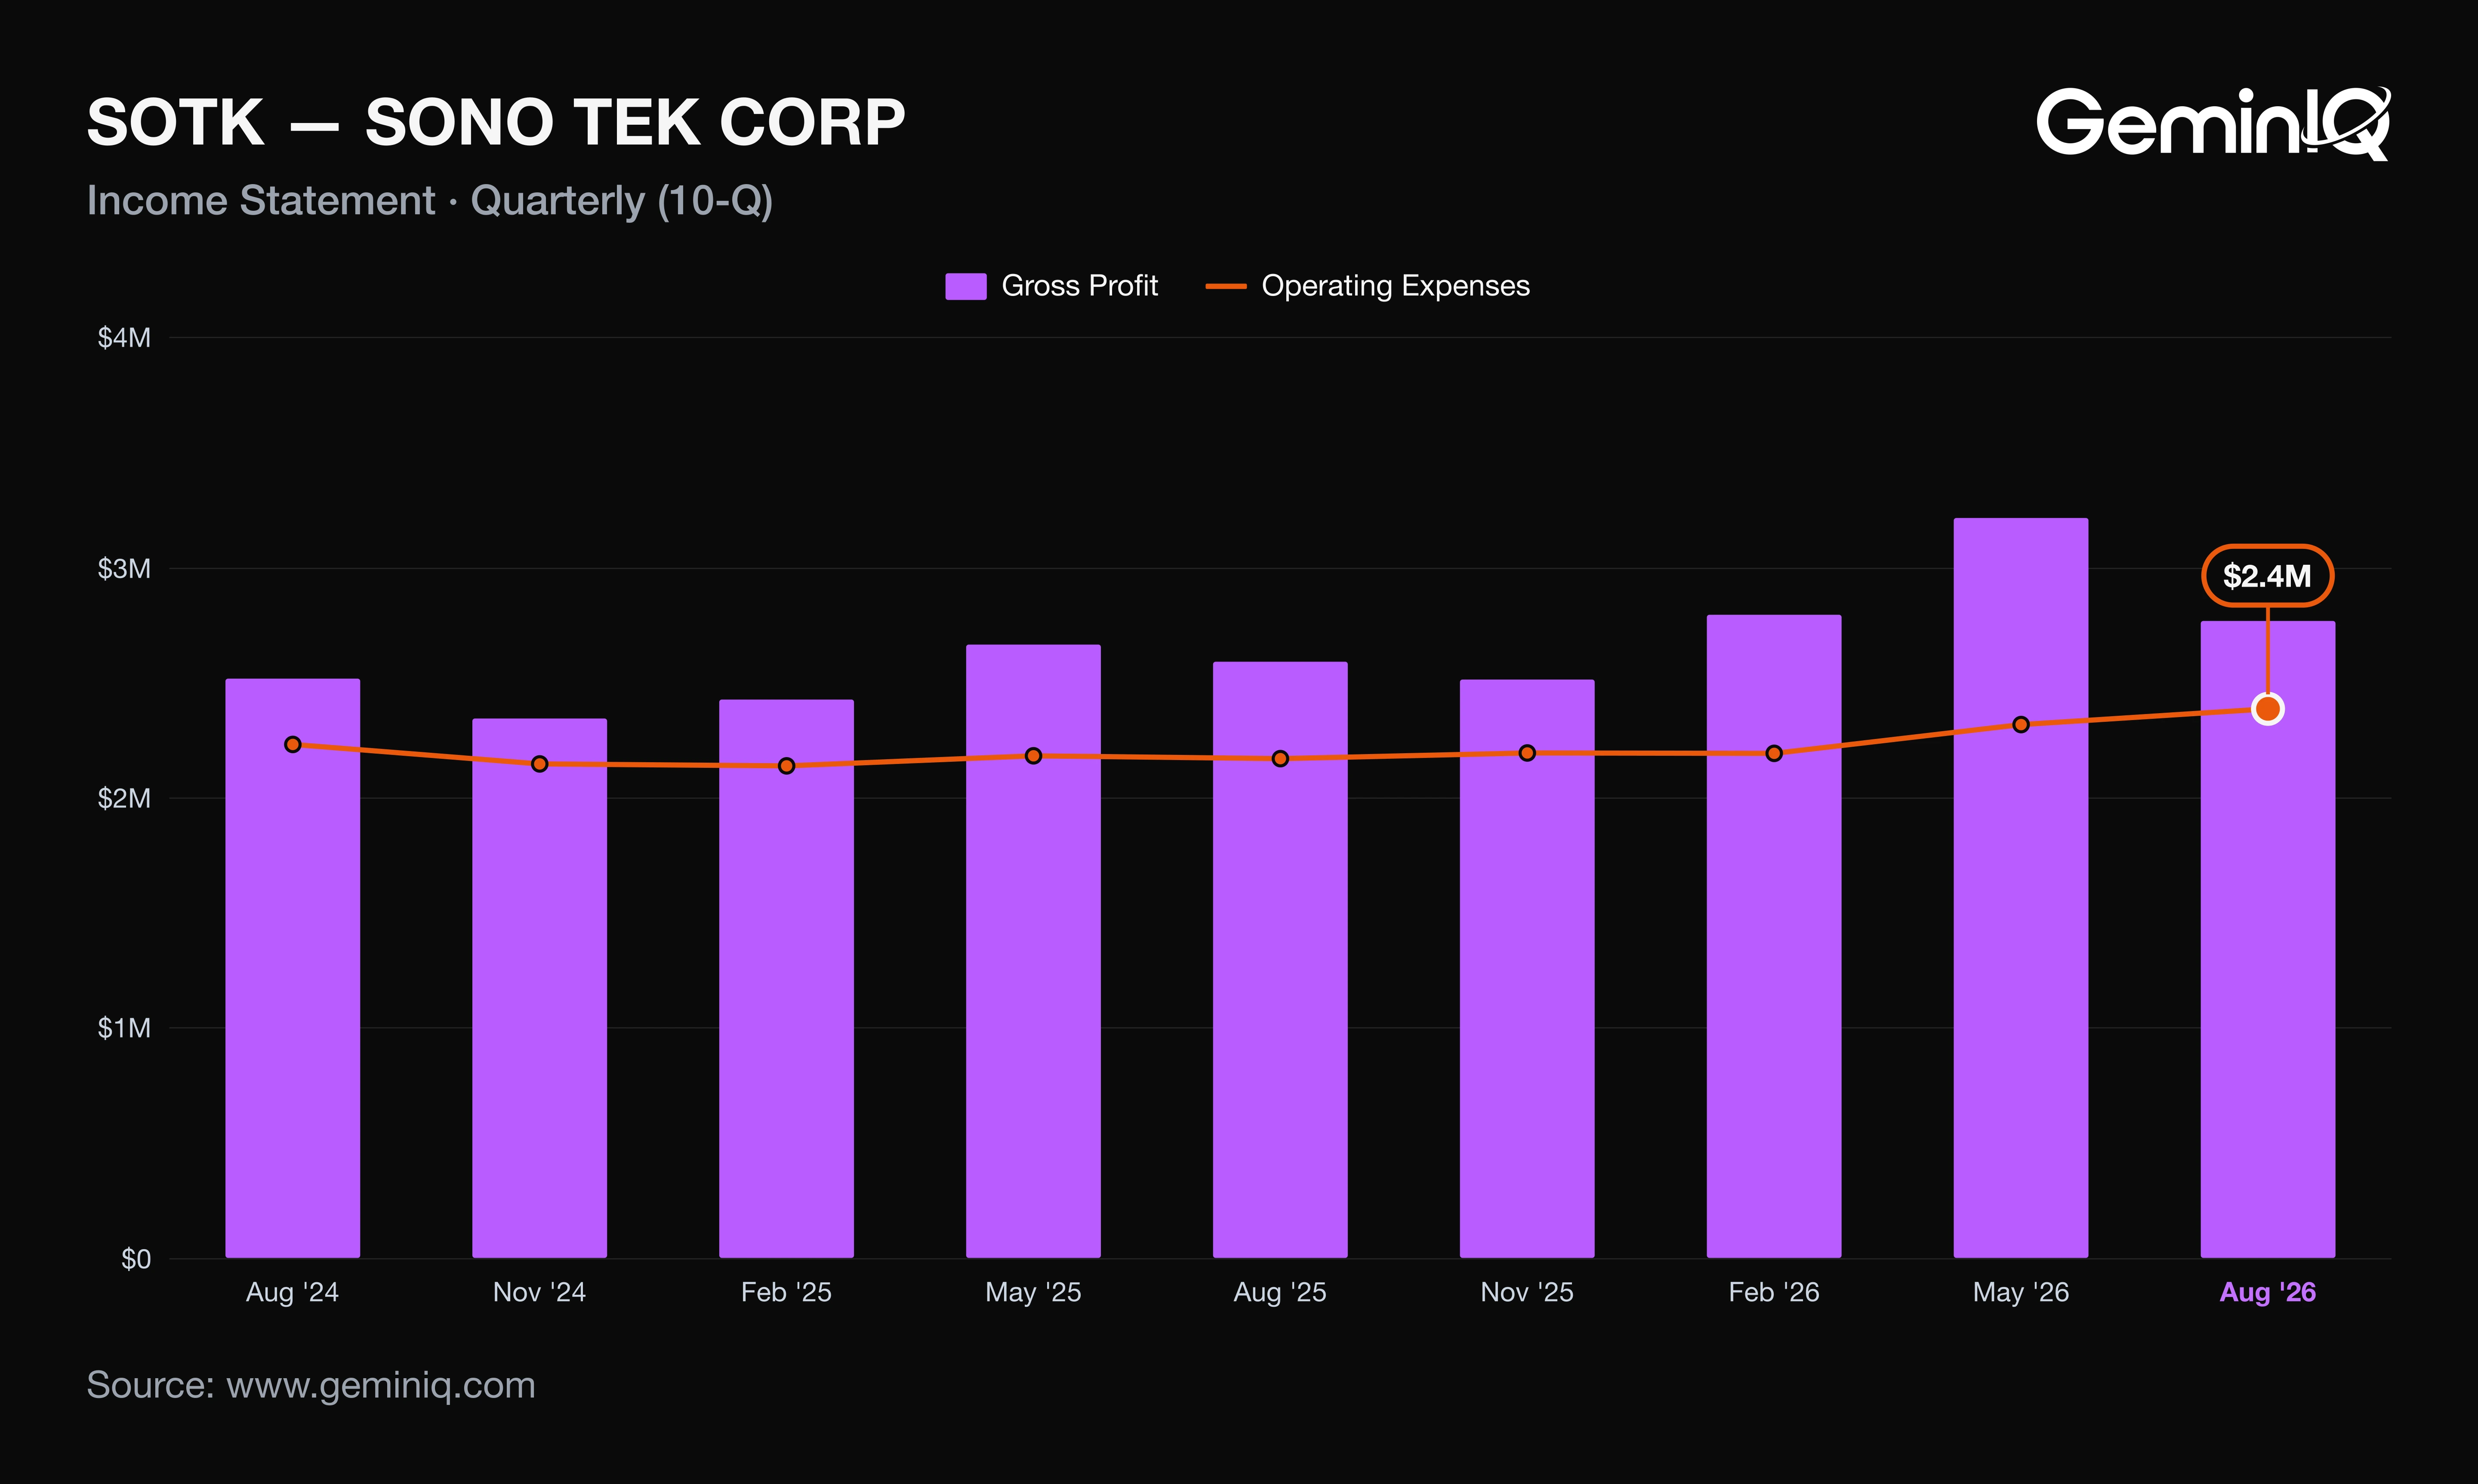
The Data: Gross profit rose $177,000 to $2.77 million, while operating expenses rose $217,000, or 10.0%, to $2.39 million. Operating margin was 7.3%, against 8.2% a year ago and 15.8% in Q1, and operating income fell from $897,000 in the prior quarter. Revenue grew 1.3%; the cost base below gross profit grew nearly eight times faster. Flat revenue also hid a swap: Medical sales rose $2.10 million to $3.11 million, 59% of the quarter, while Alternative/Clean Energy fell $1.90 million to $535,000.
Why: Marketing and selling rose $130,000, or 15%, which the 10-Q attributes to sales-lab and forward-deployed engineer salaries, trade shows and health insurance. Net income fell 13.5% to $366,000 and diluted shares rose 0.5%, so EPS fell about 14% before rounding; the 33% drop from $0.03 to $0.02 is rounding. The tax rate also rose to 26.5% from 19.5%. At last year's rate, net income would have been about $401,000, a 5% decline instead of 14%. The 10-Q expects marketing and selling costs to climb again in the second half.
What Sono-Tek's Q2 FY2027 10-Q Shows Beyond the Press Release
Sono-Tek's 10-Q filed October 14, 2026 shows a Q2 gross margin of 52.9%, the second highest of the last 16 quarters, and its segment note places the source of the gain in installation costs. The release attributes the expansion to an "unusually favorable" product and geographic mix, and led with first-half operating income up 41% to $1.28 million. The quarter alone was down 9%.
The Data: Cost of goods sold fell $108,000 to $2.47 million. Direct costs (materials, labor, depreciation) were $2.20 million against $2.21 million, essentially flat. The service department fell $99,000 to $264,000, and its outside-installations line swung from a $148,000 expense to a $9,000 credit.
Why: Service costs dropped to 5.0% of sales from 7.0%, worth about 2.0 of the 2.7 points of gross-margin gain; direct costs supplied roughly 0.7. Mix still counts: U.S. and Canada were 70% of sales against 53%, and the 10-Q says direct U.S. sales carry no distributor discounts. The 10-Q also states that first-half margins "should not necessarily be viewed as indicative" of future periods. A line that swung $157,000 in a year can swing back, and a gross margin built on it is less repeatable than one built on materials cost.
Sono-Tek Q2 FY2027 Cash Flow, Receivables and Balance Sheet
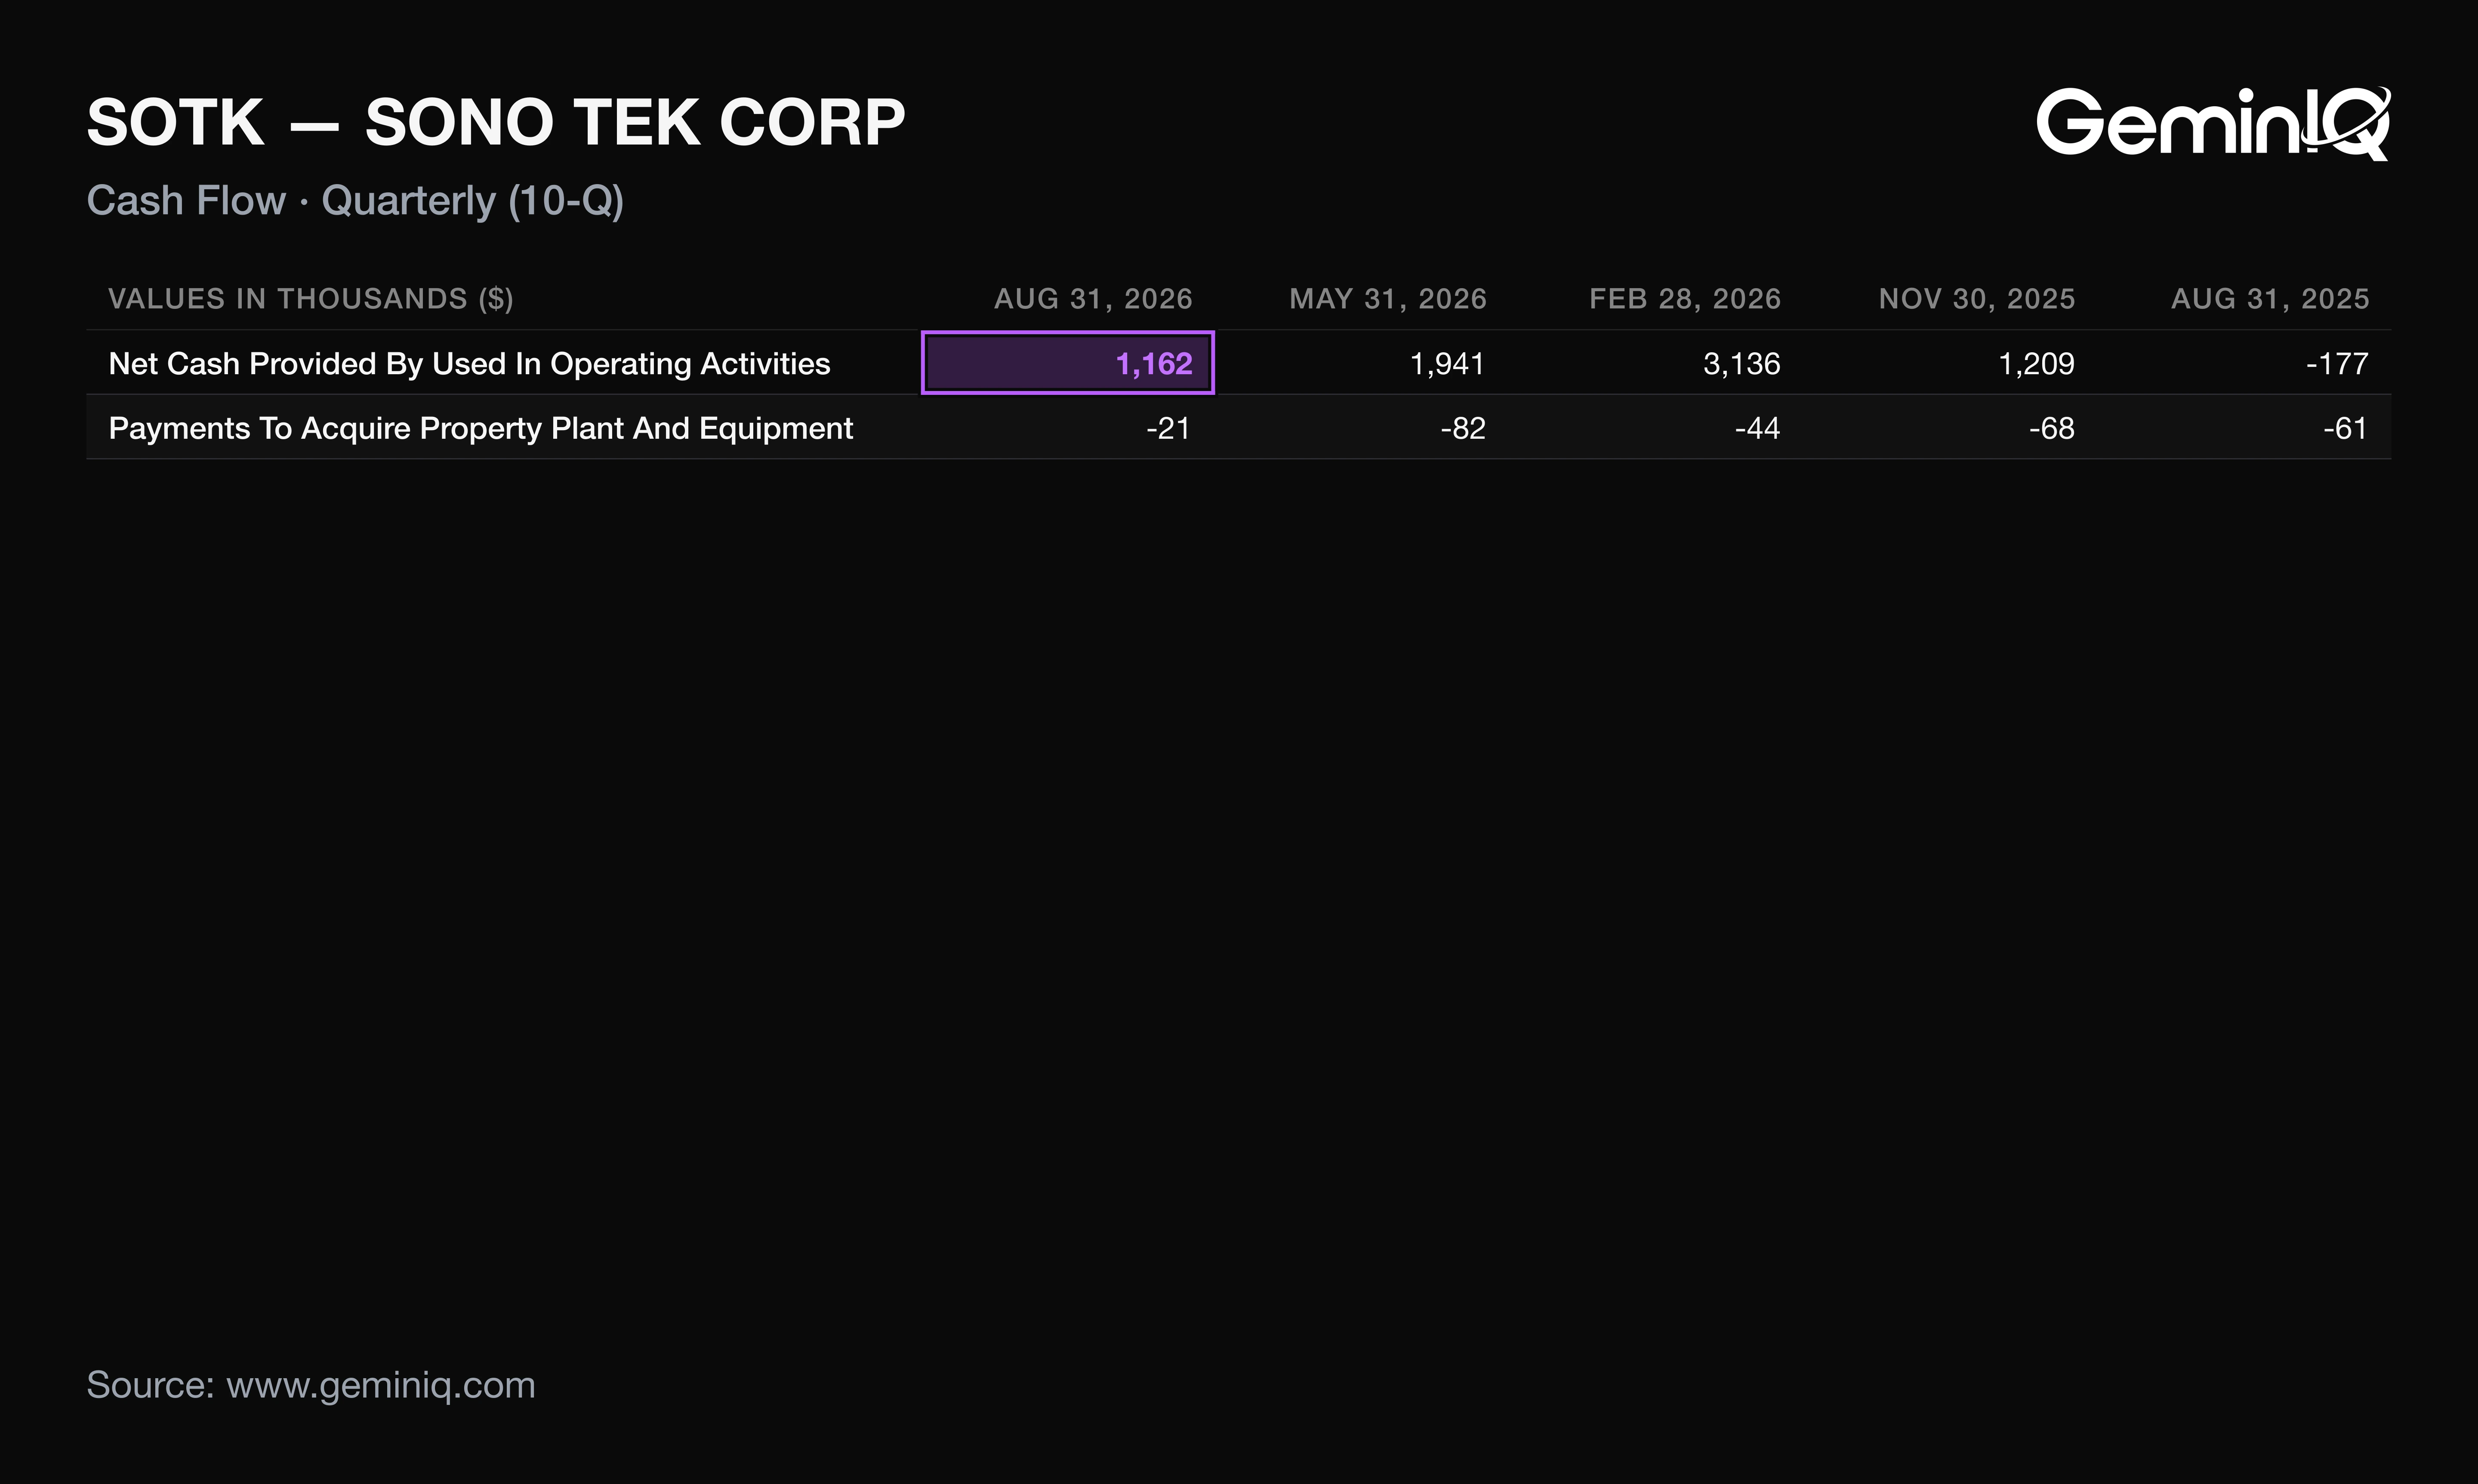
Sono-Tek generated roughly $1.2 million of operating cash flow in Q2 FY2027 against $177,000 used a year earlier, and $7.45 million over the trailing twelve months. Cash outran earnings because receivables were collected, not because profit grew.
The Data: First-half operating cash flow was $3.10 million on net income of $1.11 million, 2.8 times earnings. Receivables fell $2.12 million to $1.23 million, including about $884,000 from one customer given extended terms in the first half of fiscal 2026, while customer deposits fell $745,000 to $2.32 million. Q2 capital expenditure was $21,000, the lowest of the last 16 quarters. GeminIQ's pre-calculated Free Cash Flow for the trailing twelve months was $7.2 million, against negative $875,000 a year earlier.
Why: Receivable collections supplied 68% of first-half operating cash flow, and a balance can be collected only once. The 10-Q itself says receivables may rise again, reducing cash. The balance sheet gives room: cash and securities were $17.7 million with no debt, GeminIQ's Net Debt to EBITDA was -3.66x and its Current Ratio 4.42x. Cash is cushion here, not evidence of rising earning power.
Sono-Tek's Fiscal 2027 Guidance After Q2
Sono-Tek's October 14, 2026 release reiterates guidance of flat to modest fiscal 2027 revenue growth, unchanged after a first half that grew 6% to $10.89 million.
The Data: The company reported backlog of $9.51 million, up 23% from $7.73 million at the end of Q1 but $1.70 million below a year earlier, per the 10-Q. Three orders totaling about $7.19 million, received after quarter end, are expected to ship in fiscal 2028. They equal 76% of quarter-end backlog and 1.4 quarters of revenue.
Why: Guidance that stays put after a 6% half implies slower growth in the second half unless "modest" is 6% or more. The new orders do not change fiscal 2027, and the 10-Q expects underlying Advanced Energy demand to stay low through fiscal 2027 and into fiscal 2028, with the large order from an existing customer. The guidance is the company's own claim, and the backlog gives it a floor but not a direction.
How SOTK Stock Has Moved After Past Earnings Reports
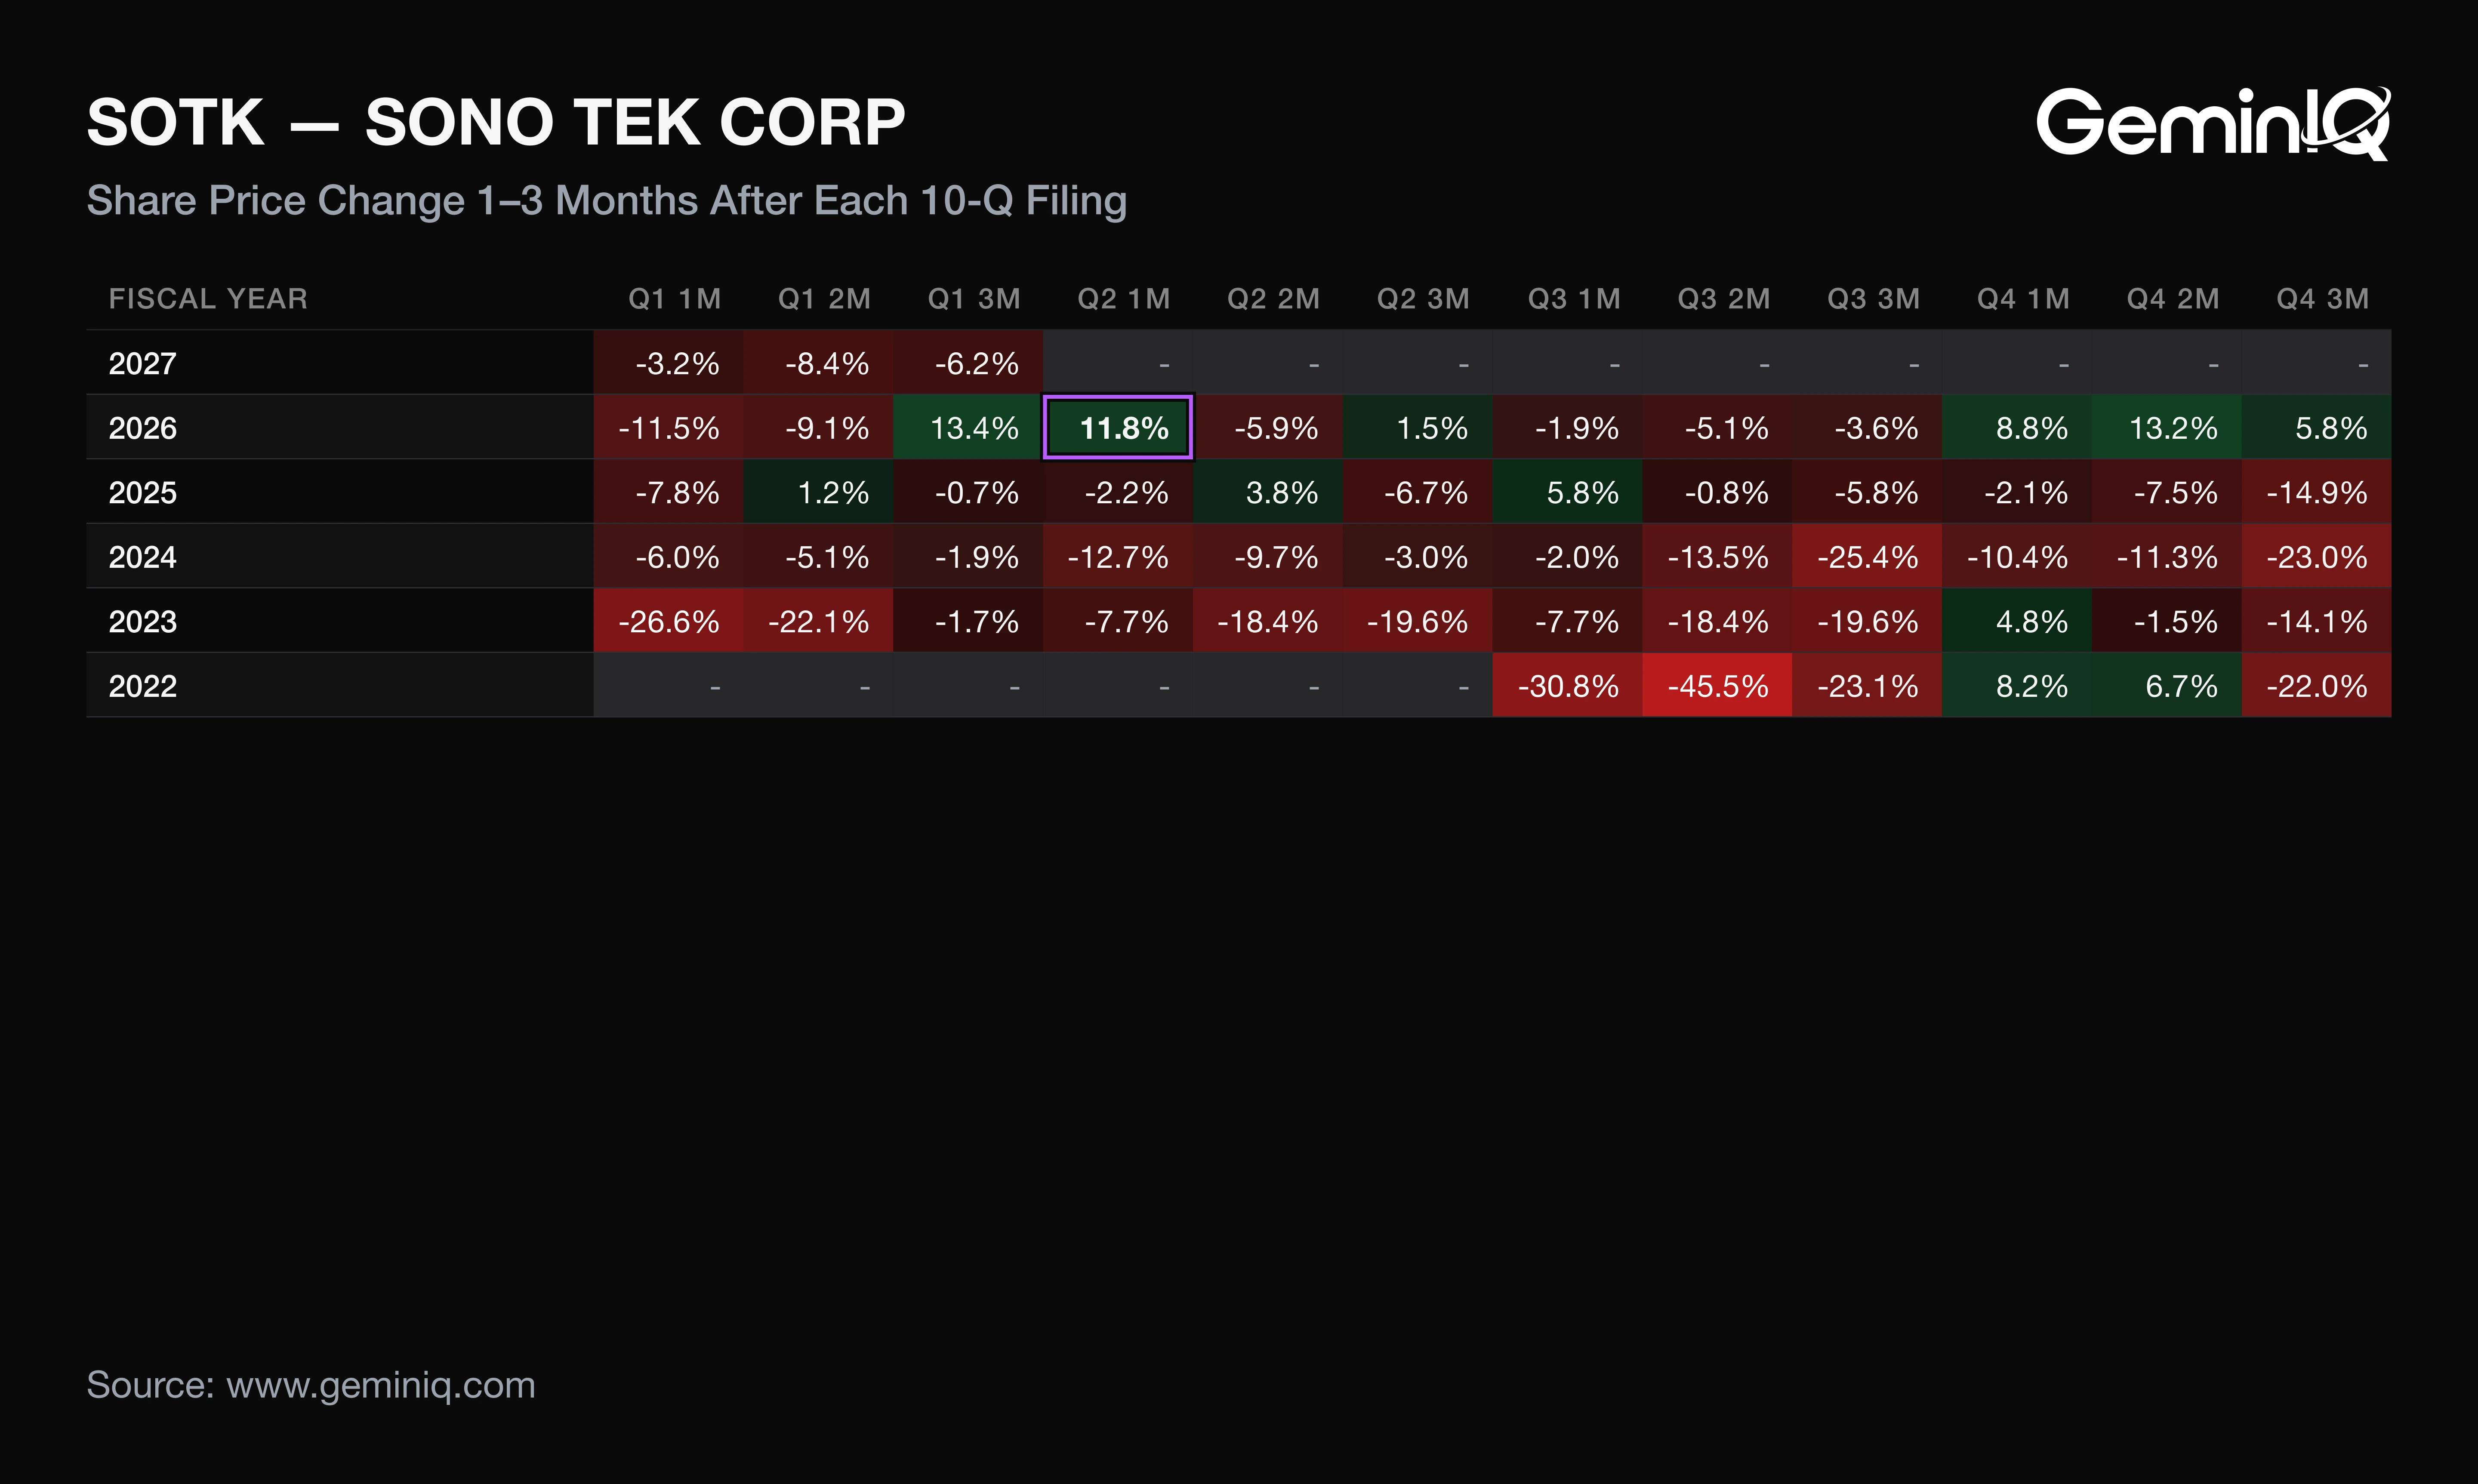
Across Sono-Tek's last 12 10-Q filings (October 2023 to July 2026), the median one-month return was -2.1% and the stock was higher after only 3 of 12. These figures describe how Sono-Tek's stock moved after its past filings; they are a historical association, not a forecast.
The Data: Three-month returns had a median of -4.7%, also positive 3 of 12 times, with a range from -25.4% to +13.4%. Past Q2 filings returned -12.7% (FY2024), -2.2% (FY2025) and +11.8% (FY2026) after one month. This filing's window has not yet elapsed.
Why: A median below zero with a spread that wide describes a stock whose post-filing moves have not followed headline growth in any fixed way. GeminIQ's Earnings Reaction Heat Map lays the 12 filings side by side.
Institutions held 7.89% of shares at the June 30, 2026 SEC Form 13F date, up 0.63 points in a year and the third highest of the last 16 quarters. In SEC Form 4 filings through July 30, 2026, insiders made 9 sales totaling $246,000 and one $10,000 purchase over 12 months, against 15 sales totaling $56,000 and no purchases the year before. Christopher Coccio accounted for $170,000, or 69%, of the sales.
For any small manufacturer that books lumpy system orders, the mix, installation and receivable lines say more about the next quarter than the headline growth rate does.
Frequently Asked Questions
Is Sono-Tek doing well financially?
Sono-Tek's trailing-twelve-month net profit margin was 9.32% at the end of Q2 FY2027, up from 7.33% a year earlier. GeminIQ's pre-calculated Net Profit Margin sits alongside a trailing operating margin of 10.23% and return on invested capital of 12.68%, against 8.41% a year ago. The company had no debt at August 31, 2026.
When does Sono-Tek report earnings?
Sono-Tek released its Q2 FY2027 results and filed its 10-Q on October 14, 2026. Last year it filed the next quarter, FY2026 Q3, on January 13, 2026. That is a pattern from the filing record, not a forecast of the date.
Does Sono-Tek pay a dividend?
Sono-Tek paid no dividends in Q2 FY2027 or over the trailing twelve months. It also repurchased no stock in the first half of fiscal 2027, after using $151,000 for treasury stock in the first half of fiscal 2026.
What was Sono-Tek's free cash flow in Q2 FY2027?
Sono-Tek's Q2 FY2027 free cash flow was about $1.1 million, operating cash flow less $21,000 of capital expenditure, the fourth highest of the last 16 quarters. The figures can be checked in the 10-Q and the 8-K earnings release.
Wall Street's data. Main Street's price.
Institutional terminals charge thousands a year for as-filed accuracy. GeminIQ gives you the same thing for a fraction of the cost: financials built directly from raw SEC EDGAR filings, not third-party APIs, with full XBRL traceability back to the original 10-K or 10-Q. No normalized guesswork, just calculated metrics, charts, screeners, and watchlists built on numbers exactly as the company reported them. Start researching now at GeminIQ.com.
All financial figures cited in this article reference SONO TEK CORP's Q2 FY2027 10-Q (filed October 14, 2026, period ending August 31, 2026), with guidance and management commentary drawn from the company's Form 8-K earnings release (filed October 14, 2026). All SEC filings are publicly available at SEC EDGAR and SEC EDGAR.
Disclaimer: The content in this blog is for educational and entertainment purposes only and does not constitute financial, legal, or tax advice. Investing involves risk, including the loss of principal. The views expressed are my own and not intended as financial advice or a guarantee of future performance.