
Stock Dropped After Earnings: What History Says Happens Next

By Chad Hartman
Published · Last updated
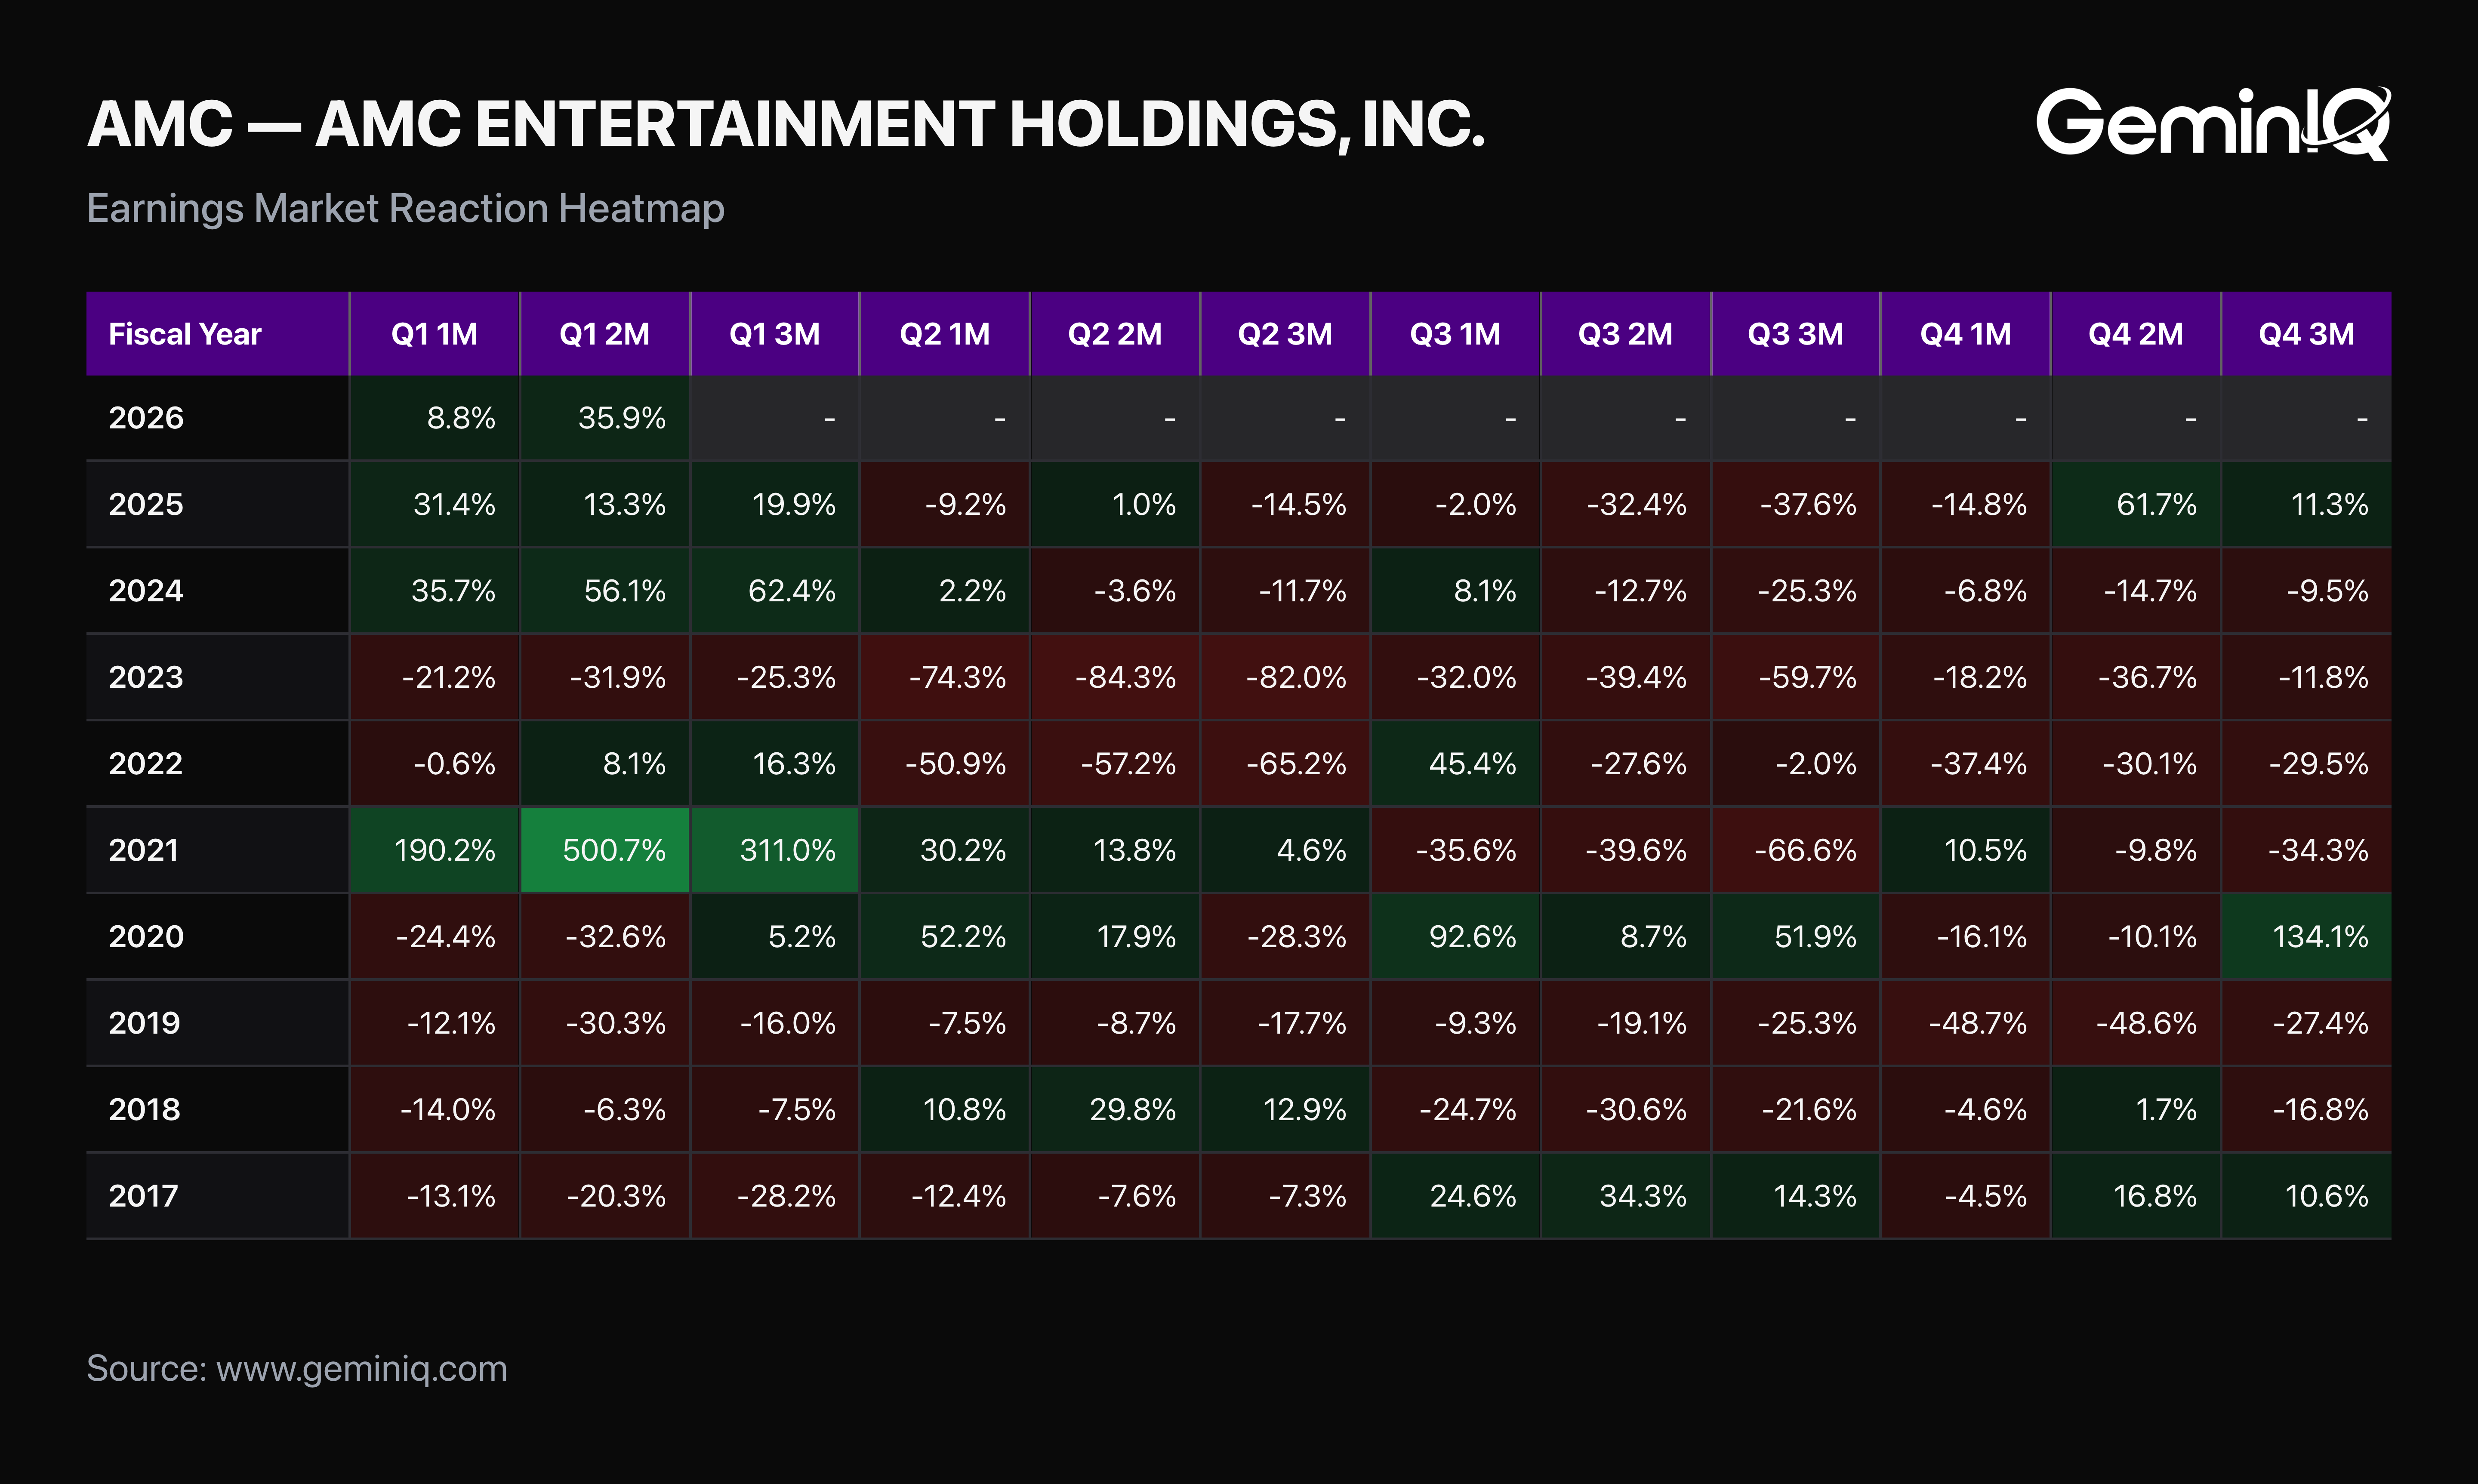
AMC Entertainment's stock fell 74.3% in the month after it filed its August 2023 10-Q — not a headline exaggeration, the actual cumulative move from the filing date, pulled straight from GeminIQ's Earnings Market Reaction Heat Map. Two months later it was down 84.3%. Three months out, still 82.0%. Anyone holding AMC Entertainment that week had one real question, and it had nothing to do with the balance sheet: does this come back, or does it keep going?
Every financial media outlet has an opinion on that question. None of them have run the numbers across enough filings to answer it. This study does.
This study reads every 10-Q and 10-K in GeminIQ's as-filed database from 2009 through mid-2026 — 264,286 filings across 5,637 companies — bucketed into quintiles by each stock's cumulative return in the month after filing, then tracked forward. A 10-Q carries three months of post-filing data; a 10-K carries the full twelve. Every result below is measured against the universe base rate, never against zero, and every bucket clears at least 8,487 filings — never a handful of quarters standing in for a pattern.
The Pattern
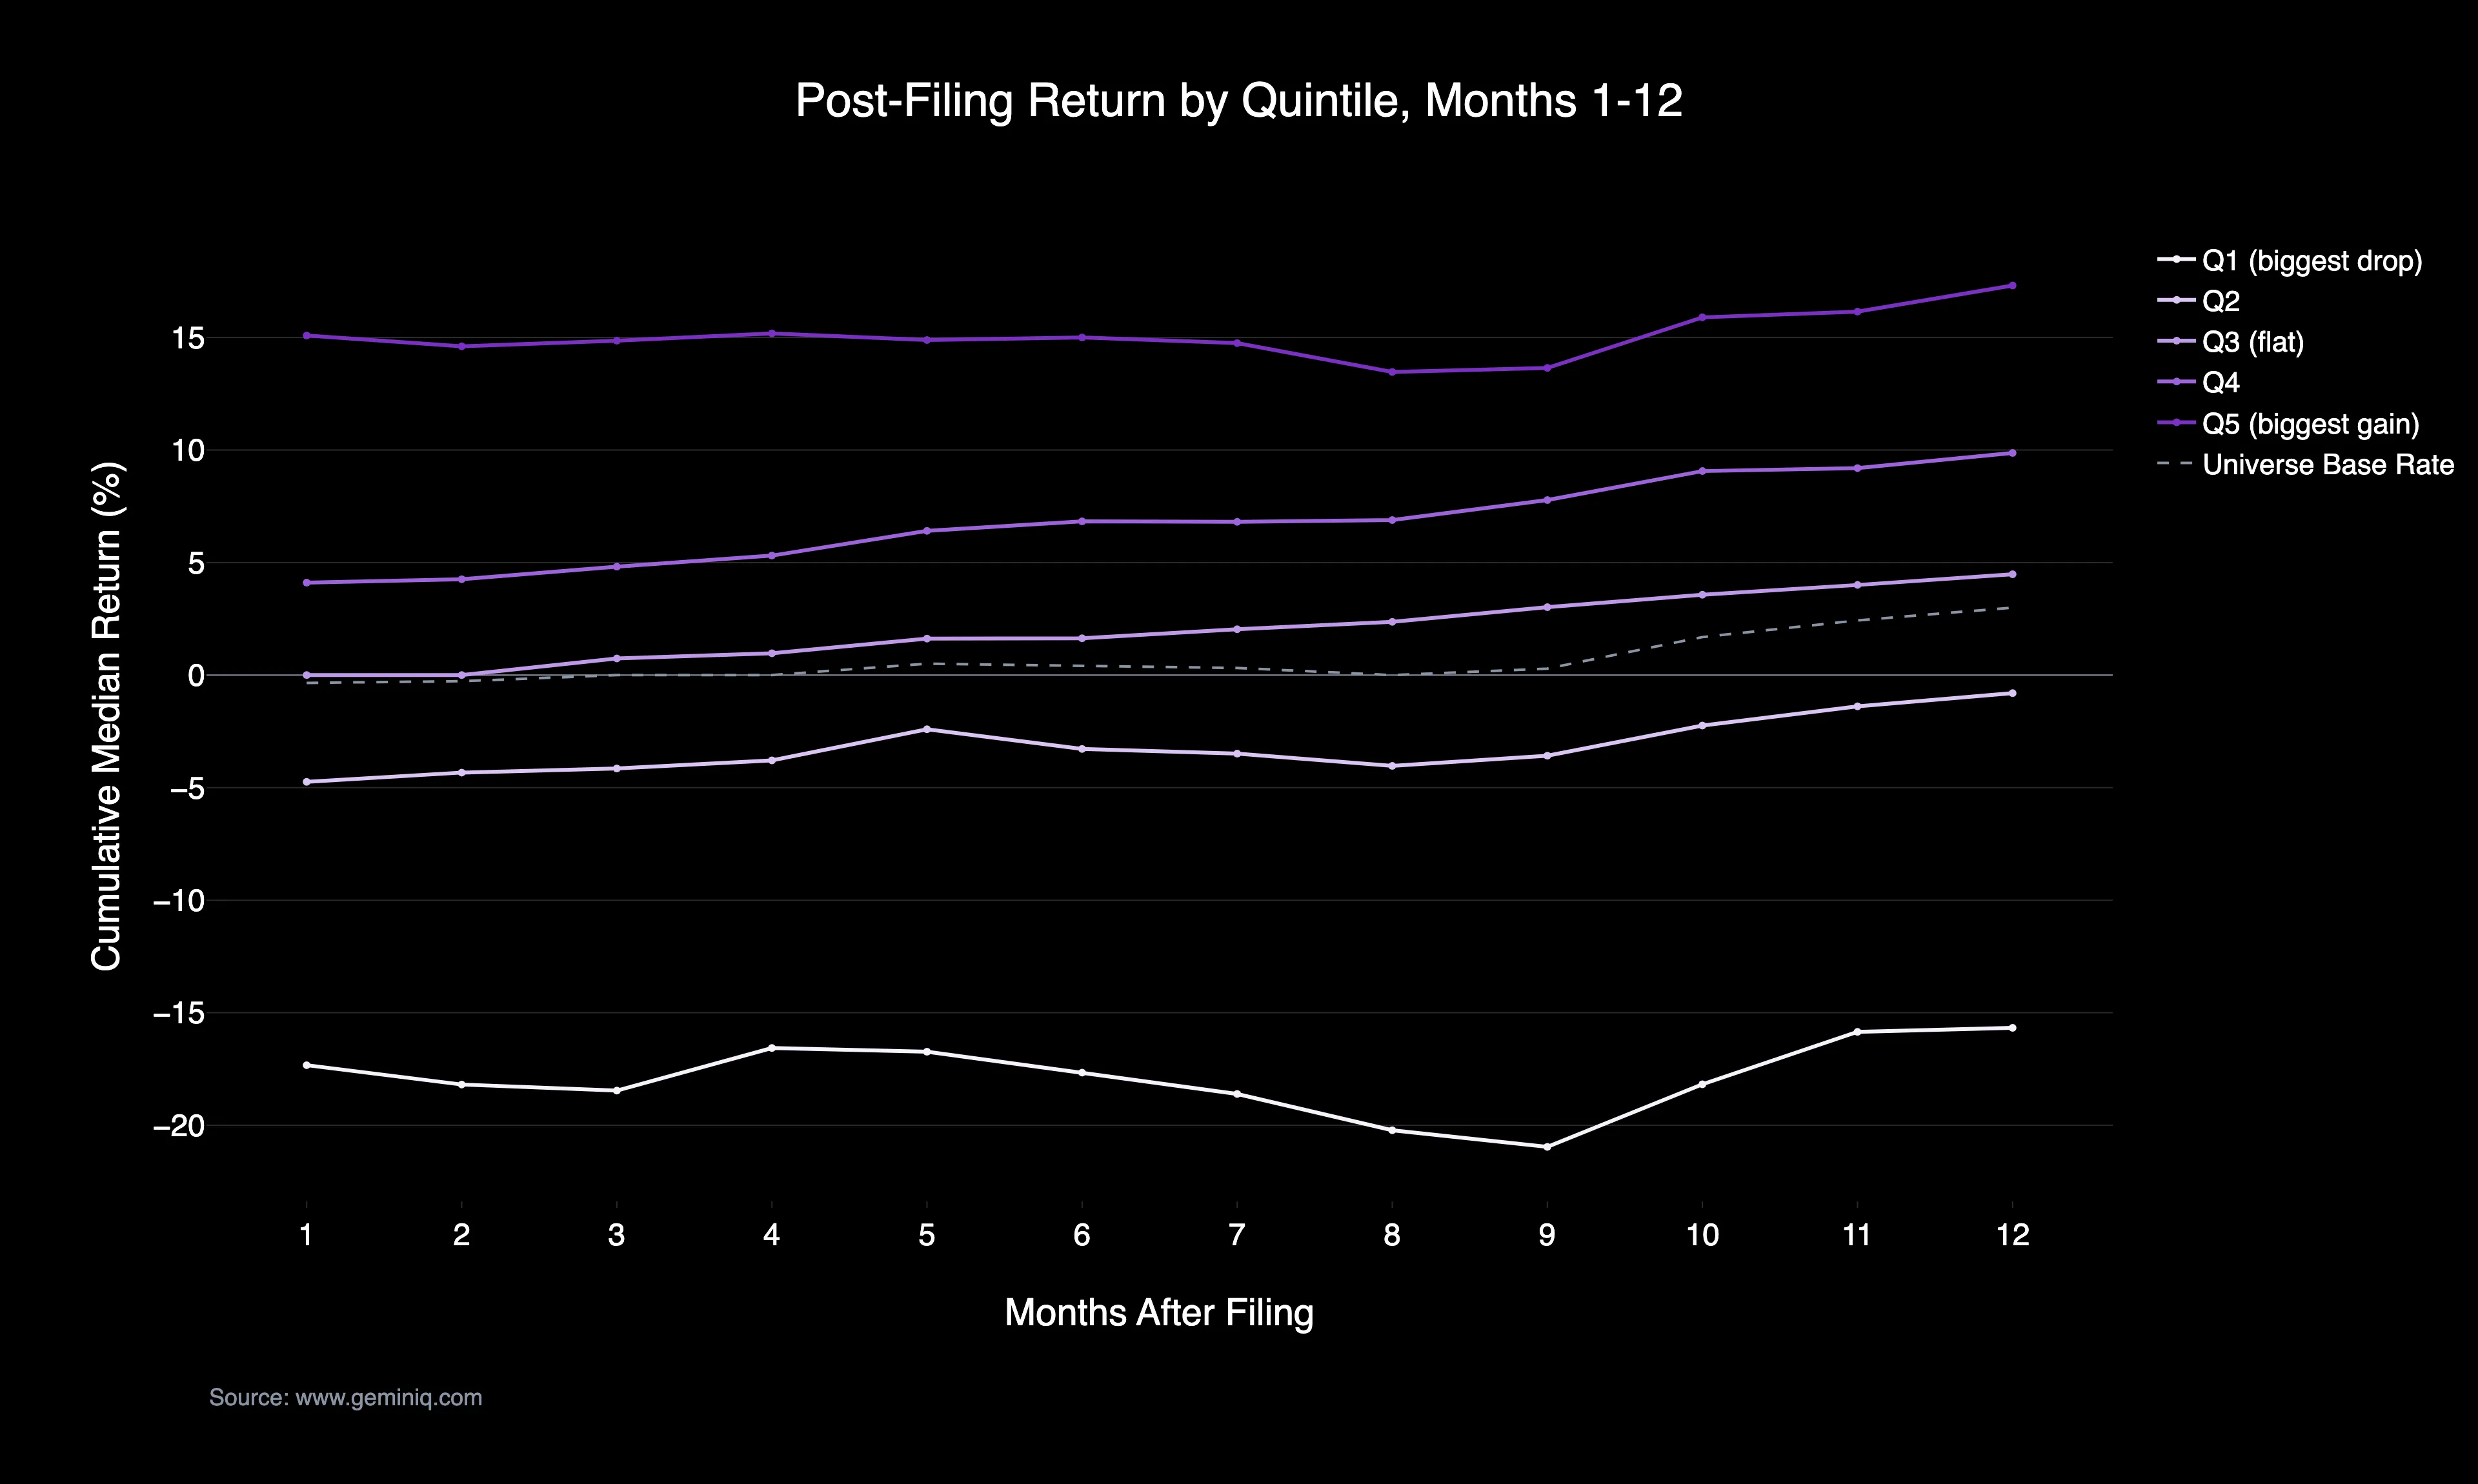
Filings whose stock fell into the worst-reacting fifth in the first month were followed by continued underperformance at the median for a full year — not a rebound. Filings in the best-reacting fifth held onto their gains just as durably. Reversal is not the typical outcome at either end of the distribution. Persistence is.
But the average tells a softer story, and the gap between the two numbers is the real finding here. Across the 52,739 filings in the worst-reacting fifth, the median cumulative return sat at -16.7% one month after filing and was still -15.7% twelve months later, among the 11,065 annual filings with a full year of tracked data. Over that same stretch, the group's winsorized mean return climbed from -21.0% to -4.5% — a very different trajectory. A minority of large recoveries pulled the average most of the way back toward even while the typical filing in the group never moved. That gap is the whole story: whether a big drop looks like it "recovers" depends entirely on whether the question is about the average filing or the one sitting in your portfolio. This is a historical association across the sample window, not a forecast — the next filing that drops this hard could land anywhere in that range.
The Data
The pattern isn't a two-point comparison. It holds across every month tracked, in both directions.
One Month After Filing
| Quintile (by initial post-filing move) | N | Median Return | Winsorized Mean |
|---|---|---|---|
| Q1 — biggest drop | 52,739 | -16.7% | -21.0% |
| Q2 — moderate drop | 52,745 | -4.7% | -4.9% |
| Q3 — flat | 52,696 | 0.0% | 0.0% |
| Q4 — moderate gain | 52,712 | 4.1% | 4.3% |
| Q5 — biggest gain | 52,632 | 15.2% | 26.1% |
| Universe base rate | 263,524 | 0.0% | 0.3% |
Twelve Months After Filing (10-K filings only)
| Quintile (by initial post-filing move) | N | Median Return | Winsorized Mean |
|---|---|---|---|
| Q1 — biggest drop | 11,065 | -15.7% | -4.5% |
| Q2 — moderate drop | 9,492 | -0.8% | 3.3% |
| Q3 — flat | 9,354 | 4.5% | 12.7% |
| Q4 — moderate gain | 9,303 | 9.9% | 12.6% |
| Q5 — biggest gain | 8,487 | 17.3% | 42.0% |
| Universe base rate | 47,703 | 3.0% | 11.3% |
The month-by-month version of the same data is the chart below. The biggest-drop quintile's median line barely lifts off its opening level across all twelve months, while its mean line arcs back toward the base rate — the same divergence from the table, drawn out over time instead of compressed into two snapshots. The population shifts after month three, from the full 10-Q-plus-10-K pool to 10-K filings only, since a quarterly filing's tracked window ends there; that shows up as a small step in every line at that point, not a change in the underlying pattern.
The pattern holds up by company size too, with one wrinkle worth knowing before using it. Splitting the worst-reacting fifth into market-cap terciles, small-cap drops got worse at the median before they got better: -18.5% at one month, -24.7% at twelve months (n=3,900). Mid- and large-cap drops stabilized instead of deepening further — the large-cap median moved from -15.6% to -11.8% over the same span (n=2,902) — but neither group closed the gap to the universe base rate's +3.0% twelve-month median. Size didn't produce reversal anywhere in this dataset. It only changed how much further the typical filing drifted before it flattened out.
The Extremes
Averages hide the range, and the range is the entire story for anyone holding one specific stock instead of a basket of 52,739 of them. The last week of February 2020 is as clean a natural experiment as this dataset contains: a cluster of leisure and travel names filed their FY2019 10-Ks within four calendar days of each other, all landed in the worst-reacting fifth as COVID-era selling hit immediately after, and all fell more than 70% in the first month. A year later, they had split into two entirely different outcomes. (This period predates the three-year filing window GeminIQ's stock pages currently display by default; all the companies below remain live, and their 2020 filings sit on the full historical record, just not the default view.)
Caesars Entertainment's FY2019 10-K, filed February 28, 2020, fell -82.4% in the first month. By month six it had cut that loss to -26.1%. By month twelve it was +58.5% — a filing that started in the worst-reacting fifth and finished the year as a clear winner, against the backdrop of the William Hill acquisition and the broader reopening trade.
Norwegian Cruise Line filed its FY2019 10-K one day earlier, on February 27, 2020, and fell -74.9% in the same window. Six months out it was still down -59.7%. Twelve months out, -29.2% — a genuine recovery from the bottom, but nowhere close to even. Royal Caribbean, filed February 25, traced the same arc: -73.2% at one month, -18.9% at twelve.
Both companies absorbed the identical shock, filed inside the same four-day window, and started in the same quintile. One closed the year a winner. The other closed it still deeply underwater. Nothing about the initial drop told you which one you were looking at — that only showed up in what each company actually did afterward.
The Method
None of this holds up unless the math behind it does. Every number above follows the same rules as every other filing data study on this site: post-filing return columns are cumulative and never compounded, every bucket is measured against the universe base rate rather than zero, and no bucket below roughly 200 filings gets a conclusion drawn from it — the tightest quintile cited here still clears 8,487. The full rule set, including exactly how the twelve-month 10-K window and three-month 10-Q window combine without double-counting, lives in the Filing Data Study Methodology post.
Check Your Holdings
The method behind this study runs on any single stock in about two minutes, and it's worth running before reacting to a red print. Open a holding's page on GeminIQ and pull up the Earnings Market Reaction Heat Map — the same cumulative-return-from-filing-date figure used to build every bucket above. Find its most recent filing's one-month cumulative move. A drop of -15% to -20% or worse puts it in territory where, historically, the typical filing was still down double digits a full year later — not a rebound story, whatever the headline says that week.
Before assuming this one is different, pull its Financial Statements and check whether Return On Invested Capital and Revenue Growth actually deteriorated alongside the price, or whether the underlying filing looks essentially unchanged and the move was purely a reaction. That distinction is the difference between a Caesars Entertainment and a Norwegian Cruise Line, and it's sitting in the filing, not in the stock chart.
Wall Street's data. Main Street's price.
Institutional terminals charge thousands a year for as-filed accuracy. GeminIQ gives you the same thing for a fraction of the cost: financials built directly from raw SEC EDGAR filings, not third-party APIs, with full XBRL traceability back to the original 10-K or 10-Q. No normalized guesswork, just calculated metrics, charts, screeners, and watchlists built on numbers exactly as the company reported them. Start researching now at GeminIQ.com.
All figures are drawn from each company's as-filed 10-K and 10-Q filings, publicly available on SEC EDGAR. Post-filing market reaction is measured from each filing's filed date, cumulative through each tracked month and never compounded. Sample: 264,286 filings across 5,637 companies, 2009–2026, quintiled by each filing's one-month cumulative post-filing return. Methodology: Filing Data Study Methodology.
Disclaimer: The content in this blog is for educational and entertainment purposes only and does not constitute financial, legal, or tax advice. Investing involves risk, including the loss of principal. The post-filing return patterns discussed in this article represent historical observations over the sample window and do not constitute predictions of future stock price movements for any individual stock. The views expressed are my own and not intended as financial advice or a guarantee of future performance.