
Tesla Free Cash Flow Turns Negative: Q2 2026 Data

By Chad Hartman
Published · Last updated
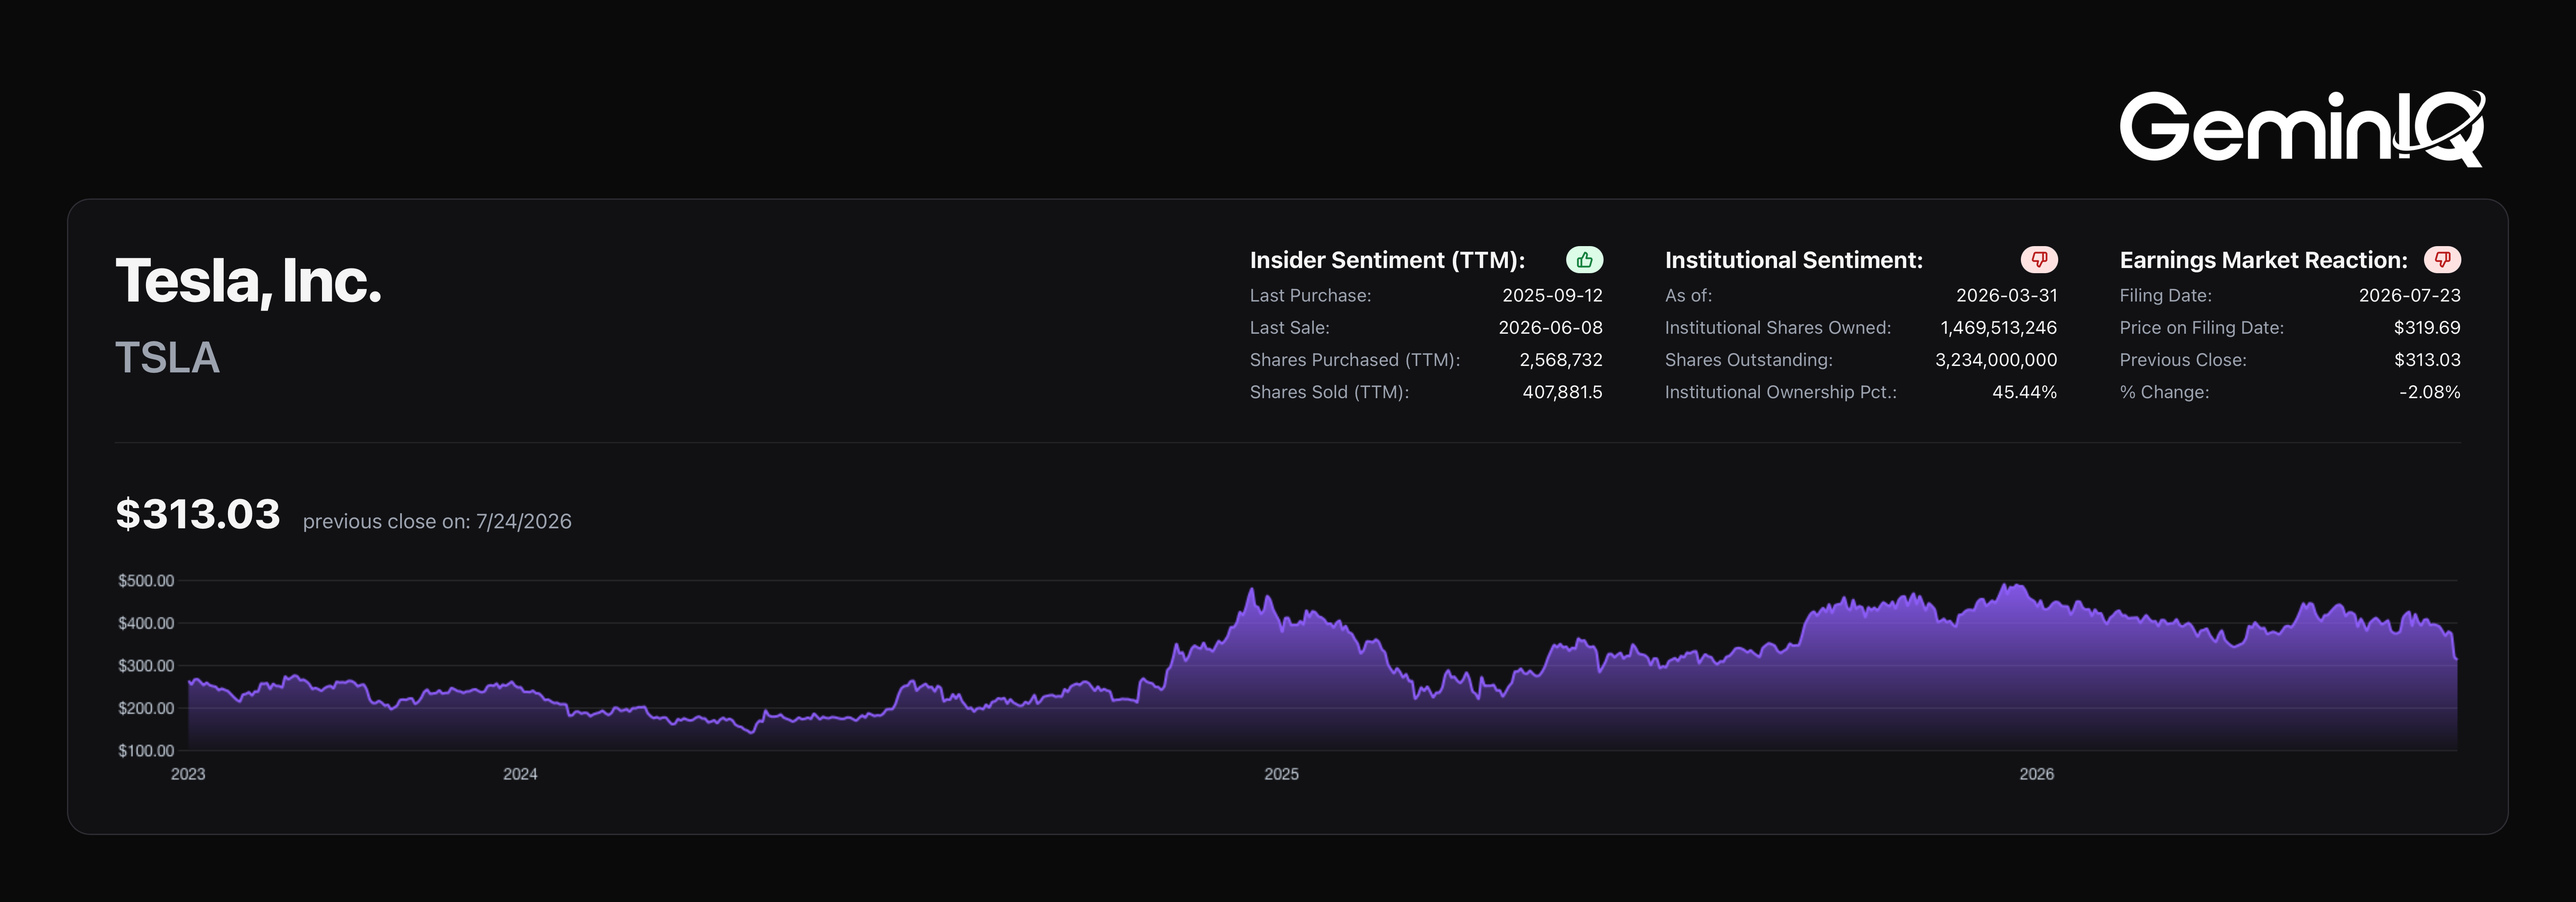
Tesla ($TSLA) filed its Q2 2026 10-Q on July 23, 2026, three days after reporting record quarterly revenue of $28.24 Billion. Most of the coverage has settled on the same framing: a beat on the top line, a miss on adjusted earnings, and a company entering what it called its "largest investment period." The filing tells a sharper story. Operating cash flow grew 84.9% year-over-year, but capital expenditures grew 141.8% — meaning the pace of cash going out the door now genuinely outruns the pace of cash coming in. The result: free cash flow just went negative for the first time in nine quarters, and almost nobody read past the headline to notice.
| Field | Value |
|---|---|
| Ticker | $TSLA |
| Filing | Q2 2026 10-Q |
| Filed | July 23, 2026 |
| Period End | June 30, 2026 |
| Free Cash Flow (Quarterly) | -$1.092 Billion |
| Operating Income | $398 Million |
The Capex Bet Just Flipped Free Cash Flow Negative
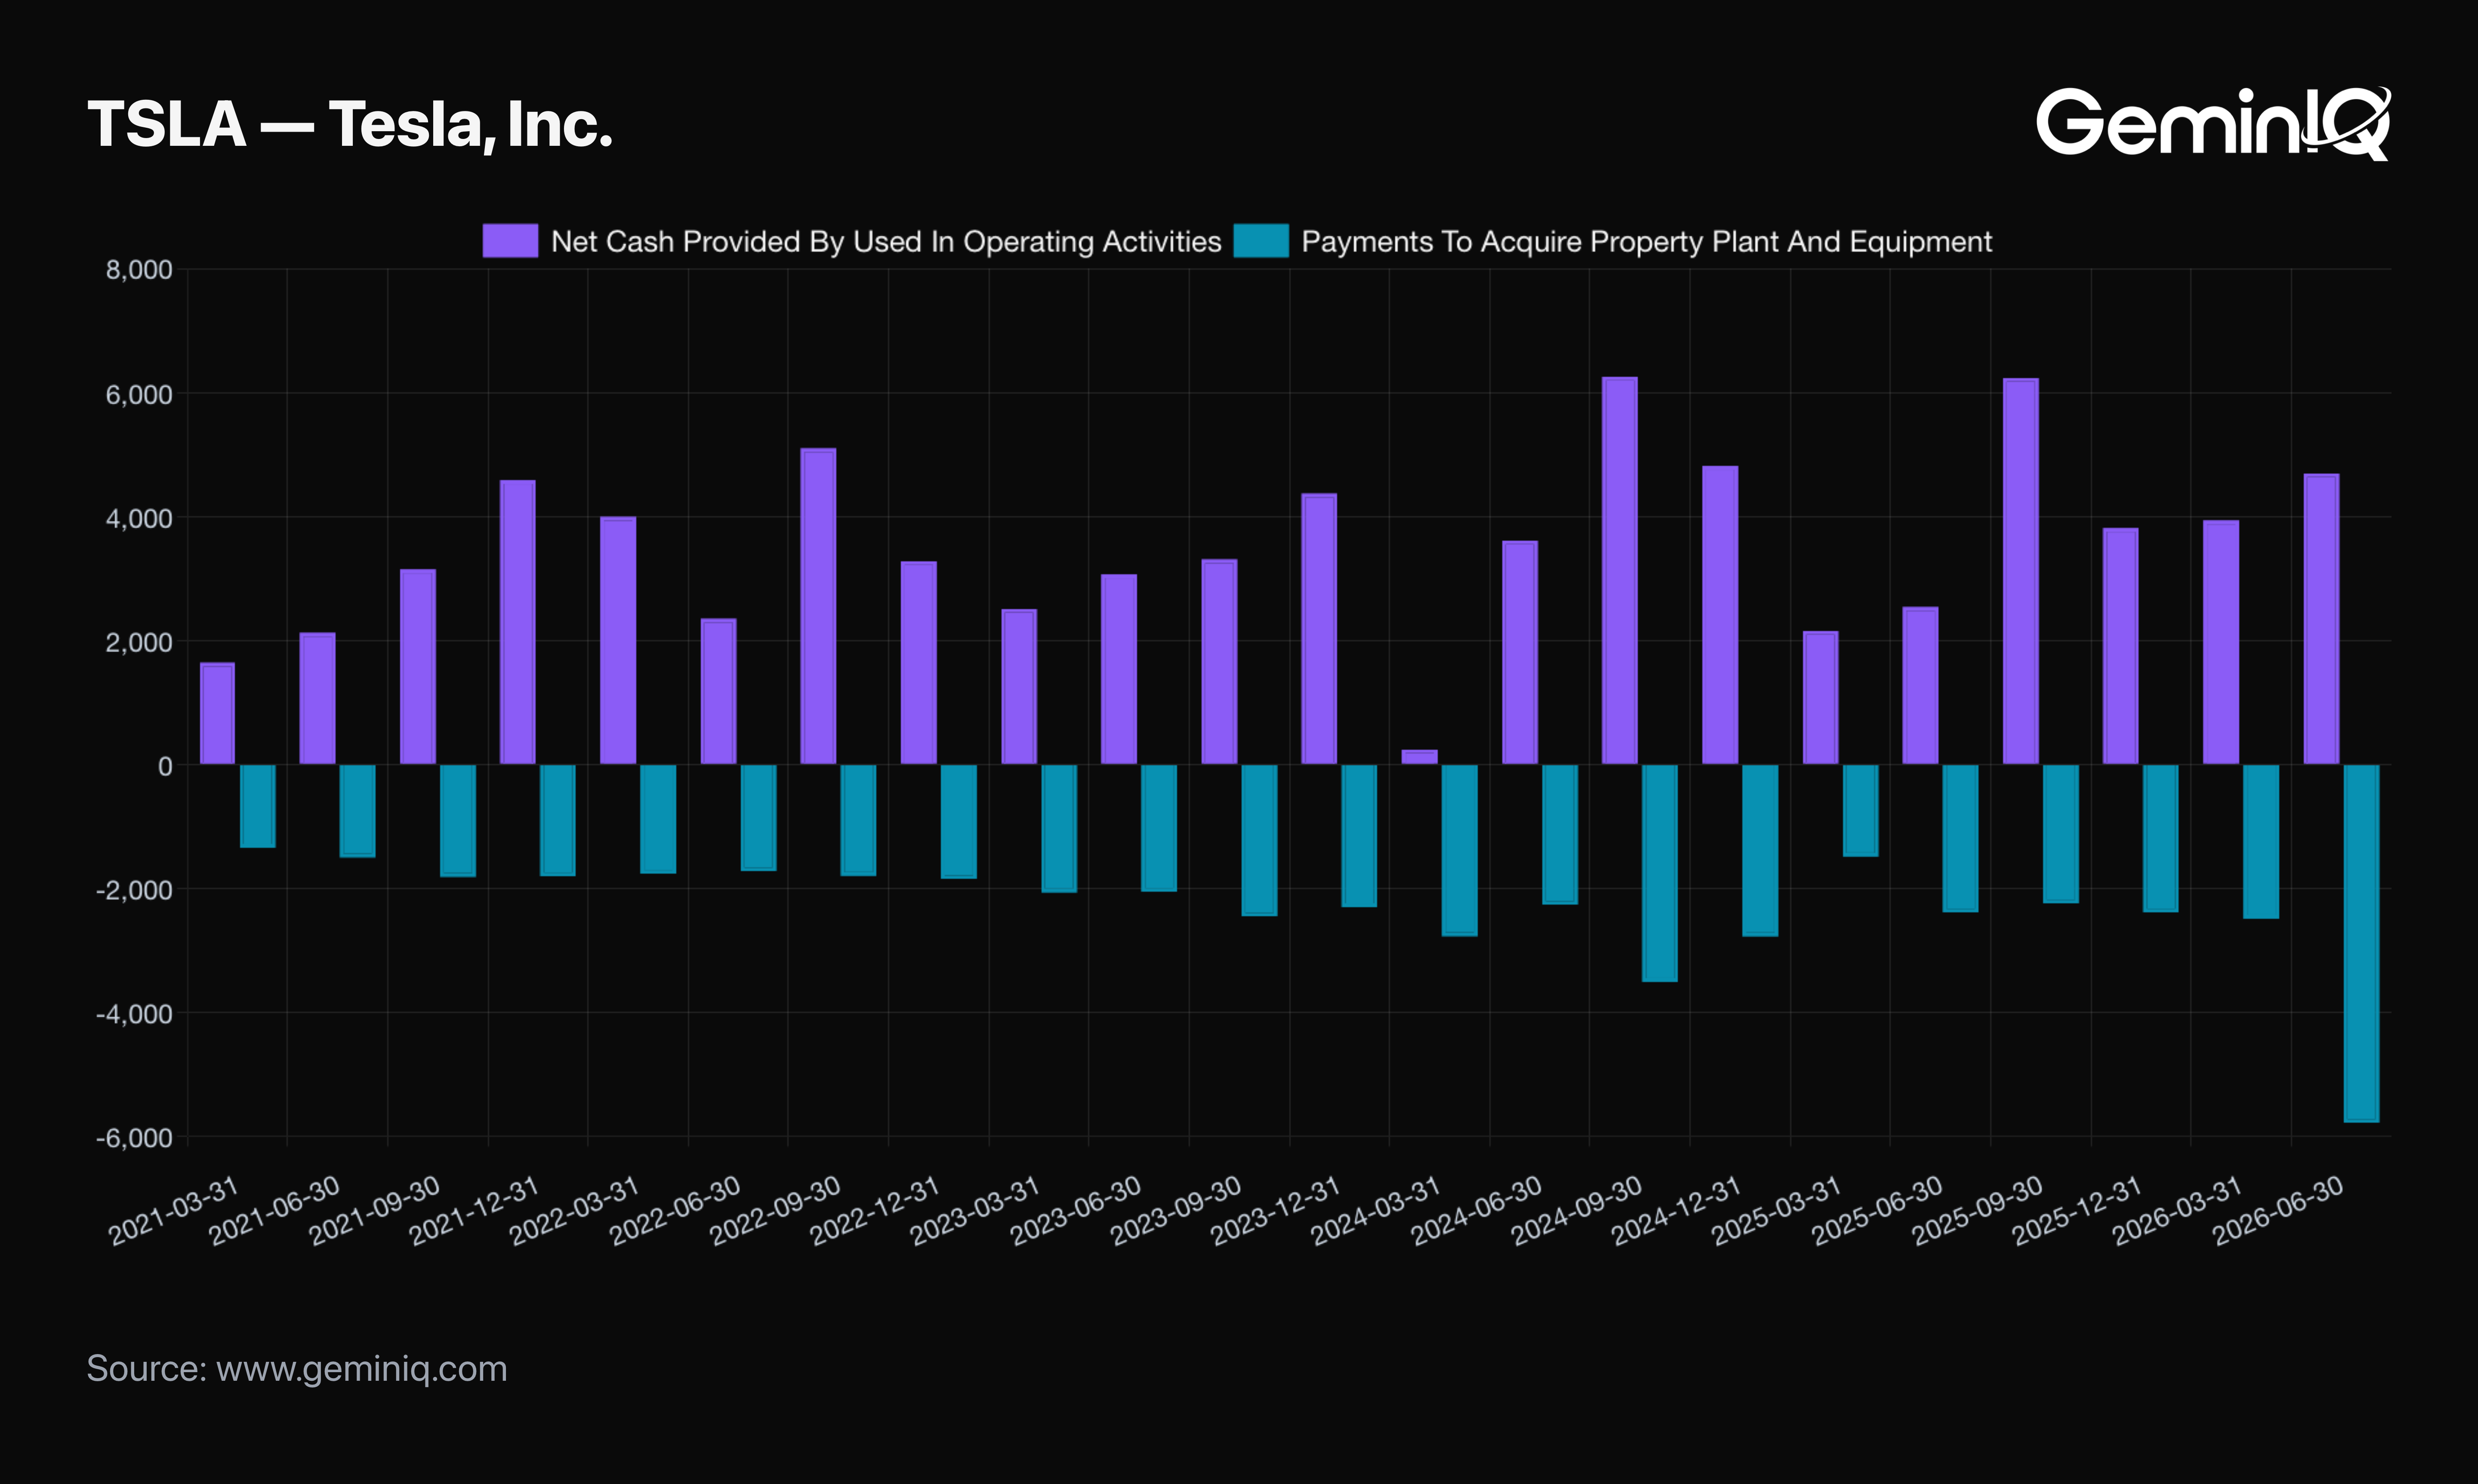
Tesla's shareholder letter frames the current spending as strategic — the company's entry into what it calls its largest investment period, aimed at transportation, energy, and AI. The cash flow statement shows what that actually costs in a single quarter.
The Data: Tesla's Net Cash Provided By Used In Operating Activities came in at $4.697 Billion for the quarter, up 84.9% from $2.540 Billion in Q2 2025. Payments To Acquire Property Plant And Equipment grew faster, to $5.789 Billion from $2.394 Billion — a 141.8% increase. Net the two together and quarterly free cash flow lands at -$1.092 Billion, the first negative quarter since Q1 2024, when free cash flow was -$2.535 Billion. Every one of the eight quarters in between was free-cash-flow positive.
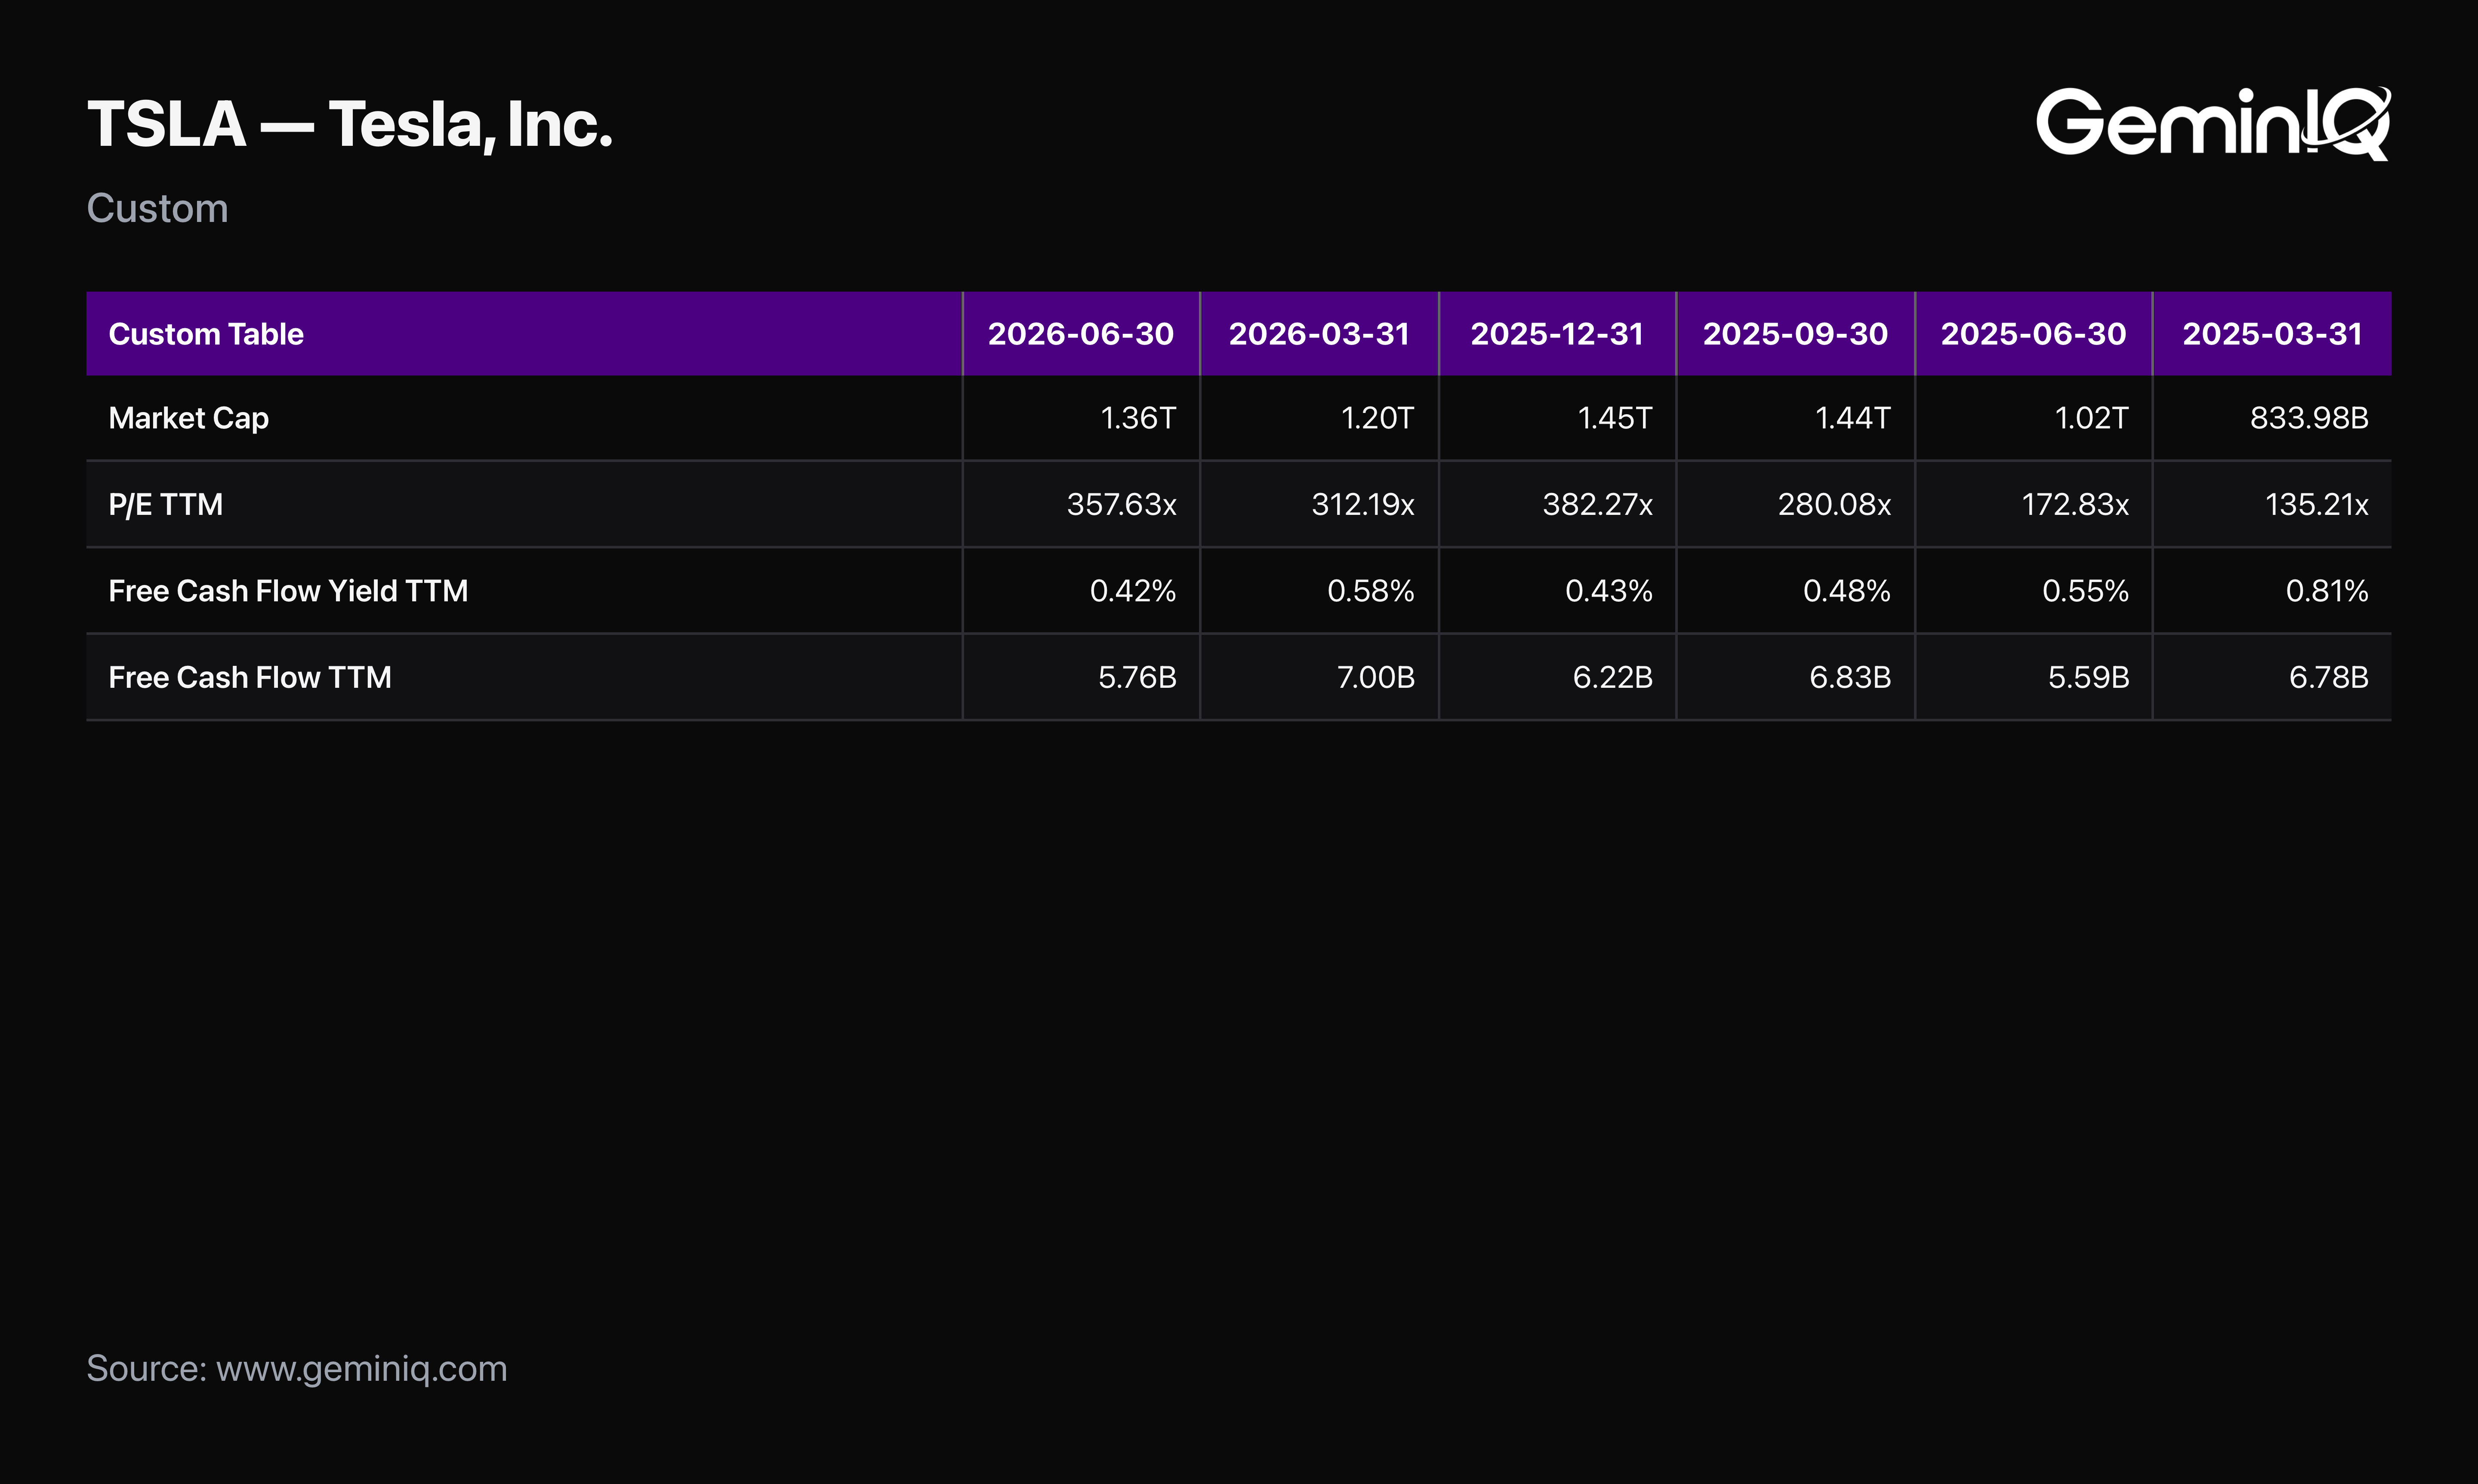
The GeminIQ Edge: A trailing-twelve-month figure — which is what most platforms default to — would have shown this same quarter as barely a dent in a positive number. Tesla's GeminIQ Free Cash Flow (TTM) still reads $5.762 Billion, down only modestly from $7.000 Billion last quarter. The single-quarter break only becomes visible when the cash flow statement is read one filing period at a time, in GeminIQ's Financial Statements view — not smoothed into a trailing average that would have hidden the exact moment the spending outran the cash.
Operating Expenses Are Growing Almost Twice as Fast as Revenue
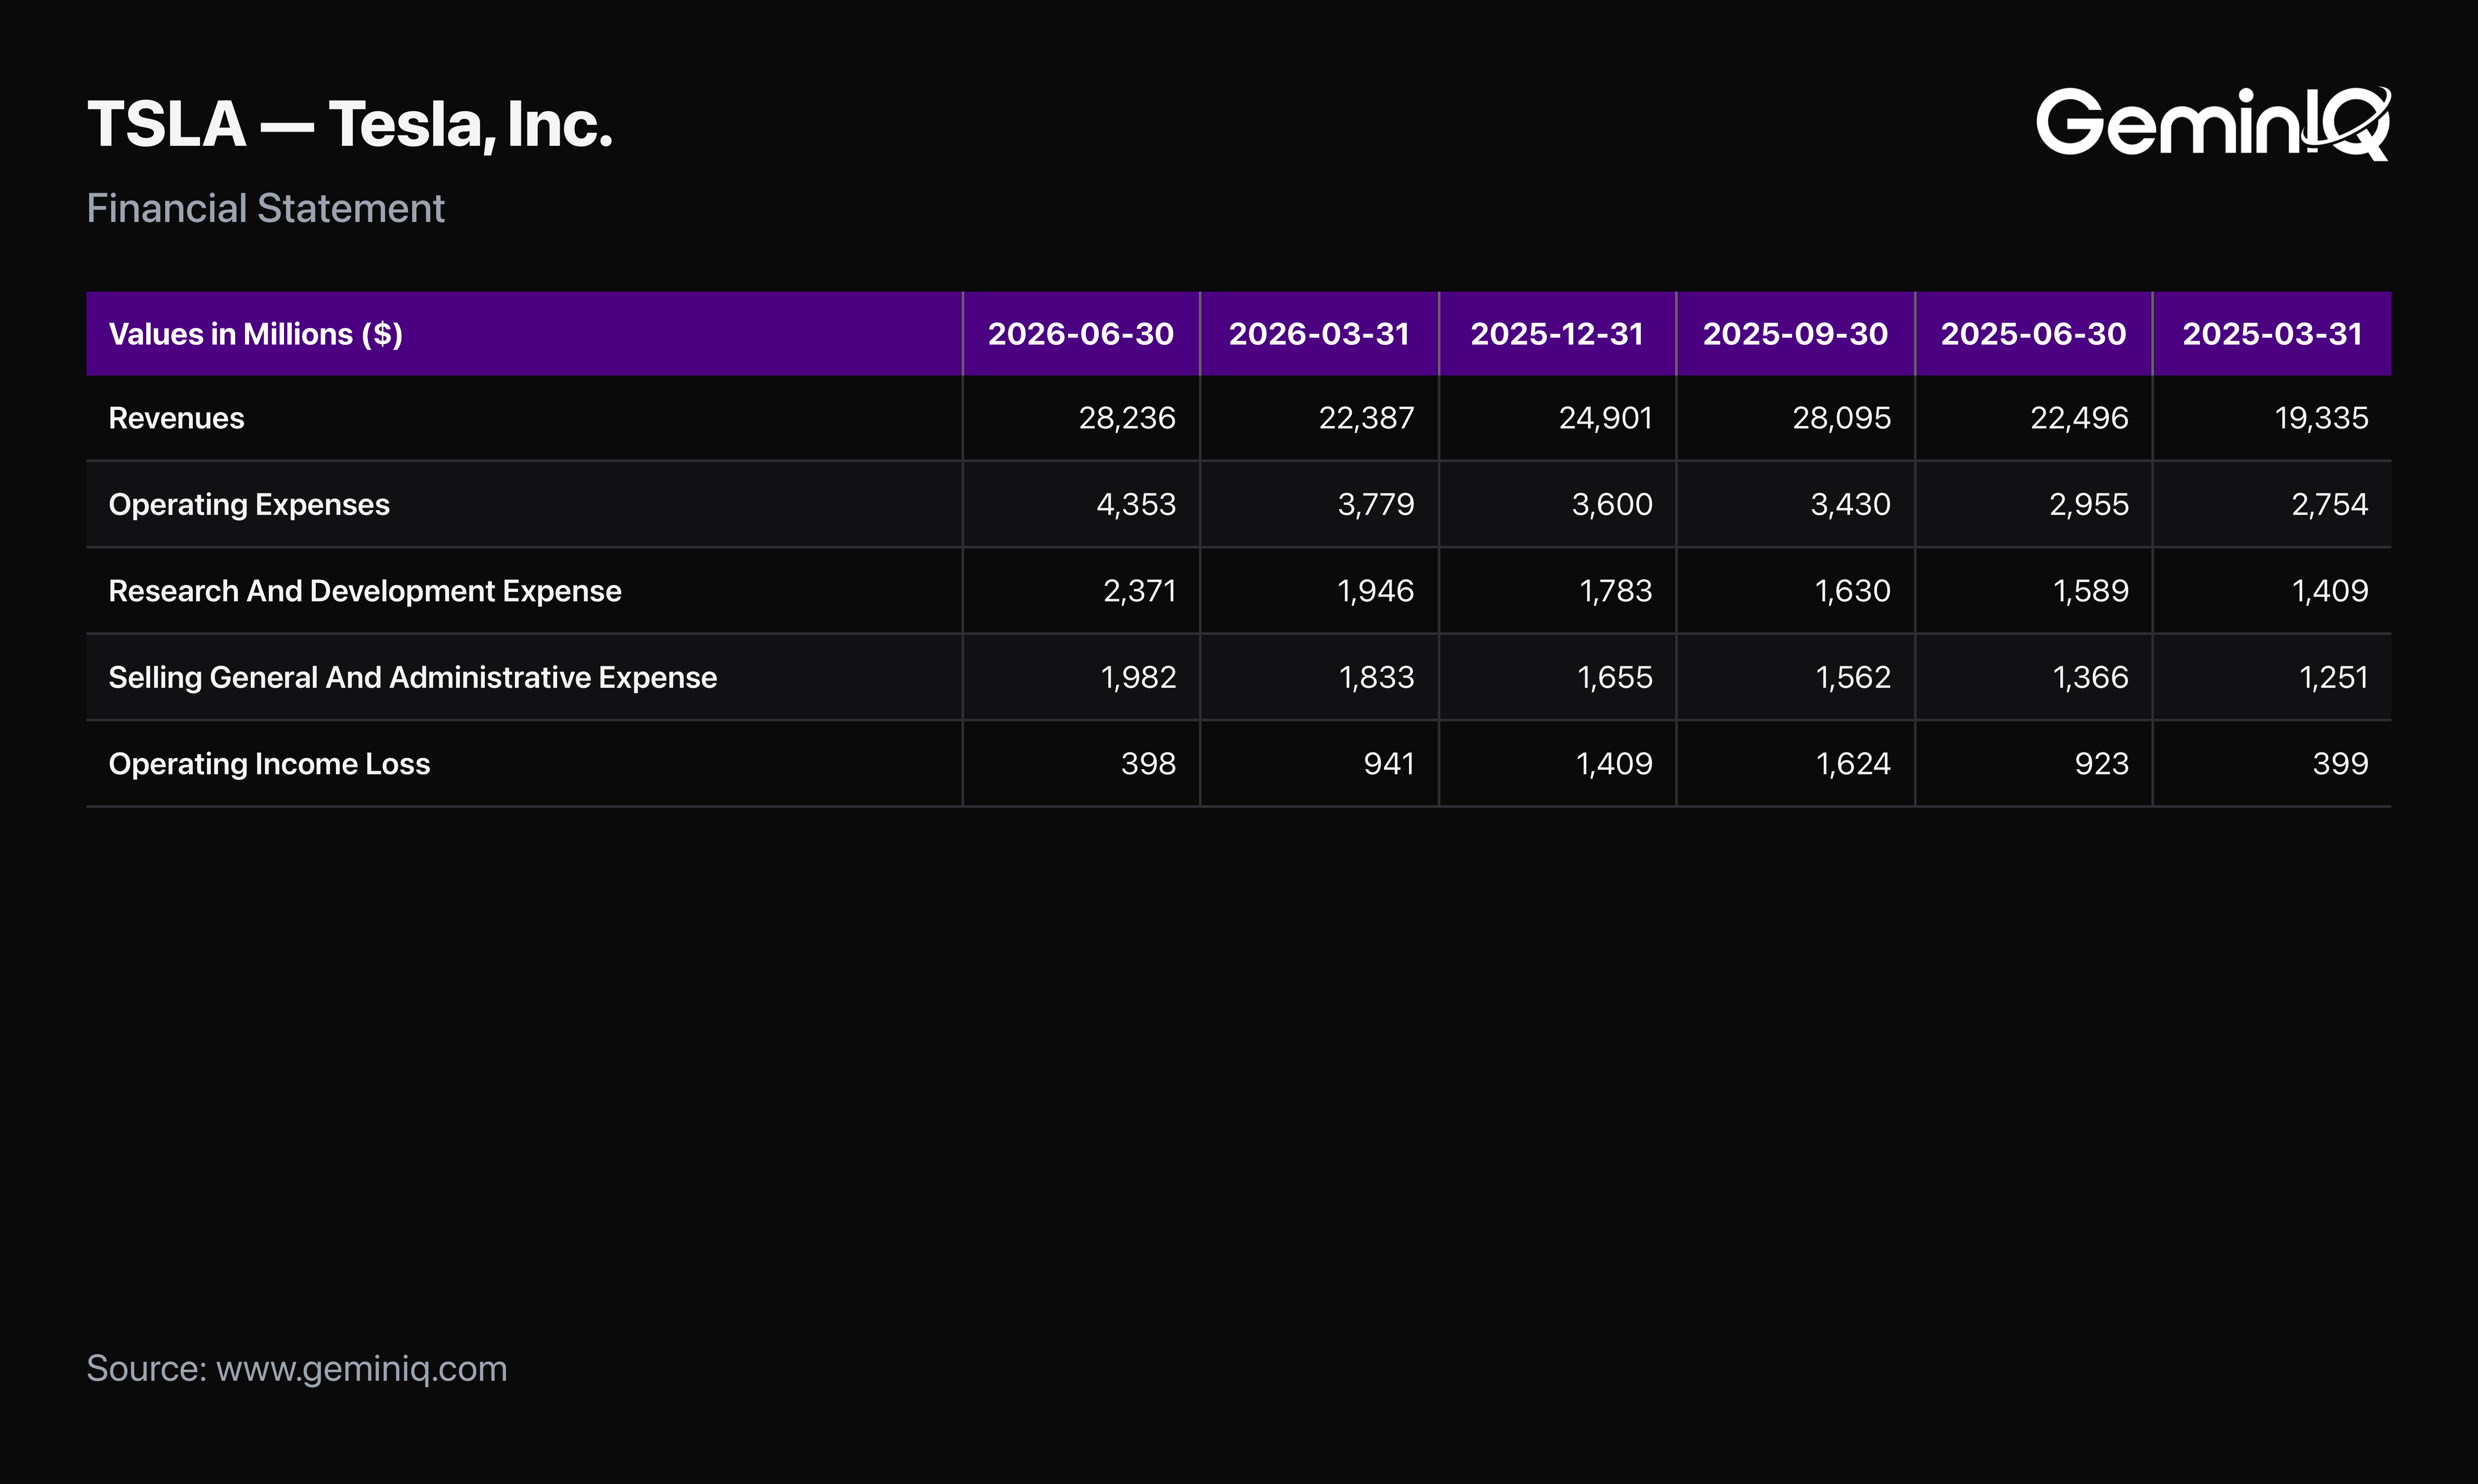
Revenue set a record this quarter. The expense line next to it grew even faster, and that's the part of the filing that determines whether the record actually shows up as profit.
The Data: Tesla's revenue for the quarter came in at $28.236 Billion, up 25.5% from $22.496 Billion a year ago. Operating Expenses grew to $4.353 Billion from $2.955 Billion, a 47.3% increase — nearly double the pace of the top line. Inside that total, Research And Development Expense rose 49.2% to $2.371 Billion, and Selling General And Administrative Expense rose 45.1% to $1.982 Billion. Operating Income Loss fell 56.9%, from $923 Million to $398 Million, in the same quarter revenue hit an all-time high.
The GeminIQ Edge: GeminIQ's pre-calculated Operating Profit Margin (TTM) confirms the direction independent of any single quarter's noise: 4.22%, down from 6.06% a year earlier. A revenue beat and a shrinking operating margin aren't contradictory — reading the income statement and the calculated metric side by side is what keeps a beat headline from burying a real deterioration in unit economics.
The Net Income Number That Held Up for a Different Reason
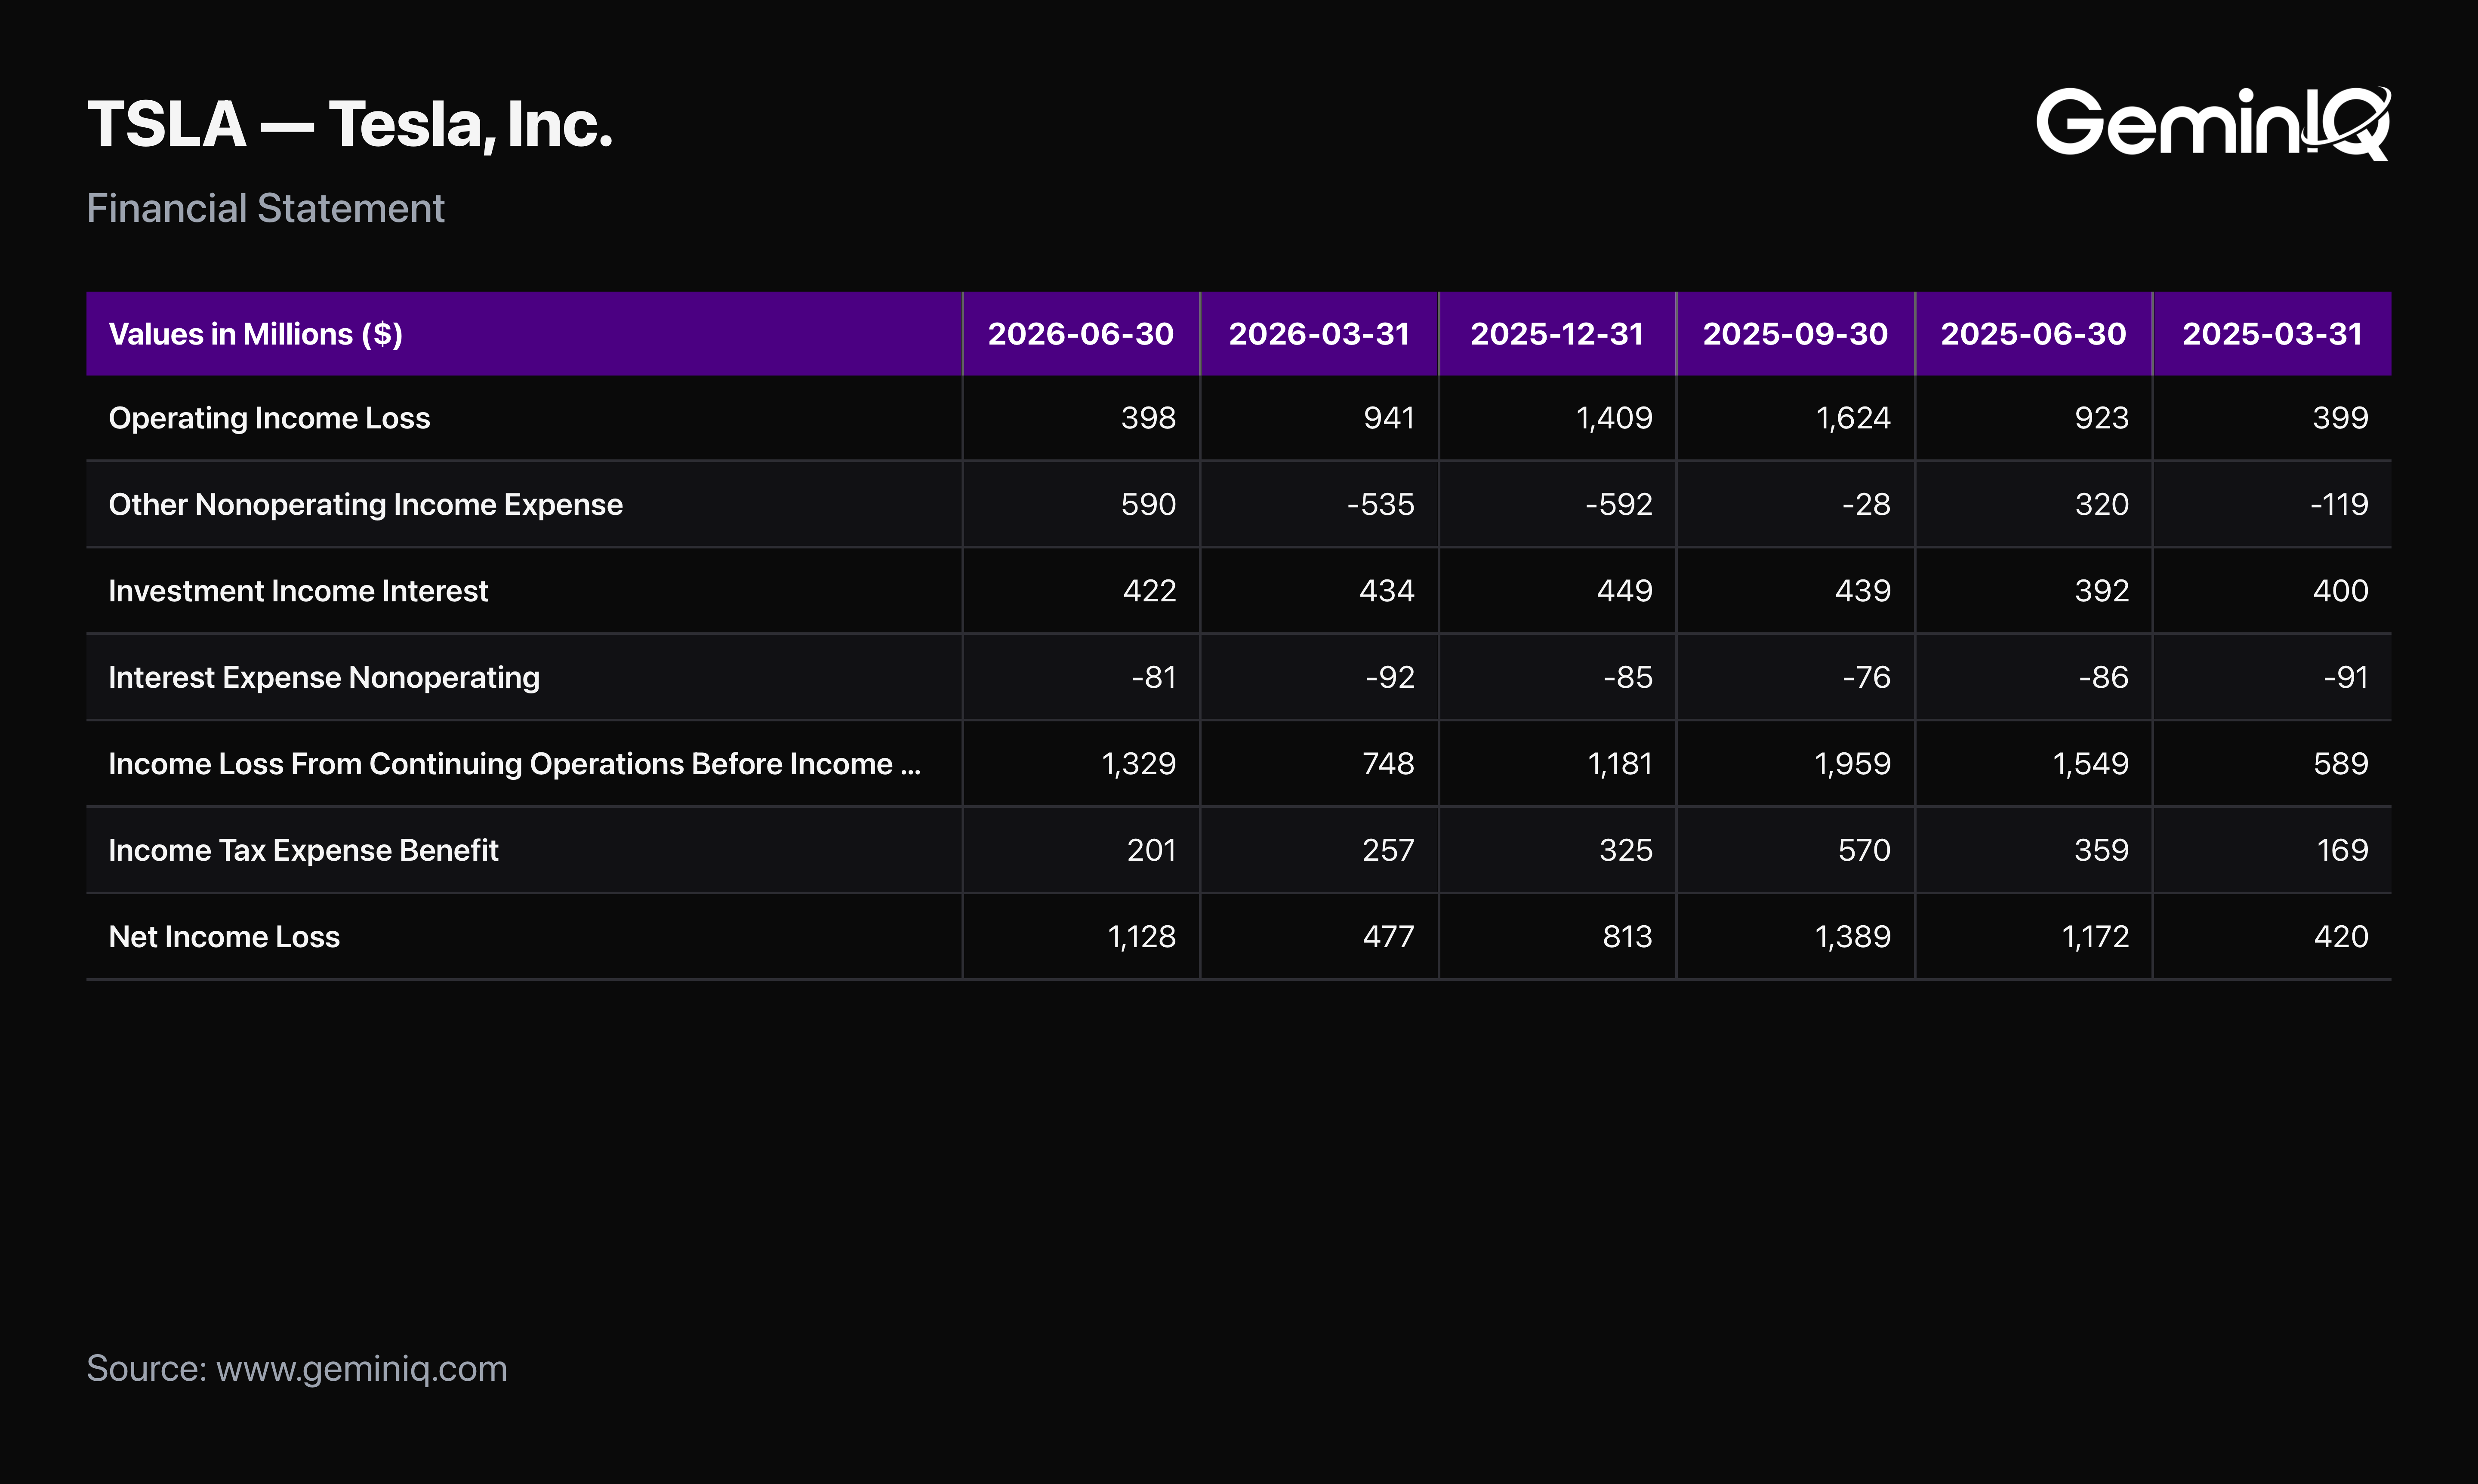
Operating income fell 56.9%. Net income fell 3.75%. Both numbers are accurate, and neither one is measuring the same thing.
The Data: Tesla's Operating Income Loss of $398 Million is well short of the $1.329 Billion in Income Loss From Continuing Operations Before Income Taxes Extraordinary Items Noncontrolling Interest reported for the quarter. Non-operating income bridges the gap: Other Nonoperating Income Expense came to $590 Million (up 84.4% from $320 Million), Investment Income Interest rose to $422 Million from $392 Million, and Interest Expense Nonoperating was -$81 Million. Combined, non-operating income rose 48.7% year-over-year, from $626 Million to $931 Million — a bigger dollar increase than the entire decline in operating income. Income Tax Expense Benefit then came in at $201 Million against that $1.329 Billion in pretax income, a 15.1% effective rate versus 23.2% a year ago. Net Income Loss landed at $1.128 Billion, down just 3.75% from $1.172 Billion.
The GeminIQ Edge: None of this is irregular accounting — it's the ordinary mechanics of a multi-line income statement. But it means the one number that leads every headline is the most cushioned line on the page. GeminIQ's Financial Statements view lays out operating income, pretax income, and net income as three separate, traceable lines. A summary-only platform collapses straight to the bottom line — and never shows you how it got there.
The Balance Sheet Still Has Room — For Now
One negative quarter doesn't threaten a company with tens of billions in liquidity. What it does is shrink the cushion the market has been pricing as unlimited.
The Data: Tesla closed the quarter with $15.219 Billion in Cash And Cash Equivalents At Carrying Value and $28.305 Billion in Short Term Investments — a combined $43.524 Billion in liquidity. Against that, GeminIQ's pre-calculated Market Capitalization stands at $1.361 Trillion, and the Price-to-Earnings Ratio (P/E) (TTM) sits at 357.63x. GeminIQ's Free Cash Flow Yield (TTM) — already thin at 0.55% a year ago and 0.58% last quarter — has fallen to 0.42%.
The GeminIQ Edge: A $43.524 Billion liquidity position means one heavy-capex quarter isn't a solvency event — Tesla can fund several more quarters like this one without touching the balance sheet's structure. But a Free Cash Flow Yield already under half a percent, now trending lower, is the number that shows how little margin for error exists at a 357.63x earnings multiple. Whether Q2 2026 was a single investment-heavy quarter or the start of a pattern is the question the next filing answers. GeminIQ's Financial Statements will show it first, unfiltered, the day the 10-Q drops.
Wall Street's data. Main Street's price.
Institutional terminals charge thousands a year for as-filed accuracy. GeminIQ gives you the same thing for a fraction of the cost: financials built directly from raw SEC EDGAR filings, not third-party APIs, with full XBRL traceability back to the original 10-K or 10-Q. No normalized guesswork, just calculated metrics, charts, screeners, and watchlists built on numbers exactly as the company reported them. Start researching now at GeminIQ.com.
All financial figures cited in this article reference Tesla, Inc.'s Q2 2026 10-Q (filed July 23, 2026, period ending June 30, 2026). All SEC filings are publicly available at SEC EDGAR.
Disclaimer: The content in this blog is for educational and entertainment purposes only and does not constitute financial, legal, or tax advice. Investing involves risk, including the loss of principal. The views expressed are my own and not intended as financial advice or a guarantee of future performance.