
Working Capital Drain: Honeywell's $3.1 Billion Gap

By Chad Hartman
Published · Last updated
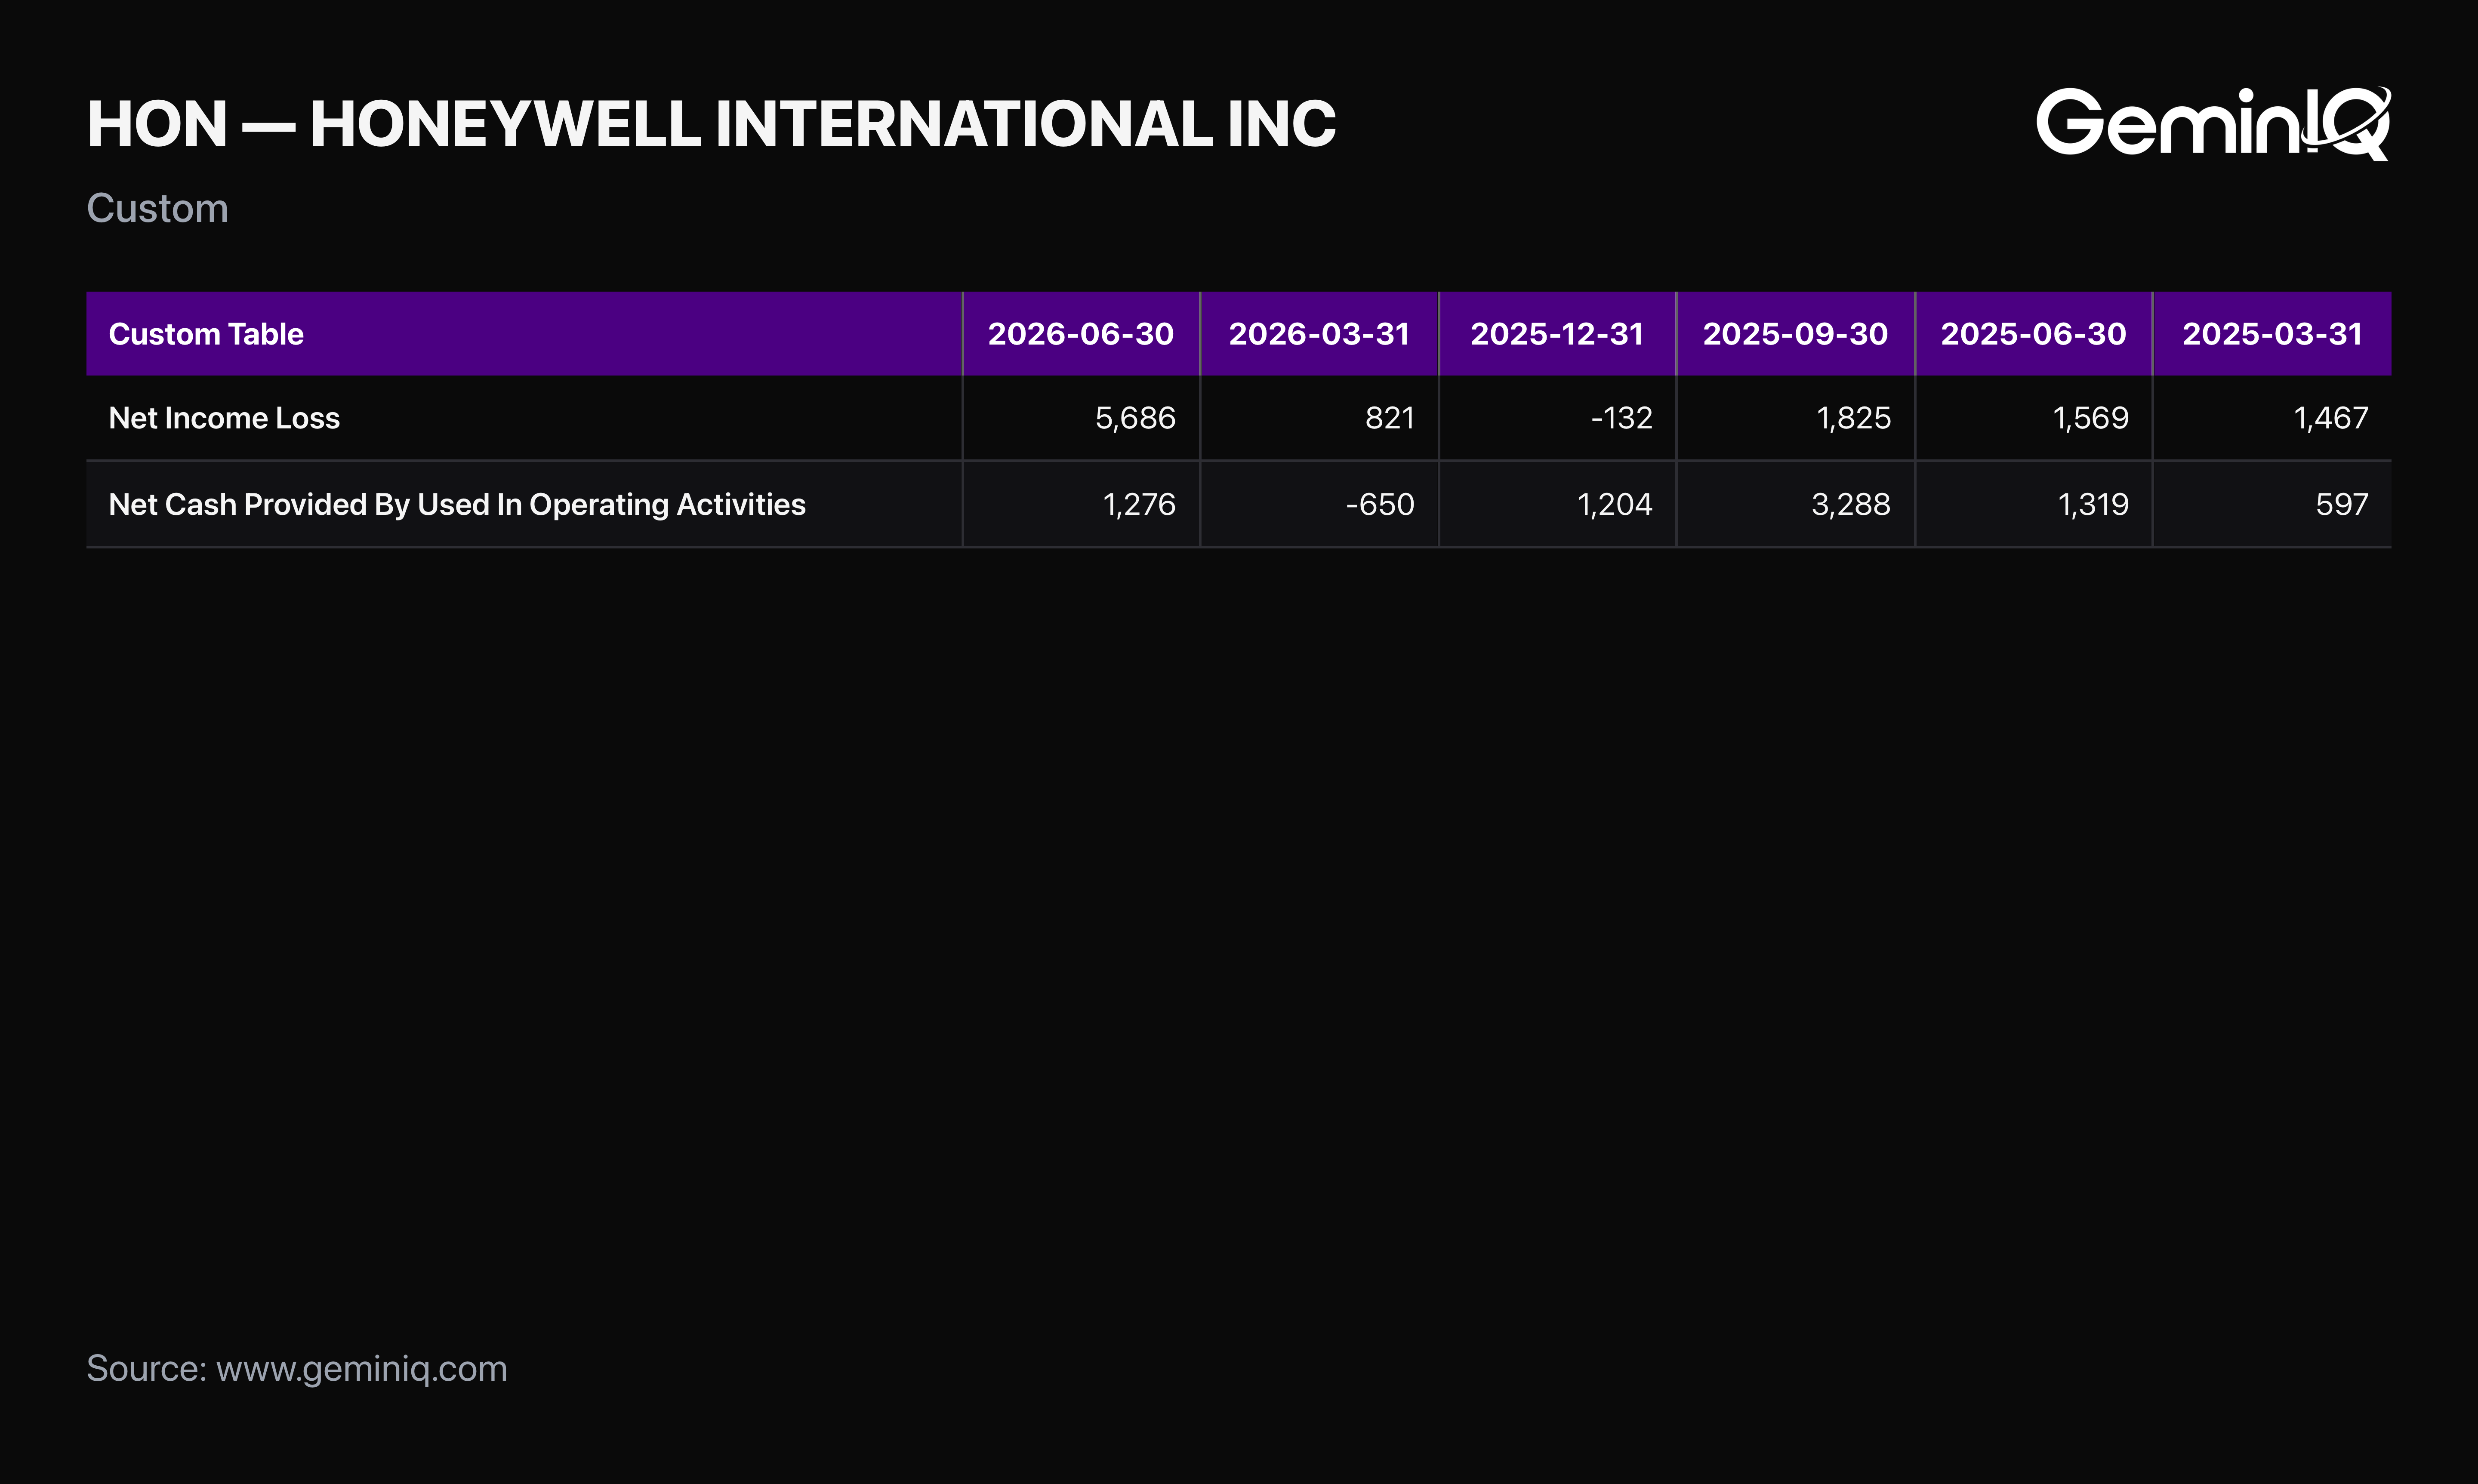
Honeywell International reported $8.2 billion in net income against just $5.1 billion in operating cash flow over the trailing twelve months — a $3.1 billion gap, meaning roughly 38% of the earnings figure that flows into the headline didn't show up as cash the business actually generated. Neither number is wrong; both are as-filed. But when reported earnings and operating cash consistently diverge by this much, the difference between the two is exactly where working capital movements, timing differences, and non-cash items live, and it's worth knowing which one is doing the heavier lifting in a given quarter's headline.
This study reads GeminIQ's as-filed universe as of the most recent trailing-twelve-month filing period, restricted to non-financial companies with over $1 billion in trailing revenue, positive net income above $100 million, positive operating cash flow, and a net margin sane enough to rule out one-time gain distortions. 15 companies anchor the largest dollar-value gaps between net income and operating cash flow in the current snapshot.
The Pattern
A persistent gap between net income and operating cash flow is not automatically a red flag — it's a prompt to look at what's driving it. Reported earnings include non-cash items (deferred taxes, unrealized gains, certain accruals) that operating cash flow strips back out, and operating cash flow reflects real working capital movements (receivables building, inventory growing, payables shrinking) that don't touch the income statement at all. A company where receivables and inventory are consistently absorbing cash faster than earnings are being booked is showing a specific, checkable signal in the cash flow statement — one that a headline EPS number will never surface on its own.
The Data
| Rank | Company | Ticker | Sector | Net Income (TTM) | Operating Cash Flow (TTM) | Gap |
|---|---|---|---|---|---|---|
| 1 | Honeywell International Inc | HON | Manufacturing | $8.2B | $5.1B | $3.08B |
| 2 | Netflix Inc | NFLX | Services | $13.6B | $12.0B | $1.68B |
| 3 | Lam Research Corp | LRCX | Manufacturing | $7.3B | $5.9B | $1.41B |
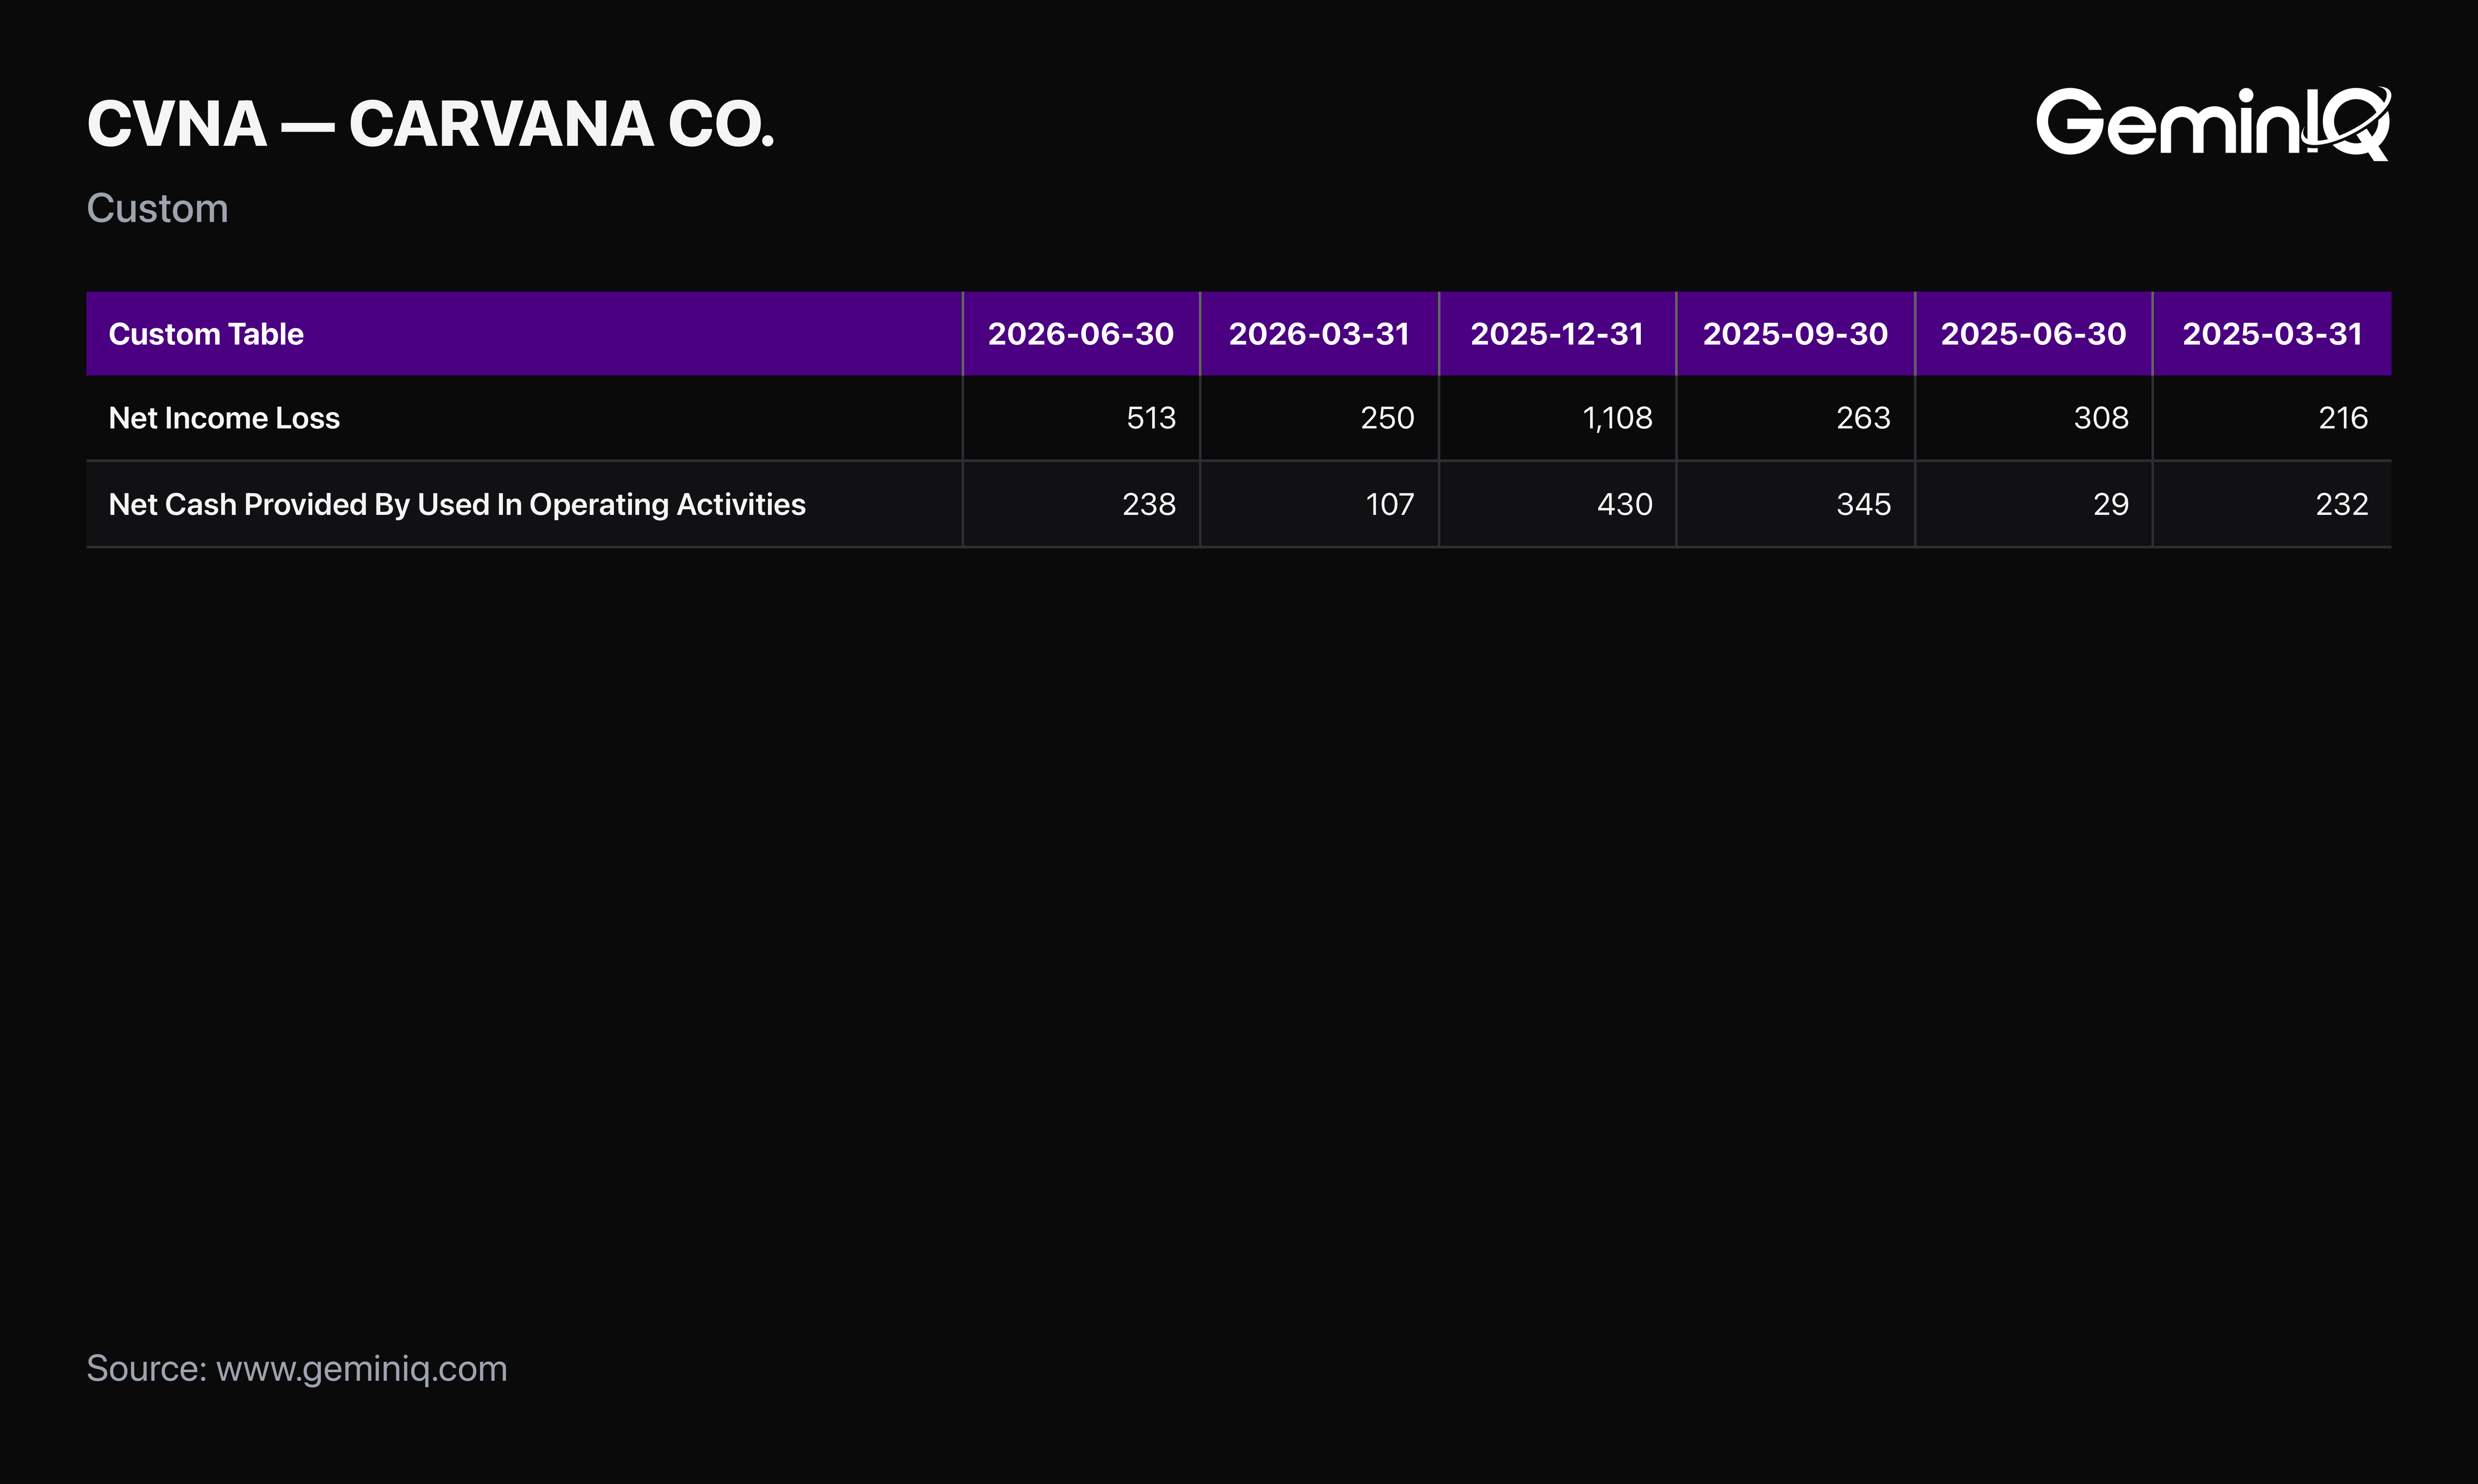
| 4 | Carvana Co. | CVNA | Retail Trade | $2.1B | $1.1B | $1.01B |
| 5 | Ferguson Enterprises Inc. | FERG | Wholesale Trade | $2.4B | $1.4B | $1.01B |
| 6 | Solventum Corp | SOLV | Manufacturing | $1.4B | $0.4B | $1.01B |
| 7 | Martin Marietta Materials Inc | MLM | Mining | $2.5B | $1.5B | $0.94B |
| 8 | Applied Materials Inc | AMAT | Manufacturing | $9.3B | $8.4B | $0.87B |
| 9 | Lennar Corp | LEN | Construction | $1.6B | $0.9B | $0.77B |
| 10 | Dana Inc | DAN | Manufacturing | $1.1B | $0.4B | $0.71B |
Carvana: The Gap Worth a Second Look
Carvana's gap stands out for a different reason than the industrials on this list. The company's net income of $2.1 billion against operating cash flow of $1.1 billion — a 47.5% shortfall — comes at a company still relatively early in a turnaround narrative that has been heavily rewarded by the market, which makes the earnings-versus-cash divergence a more consequential check than it would be at a mature industrial with decades of stable working capital patterns. Neither figure alone settles whether the gap is temporary financing-related working capital or a more persistent feature of the business; it is the kind of divergence worth tracking across future filings rather than reading once.
Netflix and Lam Research illustrate the more benign version of the same gap: both are large, mature, consistently profitable businesses where the net income/OCF divergence sits well below 20% of earnings and has more to do with the timing of content amortization and receivables than any underlying earnings-quality concern.
The Method
Net income and operating cash flow are both trailing-twelve-months, as-filed figures drawn from GeminIQ's Financial Statements data for each company's most recent filing period within the last fifteen months. This ranking restricts the universe to companies with a net margin under 40% to exclude one-time gain distortions (deconsolidation gains, bargain purchase gains, and similar non-recurring items can otherwise produce an implausibly large gap that reflects an accounting event rather than a working capital pattern), and to companies with over $1 billion in trailing revenue and positive operating cash flow. Full methodology is covered in How GeminIQ Builds Filing Data Studies.
Check Your Holdings
Pull up any position's net income and operating cash flow on GeminIQ side by side and check how far apart they run relative to earnings — a small, stable gap is normal, but a large or widening one is worth tracing to its source in the cash flow statement's working capital section before taking the headline earnings number at face value. Every reader can run that same comparison directly against GeminIQ's as-filed data.
Frequently Asked Questions
What does it mean when operating cash flow is lower than net income?
It means the earnings figure reported on the income statement includes items — non-cash gains, deferred taxes, or working capital movements like growing receivables and inventory — that haven't yet shown up as actual cash the business generated. In GeminIQ's data, Honeywell shows one of the largest current gaps: $8.2 billion in net income against $5.1 billion in operating cash flow.
Is a gap between net income and operating cash flow always a red flag?
Not automatically. It's a prompt to check what's driving the divergence — non-cash items and normal working capital timing produce small, stable gaps at most mature businesses, while a large or widening gap, especially at a company still early in a turnaround narrative, is worth tracking more closely.
How is this gap calculated?
It's trailing-twelve-months net income minus trailing-twelve-months operating cash flow, both read directly from as-filed data on GeminIQ's Financial Statements view.
Wall Street's data. Main Street's price.
Institutional terminals charge thousands a year for as-filed accuracy. GeminIQ gives you the same thing for a fraction of the cost: financials built directly from raw SEC EDGAR filings, not third-party APIs, with full XBRL traceability back to the original 10-K or 10-Q. No normalized guesswork, just calculated metrics, charts, screeners, and watchlists built on numbers exactly as the company reported them. Start researching now at GeminIQ.com.
Data Appendix: Universe drawn from GeminIQ's as-filed Financial Statements data, restricted to non-financial companies with over $1 billion in trailing revenue, positive net income above $100 million, positive operating cash flow, and a net margin under 40%, current as of the most recent trailing-twelve-month filing period within the last fifteen months, built from as-filed 10-K and 10-Q data publicly available on SEC EDGAR. Methodology: How GeminIQ Builds Filing Data Studies.
Disclaimer: The content in this blog is for educational and entertainment purposes only and does not constitute financial, legal, or tax advice. Investing involves risk, including the loss of principal. The views expressed are my own and not intended as financial advice or a guarantee of future performance.