
When XBRL Tags Change Between Filing Years

By Chad Hartman
Published · Last updated
Microsoft's own FY2017 10-K carries a line item labeled "Total Revenues," tagged with the standard us-gaap:Revenues element, showing $57.19 billion for the fiscal year. Microsoft's actual total revenue for that year, reported everywhere else in the same filing and confirmed by every contemporary press account, was $89.95 billion. The gap isn't a typo, a restatement, or a filer error the SEC ever flagged. It's product revenue — one of two components that make up the real total — sitting under the tag that's supposed to mean the whole company.
What makes this dangerous is that the wrong number carries every mark of a right one. The four quarters tagged the same way across fiscal 2017 sum to the annual figure to the dollar, and nothing about the filing fails to foot. A screener pulling Revenues by tag alone gets a number that's internally consistent, cleanly traceable to a real filing, and still describes something other than what its label says.
Table of Contents
- The Setup: A Tag That Looks Fine From the Outside
- What Microsoft's FY2017 "Revenues" Tag Actually Shows
- The Checks That Catch It, and the Ones That Don't
- How Far the Error Travels: A 109% Gross Margin
- How Often This Actually Happens
- Verifying the Numbers Yourself
- Why As-Filed Traceability Is the Only Real Defense
- Frequently Asked Questions
- Related Reading
The Setup: A Tag That Looks Fine From the Outside
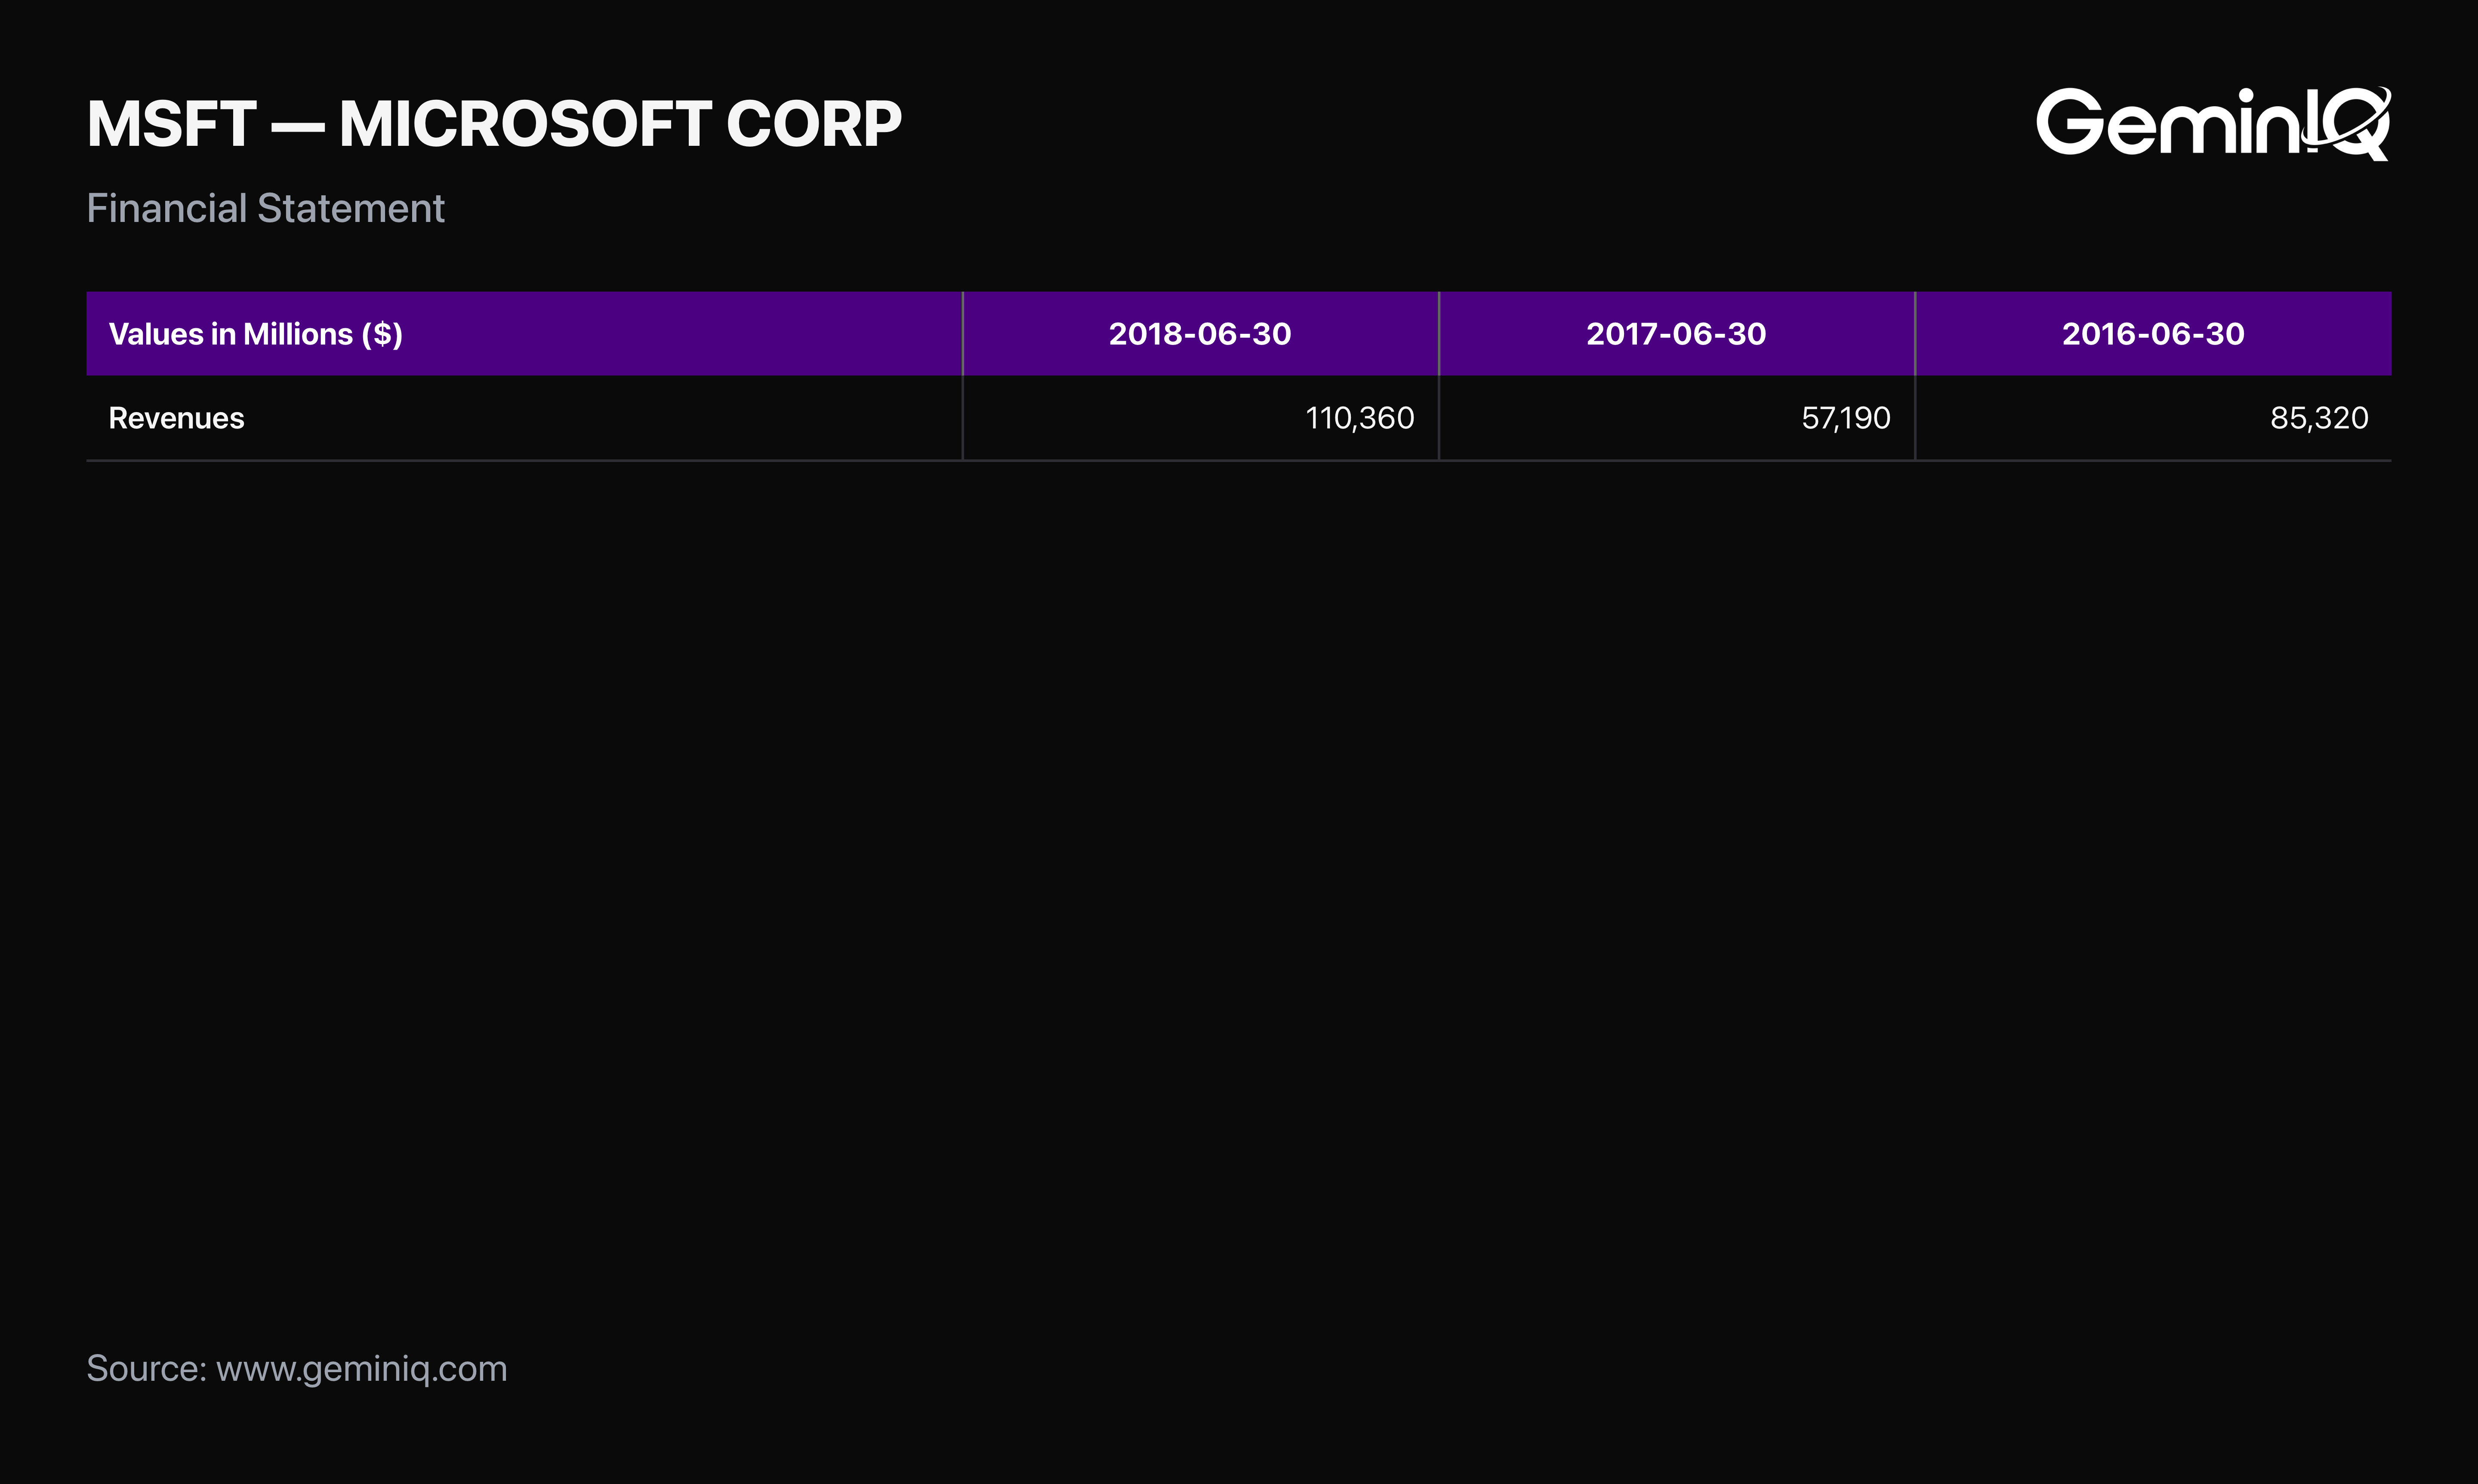
Every quarter, GeminIQ's pipeline reads the tag column directly out of a company's XBRL submission — the same raw field this entire platform is built to preserve rather than normalize away. For Microsoft, pulling every value ever reported under the tag Revenues produces a clean, unbroken quarterly and annual series stretching back to 2009. Almost every one of those values matches Microsoft's own reported total revenue for the period. Fiscal 2016: $85.32 billion, matching the $85,320 million Microsoft reported. Fiscal 2018: $110.36 billion, matching the company's first year over $100 billion in revenue. Fiscal 2017, sitting directly between them, breaks the pattern.
What Microsoft's FY2017 "Revenues" Tag Actually Shows
Here is the Revenues tag's full fiscal 2017 series, exactly as filed:
| Period | Filing | Accession Number | Revenues Tag Value |
|---|---|---|---|
| Q1 FY2017 (end 2016-09-30) | 10-Q | 0001193125-16-742796 | $14.968 billion |
| Q2 FY2017 (end 2016-12-31) | 10-Q | 0001564590-17-000654 | $18.273 billion |
| Q3 FY2017 (end 2017-03-31) | 10-Q | 0001564590-17-007547 | $14.513 billion |
| FY2017 (end 2017-06-30) | 10-K | 0001564590-17-014900 | $57.190 billion |
The four quarters sum to exactly $57.19 billion, matching the annual figure to the dollar — a filing that foots perfectly. The same 10-K's income statement also carries a second revenue line, tagged Sales Revenue Services And Other Net and labeled "Service and Other," showing $32.76 billion for the year. Add the two together — $57.19 billion plus $32.76 billion — and the result is $89.95 billion, exactly matching Microsoft's real, reported total revenue for fiscal 2017, disclosed in the same 10-K's segment footnote.
The Revenues tag, in other words, wasn't tagging total revenue in fiscal 2017. It was tagging Product revenue — one of the two lines a reader is supposed to add together to get the number the tag's own label claims to already be.
The Checks That Catch It, and the Ones That Don't
This is worth being precise about, because "passes every check" is a claim that only holds for certain checks. The filing passes EDGAR's structural validation — the calculation linkbase Microsoft submitted ties out, because whatever relationship it declares between quarters and the annual total, both sides used the same (mistagged) figure consistently. It passes a naive quarterly-footing test, the kind a script would run to confirm Q1+Q2+Q3+Q4 equals the reported FY figure, because that's arithmetically true regardless of what the tag actually represents. Neither check has any way to know what a number is supposed to mean. They only confirm the numbers already in the filing agree with each other.
What it does not pass is a domain-aware sanity check applied to anything downstream of revenue. That's the part worth walking through directly, because it's exactly the layer most raw-XBRL pipelines skip.
How Far the Error Travels: A 109% Gross Margin
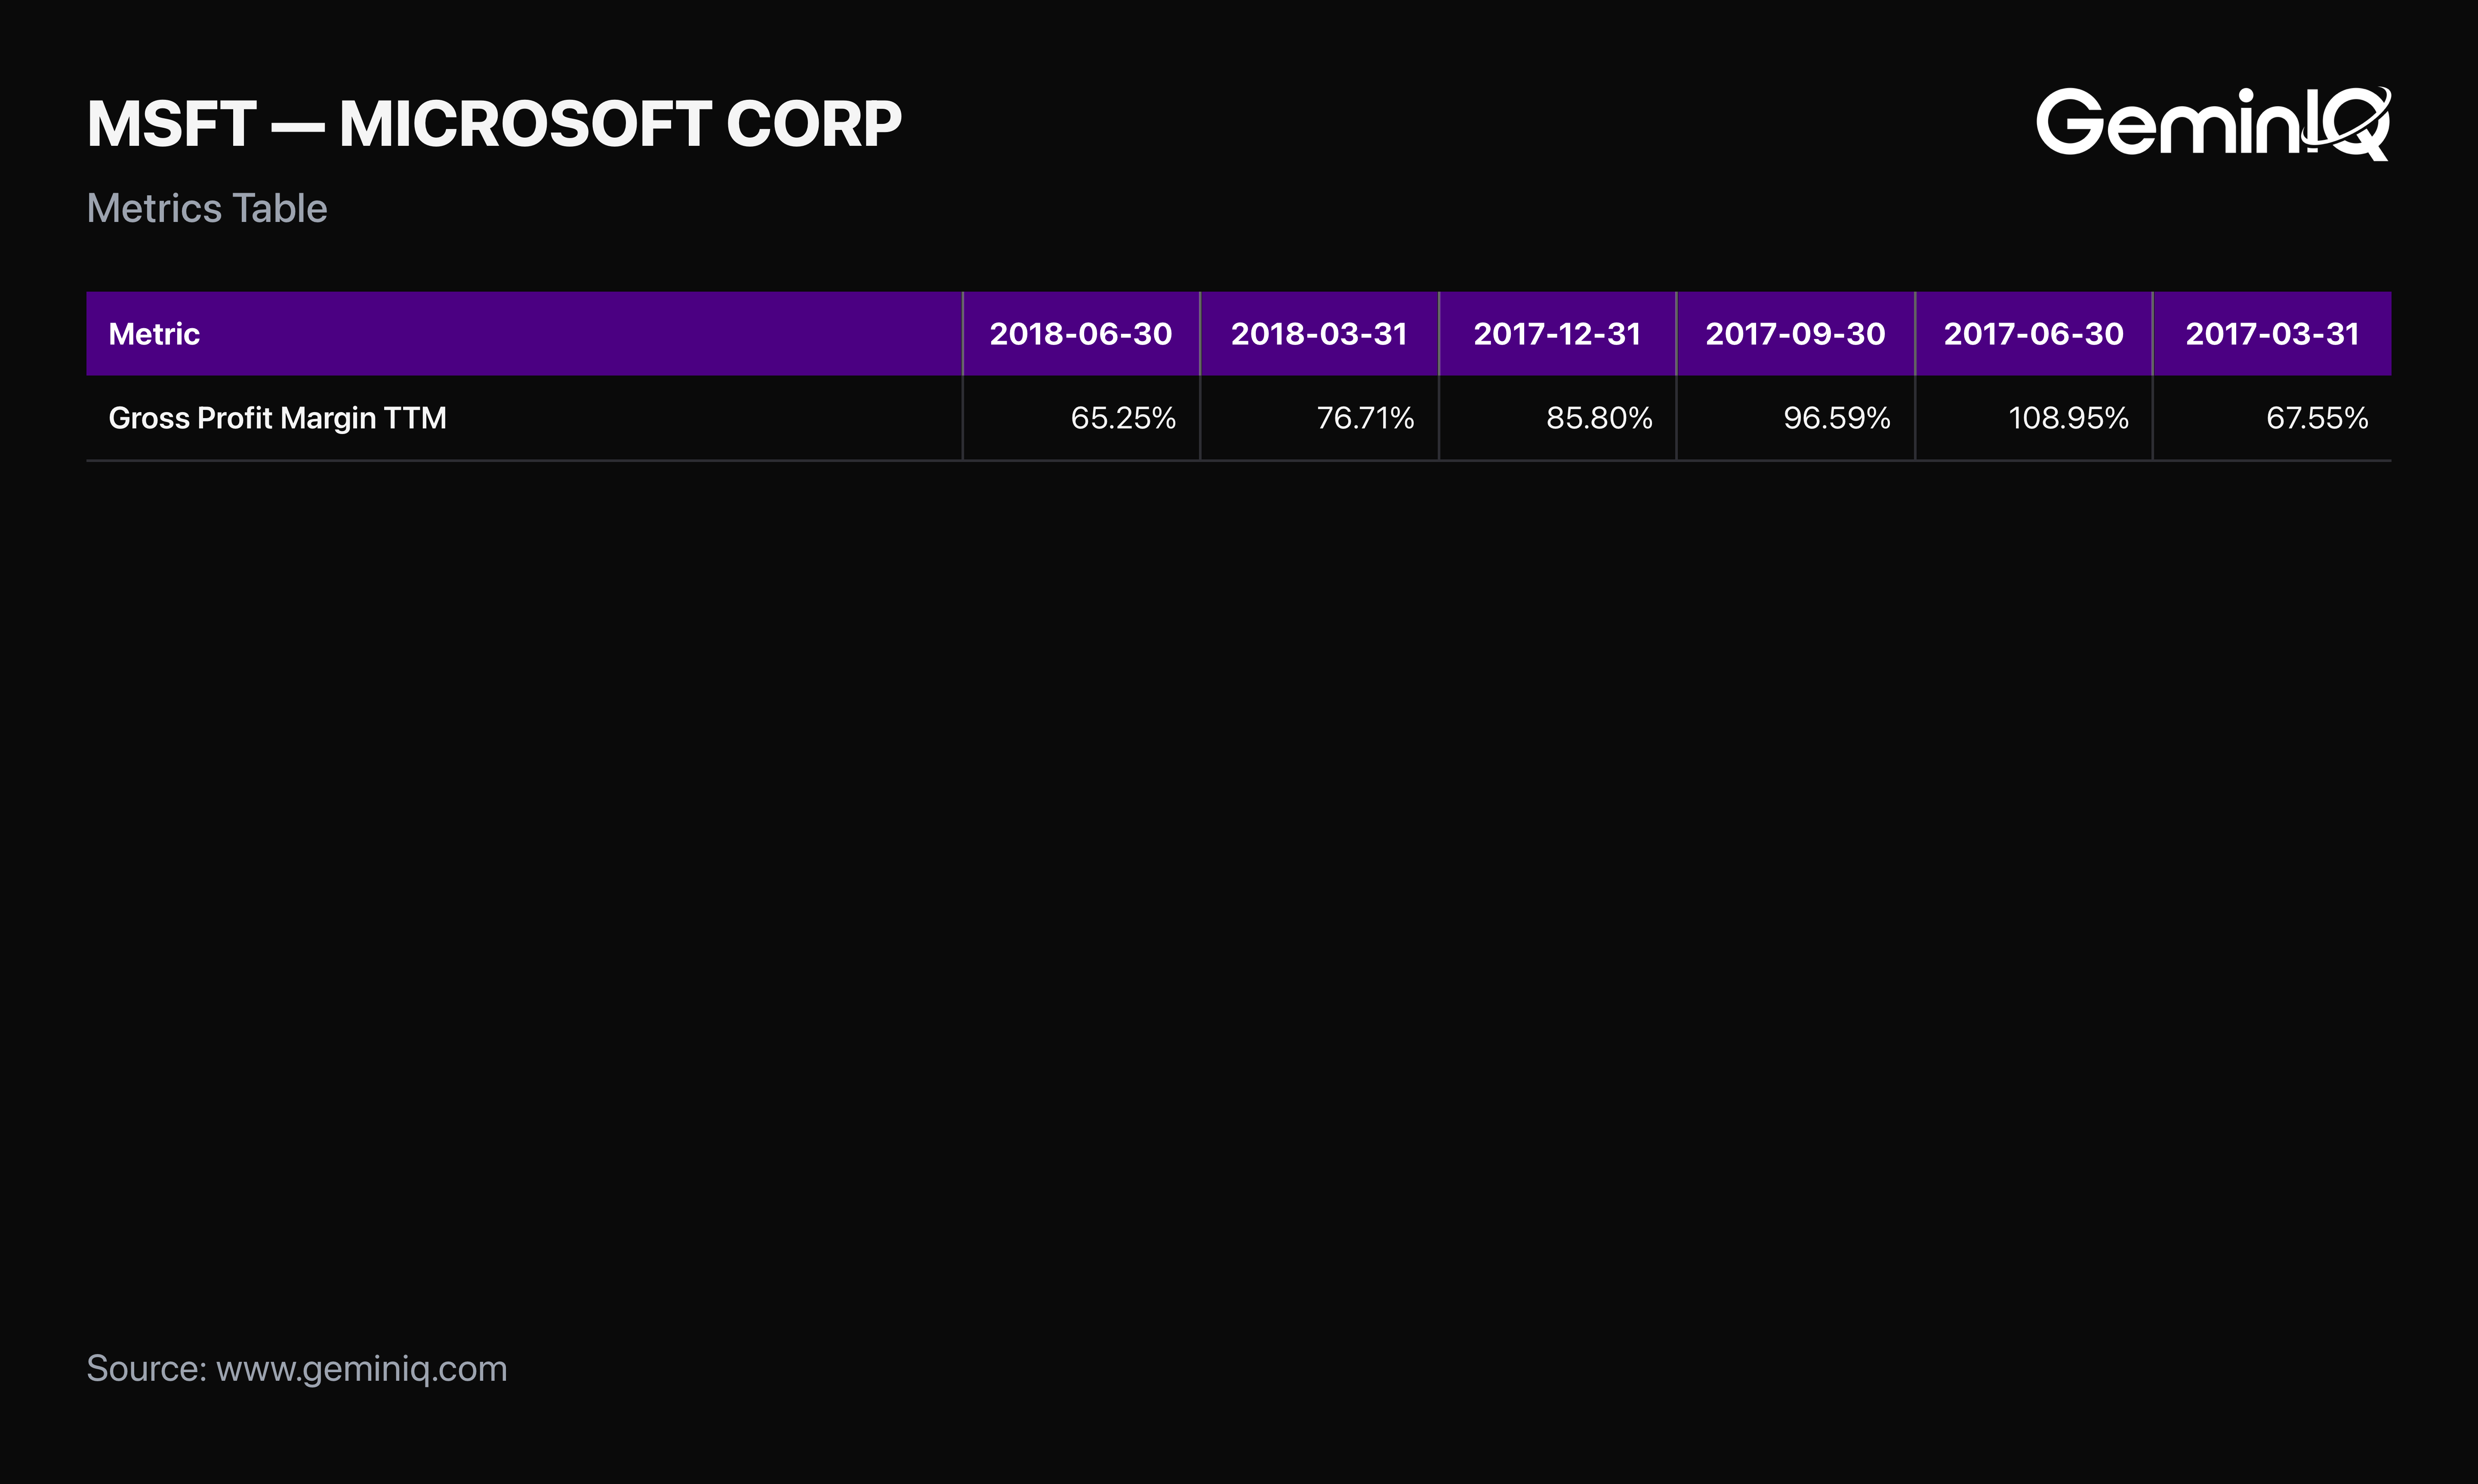
GeminIQ's own trailing-twelve-month metrics for Microsoft show precisely what happens when this figure feeds into a calculation without a sanity check catching it first. For the trailing twelve months ending June 30, 2017 — the exact window built entirely from the four mistagged quarters above — the calculated Gross Profit Margin comes out to 108.95%.
A gross margin above 100% is not a rounding artifact or an edge case. It states that the cost of the goods and services sold was negative, which is not something that happens in Microsoft's actual business. The same trailing-twelve-month window also shows a net profit margin of 44.57% and an operating margin of 50.75% — both roughly double Microsoft's real fiscal 2017 margins. The denominator (revenue) had been cut by 36% while the correctly-tagged profit figures were divided against it. The distortion doesn't stay contained to the one quarter carrying the bad annual figure, either. A trailing-twelve-month window doesn't fully "age out" a bad quarter until four quarters later, so the calculated revenue growth rate for that same period shows a false -32.97% decline that never happened.
Every one of these calculated figures is arithmetically correct given its inputs. The math isn't broken. The input is.
How Often This Actually Happens
Microsoft's case is unusually easy to catch after the fact, precisely because the downstream math is so obviously wrong — a margin over 100% is hard to miss once you're looking for it. The obvious follow-up question is how much of a typical filing sits outside the standard vocabulary in the first place, and the SEC measures one part of that directly.
The SEC's own Division of Economic and Risk Analysis (DERA) publishes a running trend analysis of custom tag rates in 10-K filings going back to fiscal year 2012 — custom tags being elements a filer defines itself when no standard element fits. DERA's staff observations put the average custom-tag rate at 17% across U.S. GAAP filers in 2019, rising to 20% in 2020, before reversing, with custom tag usage declining across most filer categories in the years since. Even at the low end of that range, roughly one in every five to six line items requiring a tag on a typical 10-K's financial statements is filed under a tag that exists nowhere outside that one company's own extension taxonomy.
That rate isn't distributed evenly. DERA's analysis breaks custom-tag usage out by filer status — large accelerated, accelerated, non-accelerated, and smaller reporting companies — and the pattern holds across nearly every year measured: smaller filers, with less XBRL tagging infrastructure and fewer specialized accounting staff, consistently run a higher custom-tag rate than large accelerated filers. A custom tag is a different failure mode from Microsoft's — it's a nonstandard element carrying the right number, rather than a standard element carrying the wrong one — but it's the one the agency quantifies, and it sets the floor for how much of any given filing a standard-tag query never sees.
There is also evidence that heavy custom tagging is not a neutral stylistic choice. A 2025 study in the International Journal of Accounting Information Systems found that firms with weak internal controls are more likely to create custom tags in their 10-K filings, and documented a positive association between excessive custom-tag usage and SEC oversight — specifically, a higher likelihood of receiving a comment letter. Firms reduced their custom-tag usage after SEC review. The rate is not just a data-quality statistic; it correlates with the control environment behind the filing.
Mistagging itself doesn't get published as a rate, only as individual cases. In August 2019, the SEC sent Compass Diversified Holdings a comment letter identifying that the company had tagged its total net deferred tax liability with Deferred Tax Assets Liabilities Net — a specific, wrong element. It was caught only because SEC staff reviewed the filing directly and requested the correct tag going forward. And the SEC's own September 2023 sample comment letter on XBRL disclosures names "inconsistent element selection across reporting periods" as a standing category of comment it issues. That's the agency's own acknowledgment, in an official published template, that companies routinely tag the same reported line item with different elements from one period to the next — with no guarantee any downstream number built on the assumption of consistency gets flagged before it's published.
Verifying the Numbers Yourself
Every figure above traces to a specific accession number, which means none of it requires taking this article's word for it. Pull the FY2017 10-K's filing index page for accession 0001564590-17-014900, open the primary document, and the "Total Revenues" line under the income statement reads $57,190 million — Microsoft's own filed number, not a transcription. The segment footnote a few pages later reports total revenue of $89,950 million for the same fiscal year, in the same document. Both numbers are real; only one of them is what the Revenues tag actually captured.
Why As-Filed Traceability Is the Only Real Defense
There is no tagging rule this filing violated, which is exactly why the SEC's automated validation let it through and no subsequent comment letter corrected it. Microsoft simply presented Product and Service revenue as two separate lines in fiscal 2017 — a legitimate presentation choice, and one made independently of the annual taxonomy revision that accounts for most tag changes between filing years. Nothing outside this one filer's own presentation produced the gap.
GeminIQ's response to this isn't a rule that catches every case like it. It's that every figure on the platform carries its own accession number and tag value back to the specific filing it came from, the same traceability this entire investigation ran on. A number that looks wrong on GeminIQ can be checked against the identical filing in minutes, using nothing more than the accession number and the tag it was pulled from. A number that's been silently normalized by an aggregator that discards the source tag offers no equivalent path back — the error, if one exists, is simply invisible. How that as-filed default compares to other filing-derived platforms is laid out in our ROIC.ai comparison.
Frequently Asked Questions
Was Microsoft's FY2017 10-K itself wrong?
Not necessarily. Microsoft's own filed numbers — both the $57.19 billion Product-revenue figure and the $89.95 billion total disclosed in the segment footnote — are accurate and consistent with each other. The issue is which XBRL context gets treated as the entity-level default for the Revenues tag, not an error in what Microsoft reported.
How can a tag pass validation and still be wrong?
EDGAR's validation checks whether the numbers within a filing are internally consistent — whether a calculation linkbase ties out, whether quarters sum to the stated annual figure. None of those checks know what a tag is supposed to represent in the real world; they only confirm the filing agrees with itself.
Does this only affect revenue tags?
No. The same underlying mechanism — a standard tag capturing one component of a multi-part disclosure rather than the consolidated total — can affect any line item a company breaks into sub-categories, including cost of revenue, which Microsoft's own FY2017 10-K also splits into Product and Service and Other components under the same pattern.
How would an investor catch this without cross-checking every tag manually?
A margin, ratio, or growth rate that falls outside a plausible range — a gross margin above 100%, a growth rate that contradicts every other public account of the period — is usually the first visible symptom, even when the root cause is a single mistagged line several calculation steps upstream.
The tag said "Total Revenues." For one fiscal year, out of Microsoft's entire public filing history, it wasn't. Knowing how to check is the only difference between catching that and reporting it as fact.
Related Reading
- EDGAR Accession Numbers and Filing URL Structure — how the accession numbers cited throughout this piece resolve to an exact filing.
- How to Pull SEC Financial Data With Python — the free API this same tag problem shows up in for anyone pulling raw XBRL directly.
- SEC XBRL Taxonomy Explained for Investors — why the vocabulary behind these tags changes at all, and what providers do about it.
- What Is XBRL and Why Does It Matter for Investors? — the underlying tagging standard this entire investigation depends on.
- Verify Financial Data Against the Original SEC Filing — the general version of the check run against Microsoft here.
Wall Street's data. Main Street's price.
Institutional terminals charge thousands a year for as-filed accuracy. GeminIQ gives you the same thing for a fraction of the cost: financials built directly from raw SEC EDGAR filings, not third-party APIs, with full XBRL traceability back to the original 10-K or 10-Q. No normalized guesswork, just calculated metrics, charts, screeners, and watchlists built on numbers exactly as the company reported them. Start researching now at GeminIQ.com.
Custom-tag rates and the filer-status breakdown are drawn from the SEC Division of Economic and Risk Analysis (DERA) staff trend analysis of custom tag usage, published at U.S. GAAP — XBRL Custom Tags Trend; the fiscal 2018–2020 figures are from the SEC's August 2021 trend announcement. The internal-controls and SEC-oversight findings are from Daeun (Philip) Lee and Joung W. Kim, "Excessive Custom XBRL Tag Usage in 10-K Filings and SEC Oversight," International Journal of Accounting Information Systems, Vol. 56 (2025), SSRN 5186126. The Compass Diversified Holdings comment letter (August 2019) and the SEC's September 2023 sample comment letter on XBRL disclosures are published on SEC.gov.
All financial figures cited in this article reference Microsoft Corporation's FY2017 Annual Report (10-K filed August 2, 2017, period ending June 30, 2017). All SEC filings are publicly available at SEC EDGAR.
Disclaimer: The content in this blog is for educational and entertainment purposes only and does not constitute financial, legal, or tax advice. Investing involves risk, including the loss of principal. The views expressed are my own and not intended as financial advice or a guarantee of future performance.