
Apple Stock Analysis (2026): Is It Still a Value Play or a Yield Trap?

By Chad Hartman
Published · Last updated
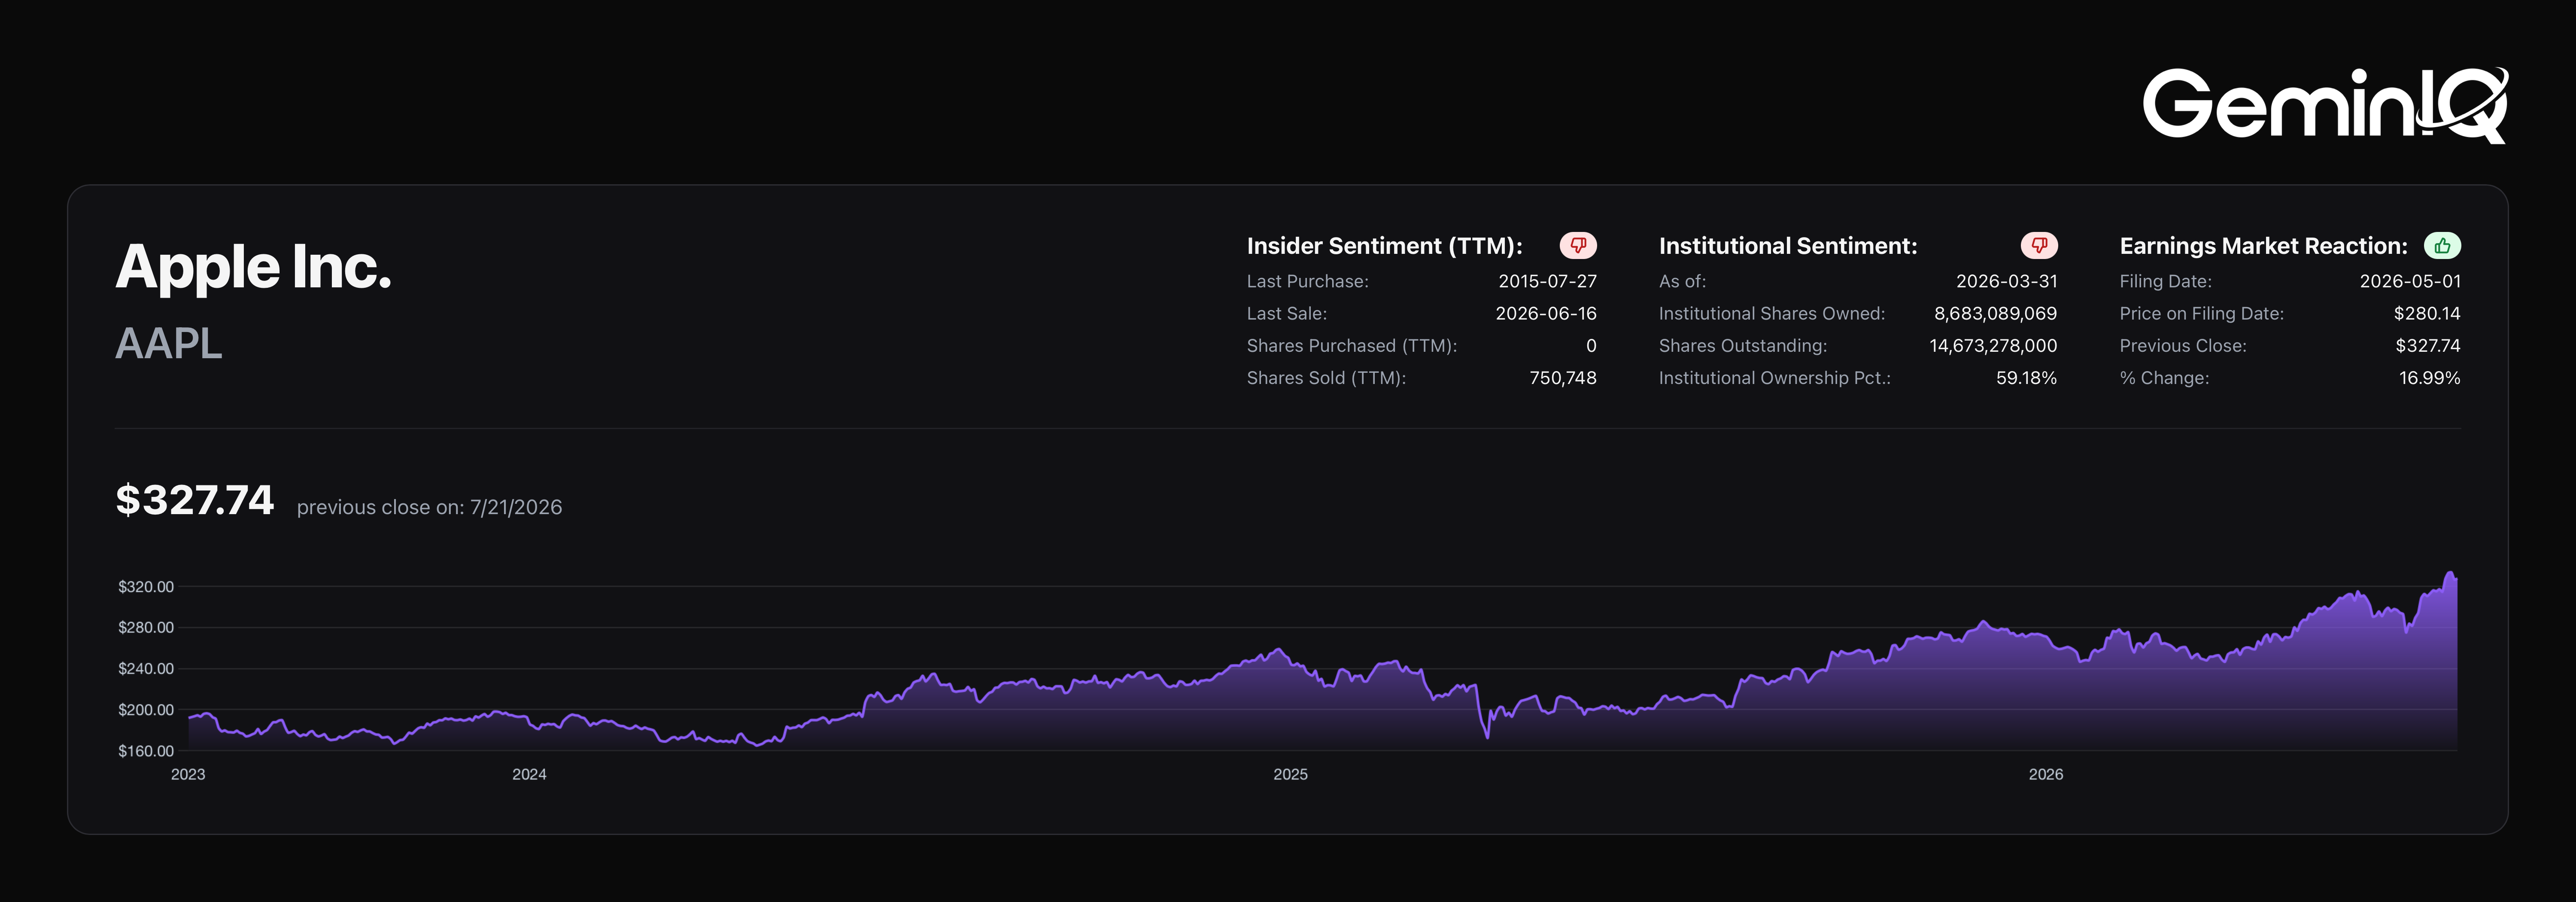
Apple ($AAPL) just dropped its Q2 FY2026 10-Q (filed May 1, 2026). Most of the coverage is still arguing about iPhone units in China and whether a 30x multiple is too rich. The filing tells a different story: for the first time in years, Apple's retained earnings turned positive and its buyback pace visibly throttled back. The capital machine didn't slow down. It recalibrated — and almost nobody read the balance sheet closely enough to notice.
| Field | Value |
|---|---|
| Ticker | $AAPL |
| Filing | Q2 FY2026 10-Q |
| Filed | May 1, 2026 |
| Period End | March 28, 2026 |
| Retained Earnings (Accumulated Deficit) | $12.36 Billion |
| ROIC (TTM) | 81.7% |
The Retained Earnings Reversal
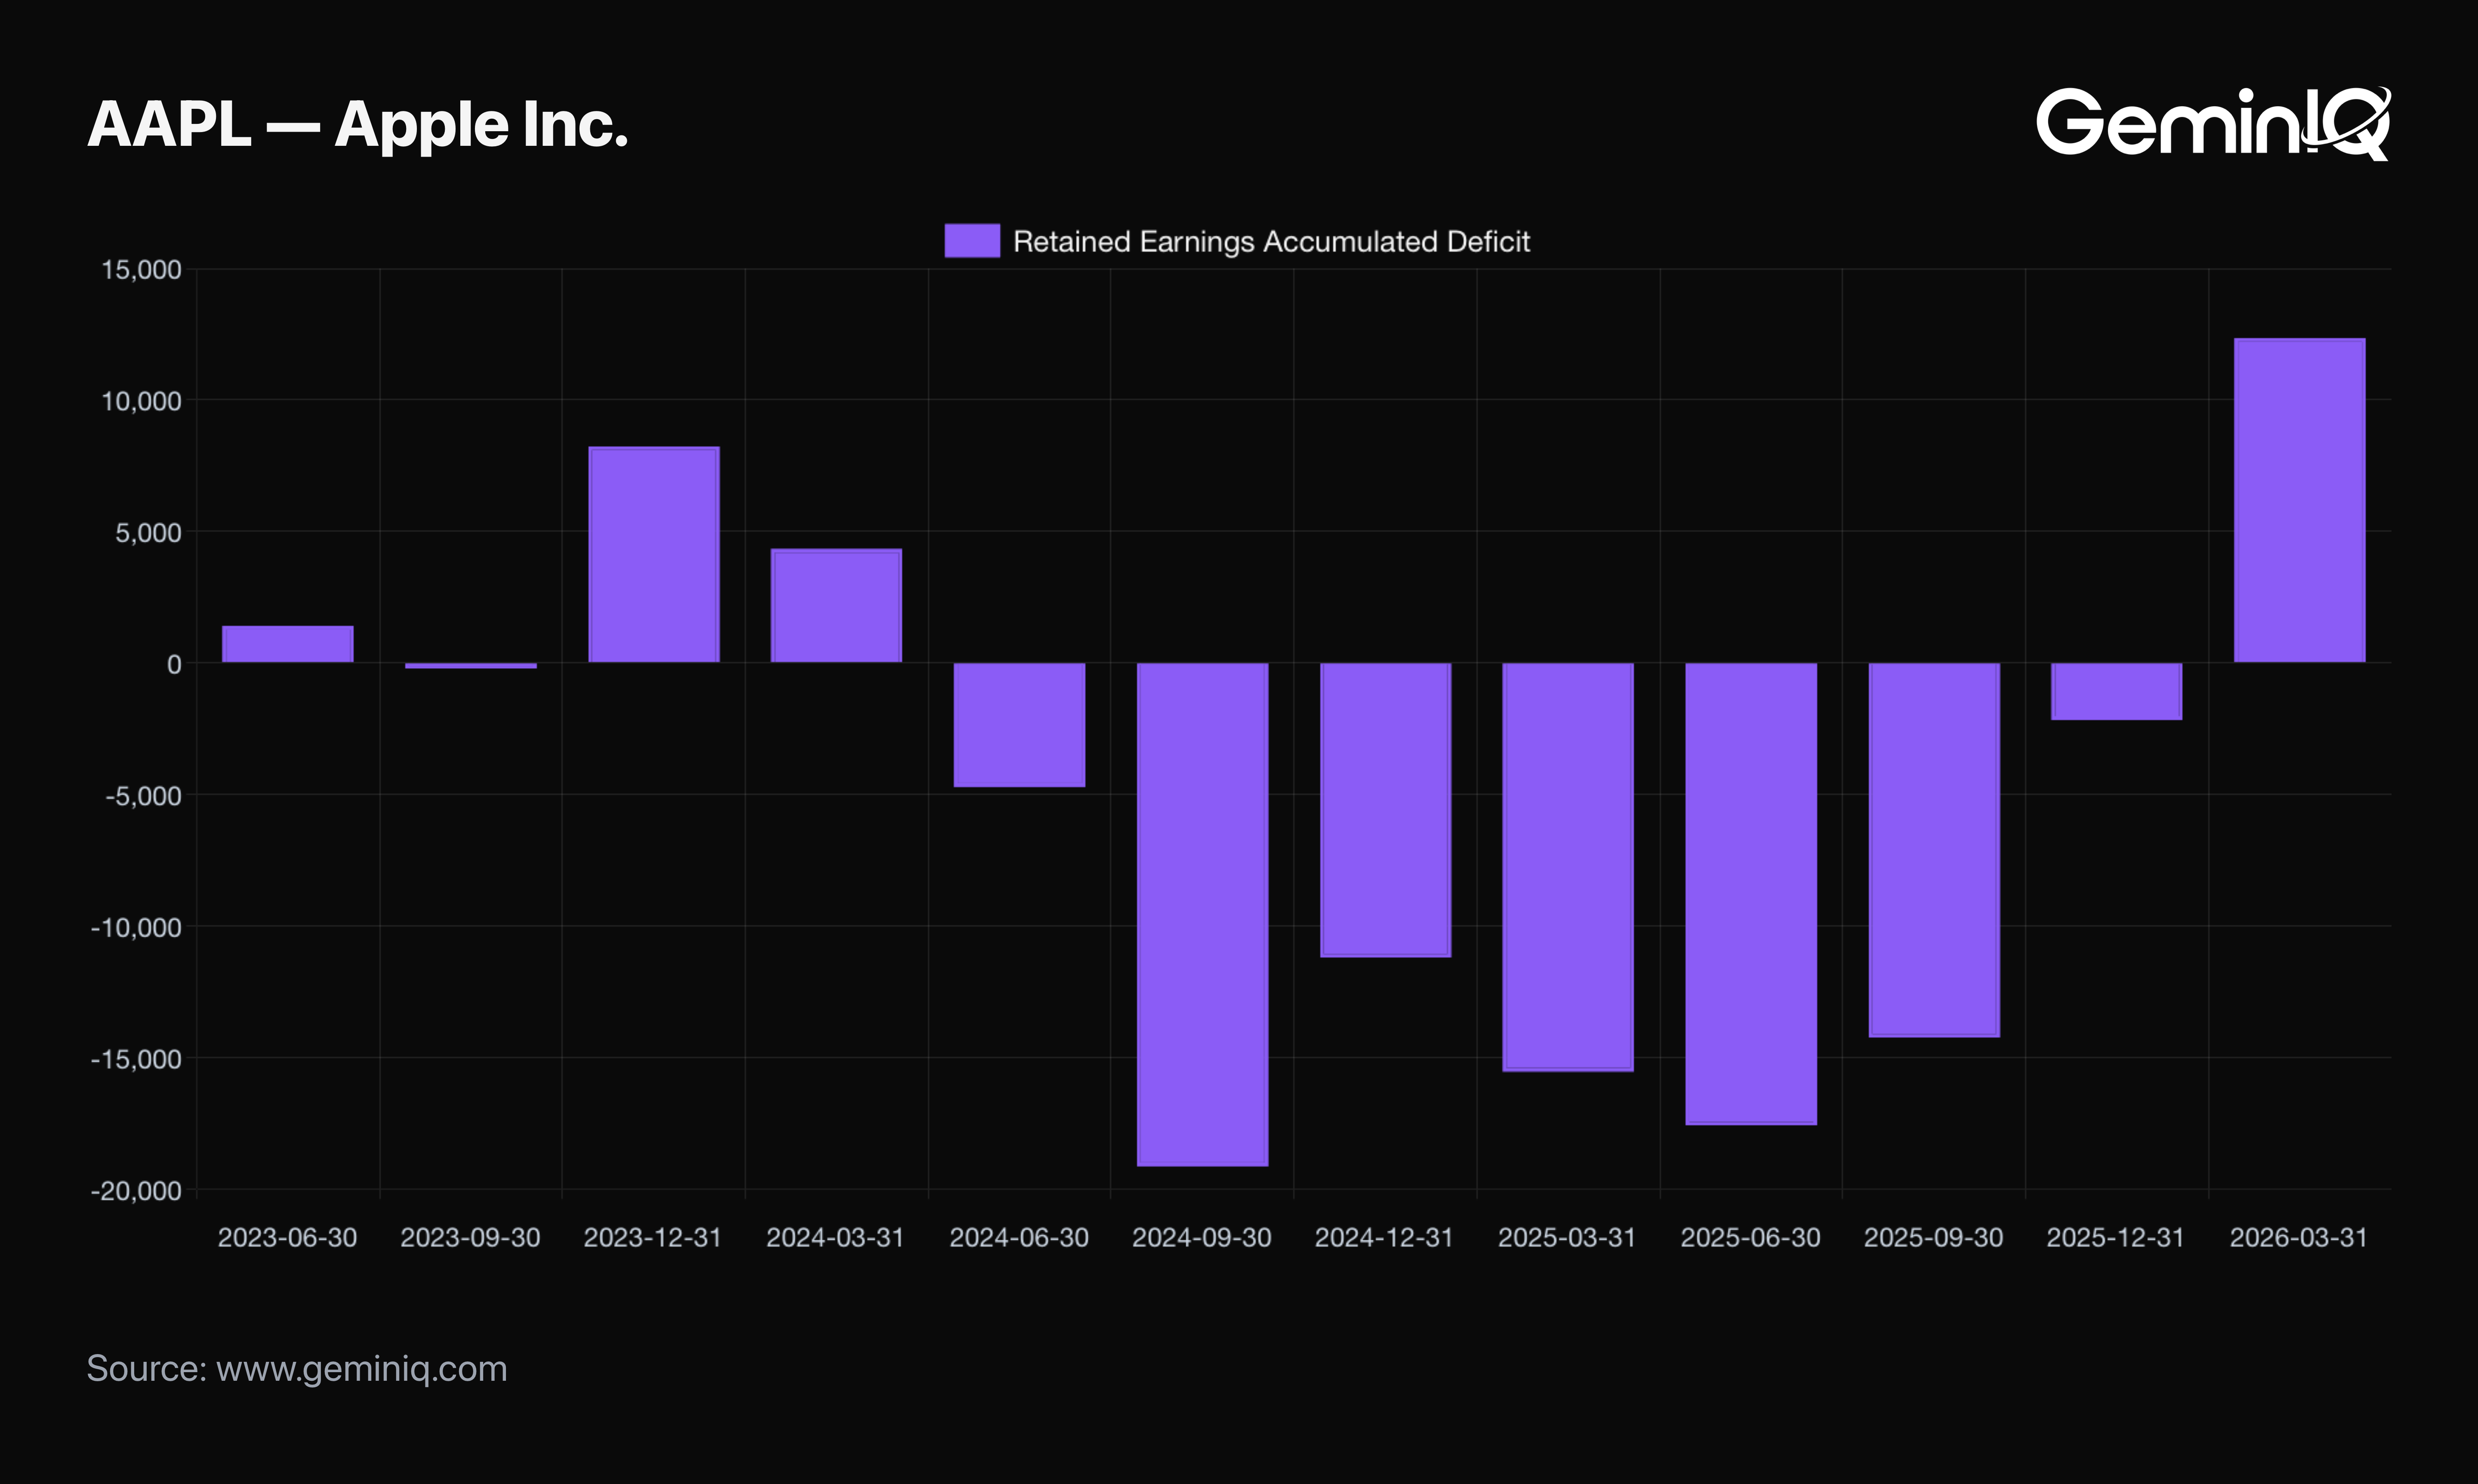
The accumulated deficit is gone. For the past several years, Apple's balance sheet carried a negative retained earnings figure — one most retail platforms flag as a red flag, but one that actually reflected a company returning more cash to shareholders than it technically "retained." As of this quarter, that number is positive again.
The Data: As of the Q1 FY2026 10-Q (period ending December 27, 2025), GeminIQ's Financial Statements showed Retained Earnings (Accumulated Deficit) at -$2.18 Billion. As of this quarter's 10-Q, that same line item reads $12.36 Billion — positive, for the first time since the deficit began widening. That is a swing of roughly $14.5 Billion in a single fiscal quarter.
The GeminIQ Edge: A screener that only flags "negative retained earnings" as a warning sign would have missed both the original bullish read on the deficit and this reversal entirely — it just sees a number cross zero. GeminIQ's Financial Statements pulls the actual accumulated deficit or surplus line straight from the filing — not inferred, not smoothed, tagged exactly as reported.
A Buyback Machine That Just Downshifted
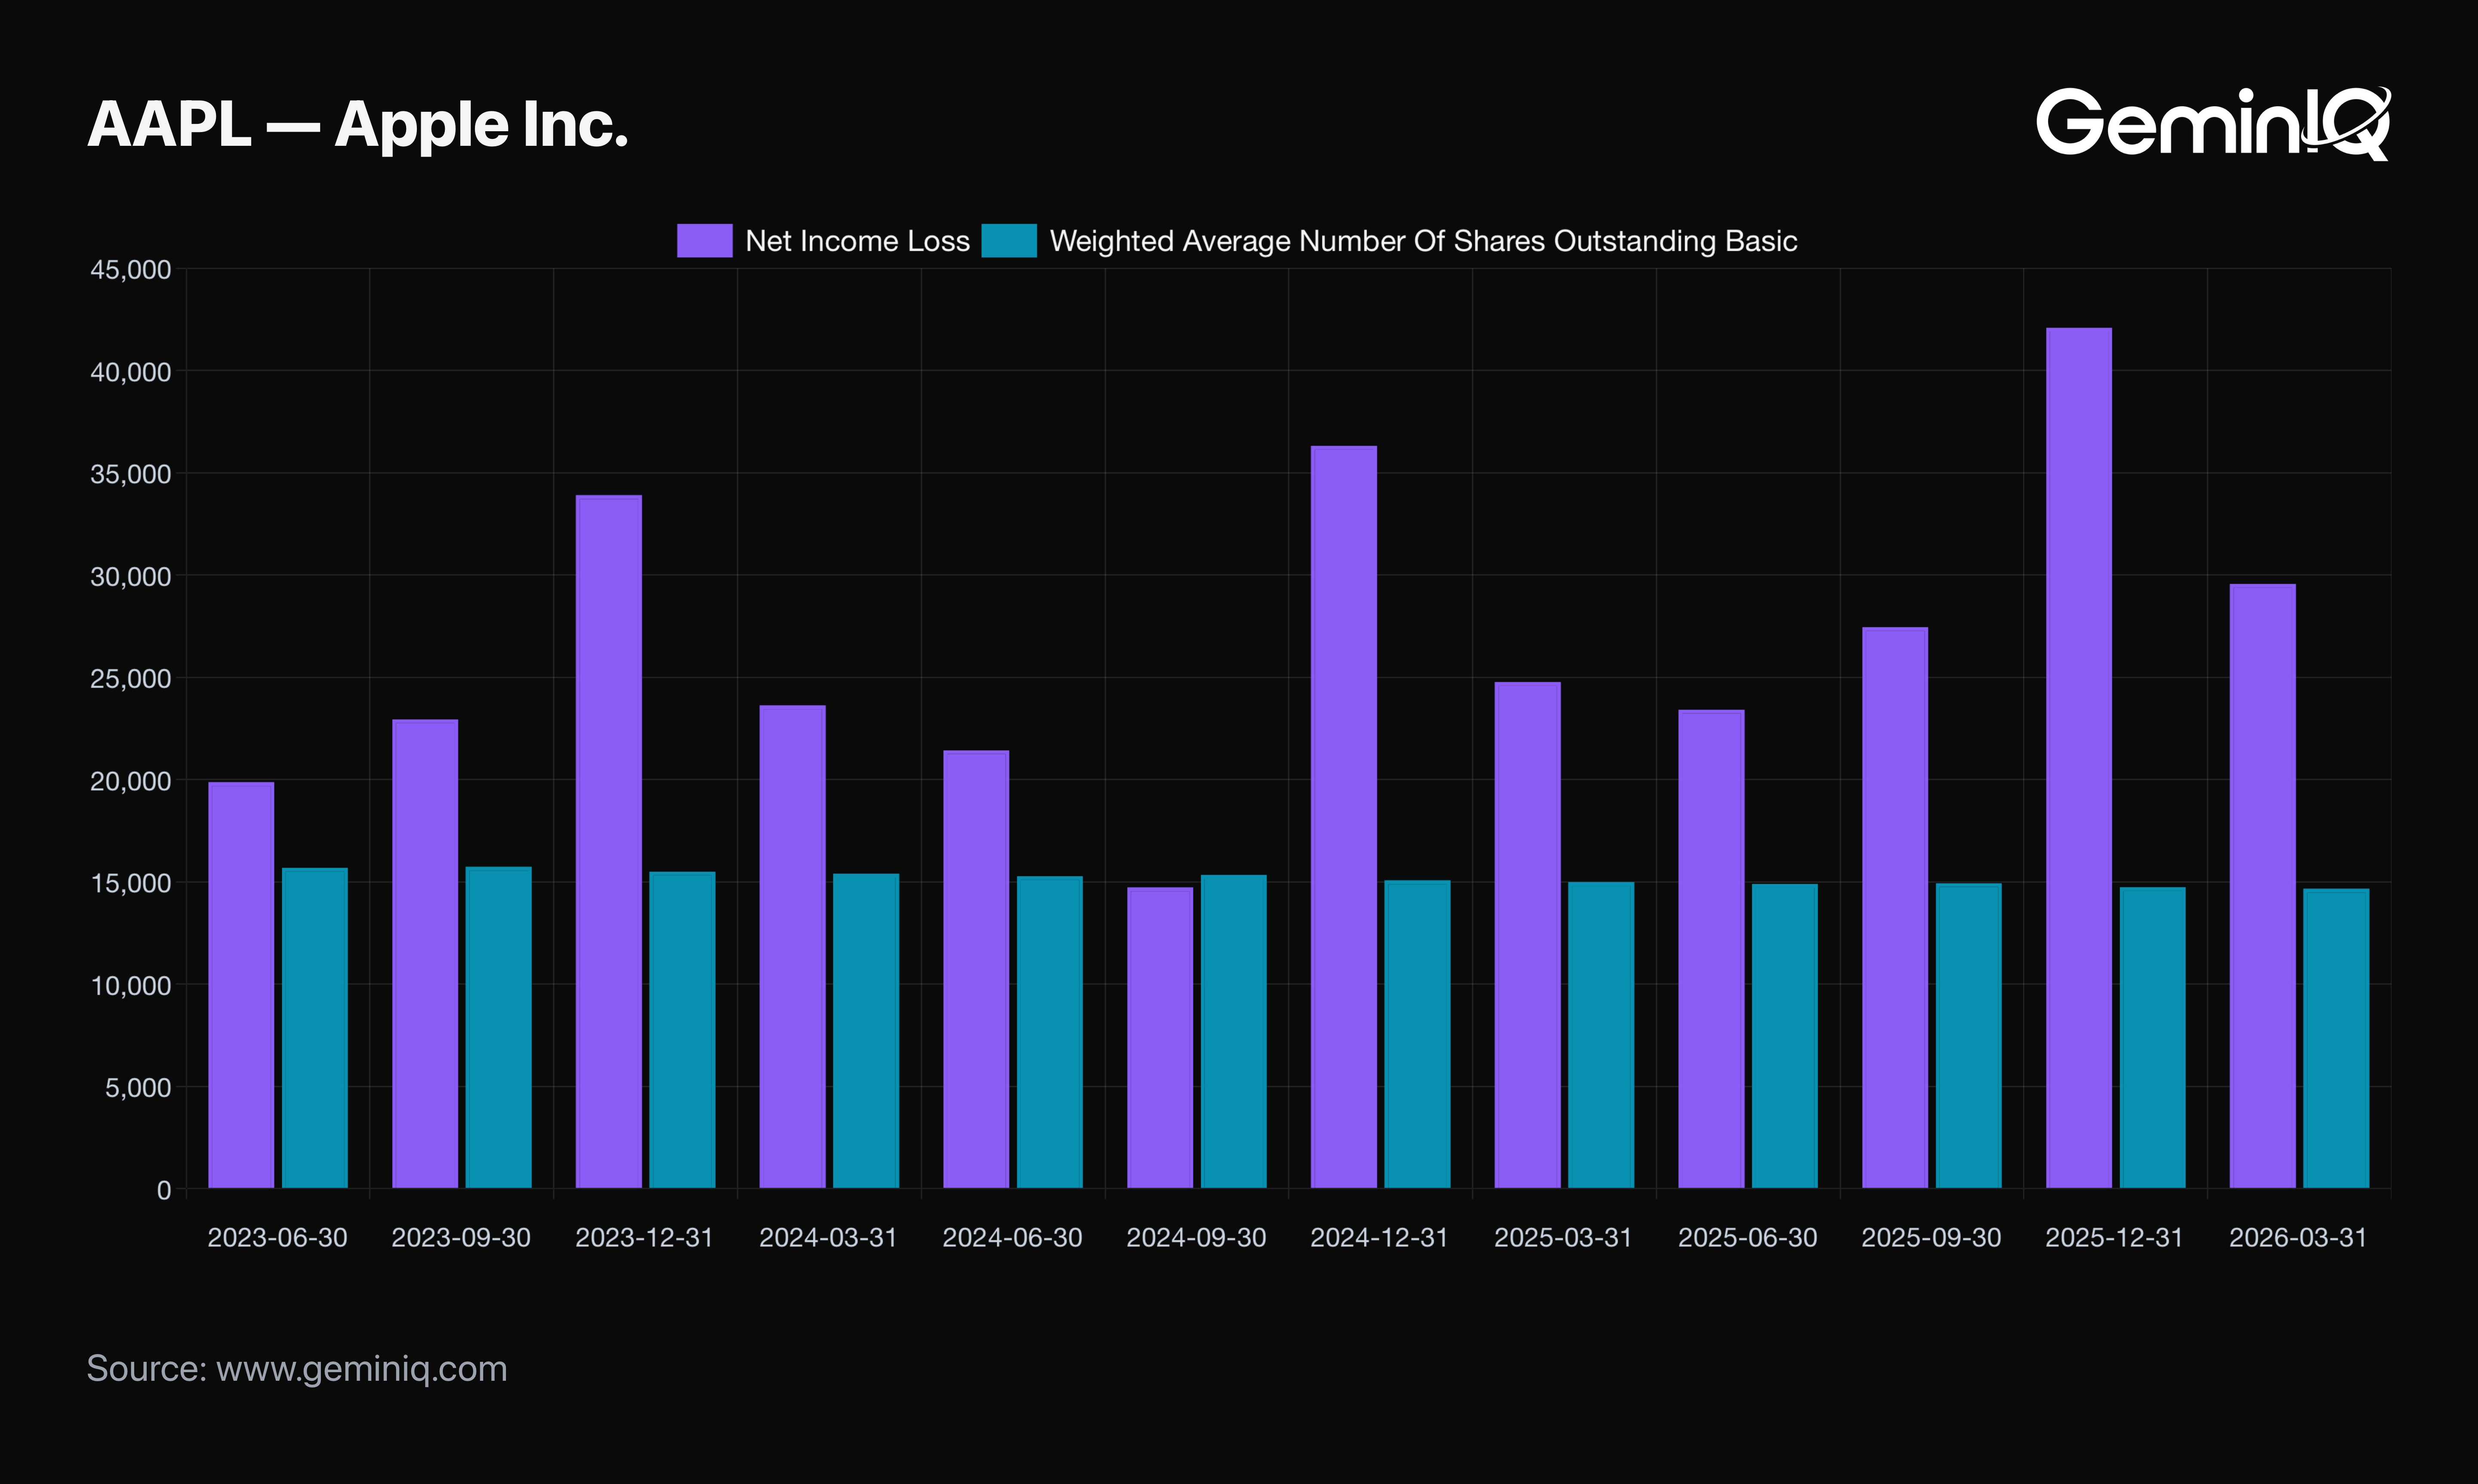
The obvious question is whether the reversal means Apple slowed its capital return program. The share count says yes — just not by as much as the headline number implies.
The Data: Basic shares outstanding fell by 200.3 million in the December quarter (Q1 FY2026) as Apple repurchased $24.7 Billion of stock in that period alone. In the March quarter (Q2 FY2026), the reduction was 74.9 million shares — a real deceleration in buyback-driven share retirement. At the same time, quarterly net income grew from $24.78 Billion (Q2 FY2025) to $29.58 Billion (Q2 FY2026), a 19.4% year-over-year increase.
The GeminIQ Edge: This is the mechanism behind the retained earnings flip: net income accelerated while the pace of capital return eased, and the gap between the two showed up directly on the balance sheet. GeminIQ's Financial Statements surfaces the raw quarterly share count and repurchase cash flow as filed, so the deceleration shows up in the actual quarterly numbers instead of disappearing into a trailing-twelve-month average.
Verifying the Moat: ROIC Still Elite, But Cooling
Return on Invested Capital is the number that actually tells you whether the capital machine is still working, independent of what's happening with buybacks in any given quarter.
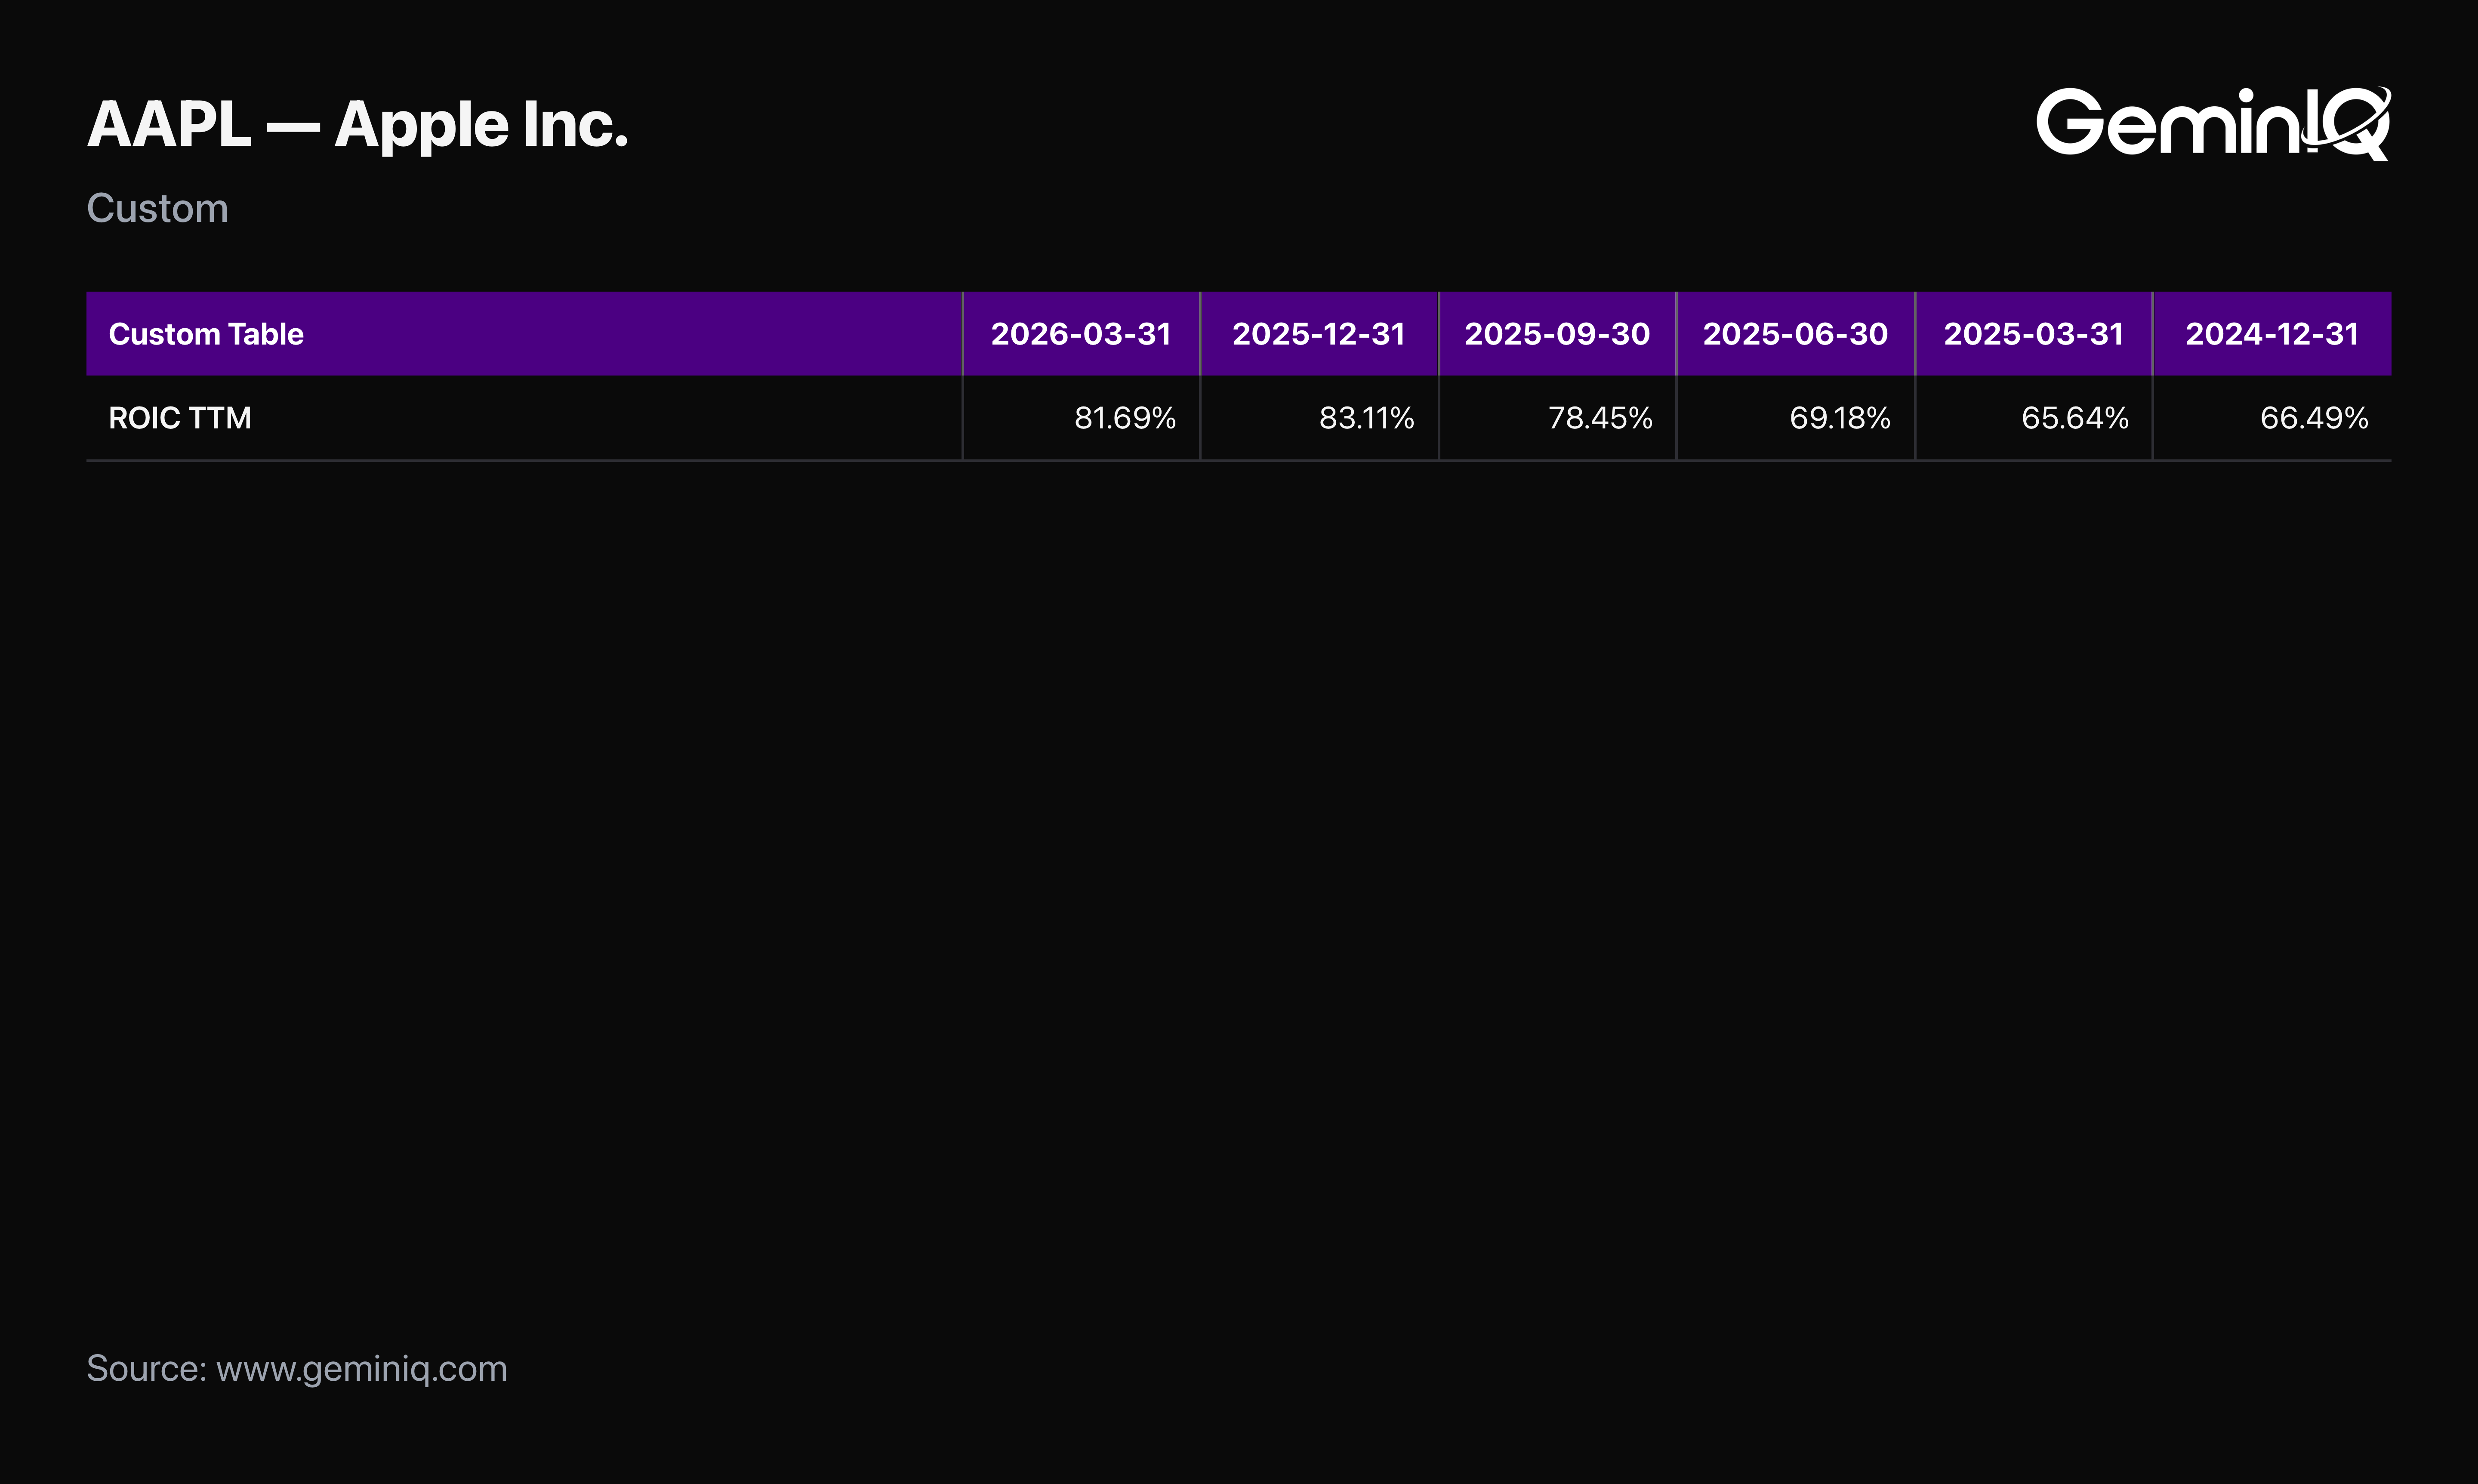
The Data: GeminIQ's pre-calculated ROIC (TTM) for Apple sits at 81.7% as of this filing, down from 83.1% last quarter. It is still an extreme figure for a company of this size — Apple is turning roughly $0.82 of after-tax operating profit for every dollar of invested capital — but the direction matters. This is the first time the trailing figure has ticked down after a run from 65.6% in the March 2025 quarter to a peak of 83.1% in December 2025. Gross margin (TTM) tells a different part of the story: it has expanded from 46.6% a year ago to 47.9% now, a steady mix-shift tailwind that has nothing to do with iPhone unit volumes.
The GeminIQ Edge: A single ROIC snapshot tells you the machine is elite. The trend, pulled quarter by quarter from GeminIQ's Calculated Metrics rather than a static ratio on a screener, tells you whether it's accelerating or normalizing — and right now it's normalizing off a genuine peak, not breaking down.
The Balance Sheet Behind the Capital Machine
None of the above matters if the balance sheet funding it is deteriorating. It isn't.
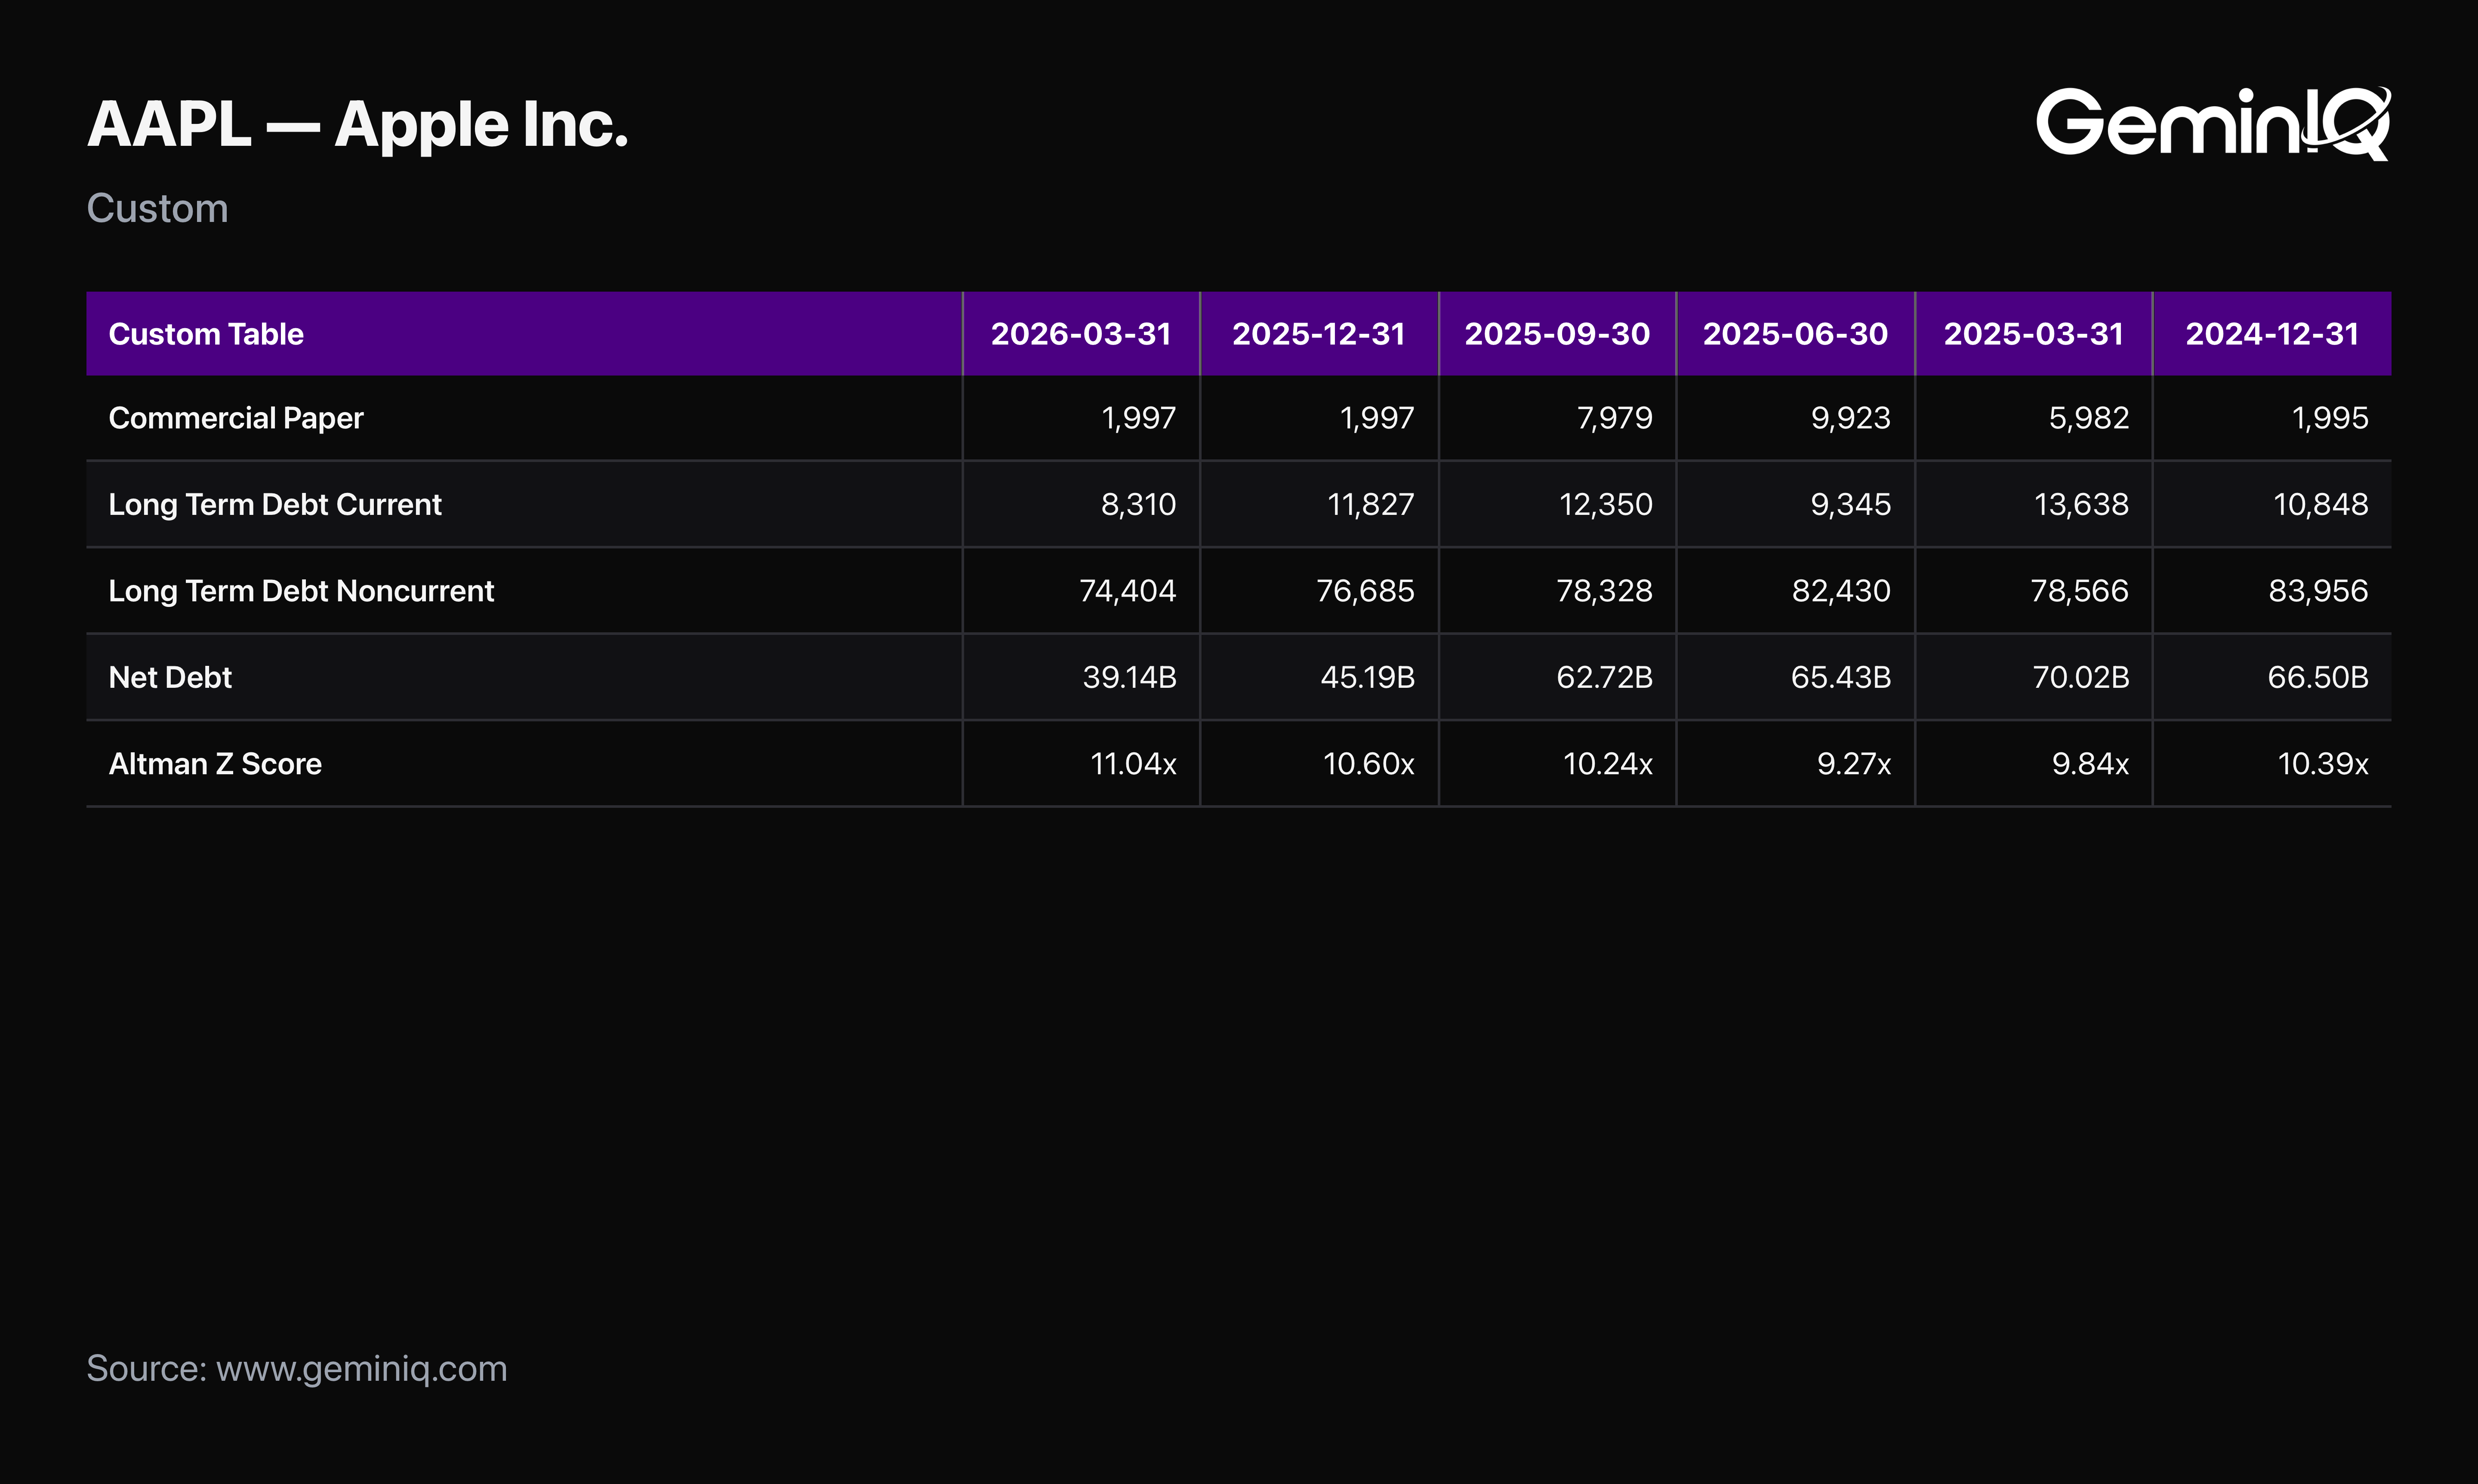
The Data: Apple carries $84.7 Billion in total debt against $45.6 Billion in cash, for a Net Debt of $39.1 Billion — down from $45.2 Billion last quarter. GeminIQ's Altman Z-Score for the period reads 11.04, up from 10.60 in the prior quarter, well into the "safe zone" territory the score is designed to flag.
The GeminIQ Edge: The total debt figure traces directly to two filed line items — Commercial Paper of $1.997 Billion and Term Debt (current and noncurrent combined) of $82.7 Billion — rather than a single aggregated "debt" figure that obscures which instruments make up the total. GeminIQ's Financial Statements keeps them separate, exactly as filed.
Is $AAPL Still Priced Like a Yield Trap?
A healthy balance sheet doesn't answer the question this post opened with. Forget the debate — here's the actual multiple.
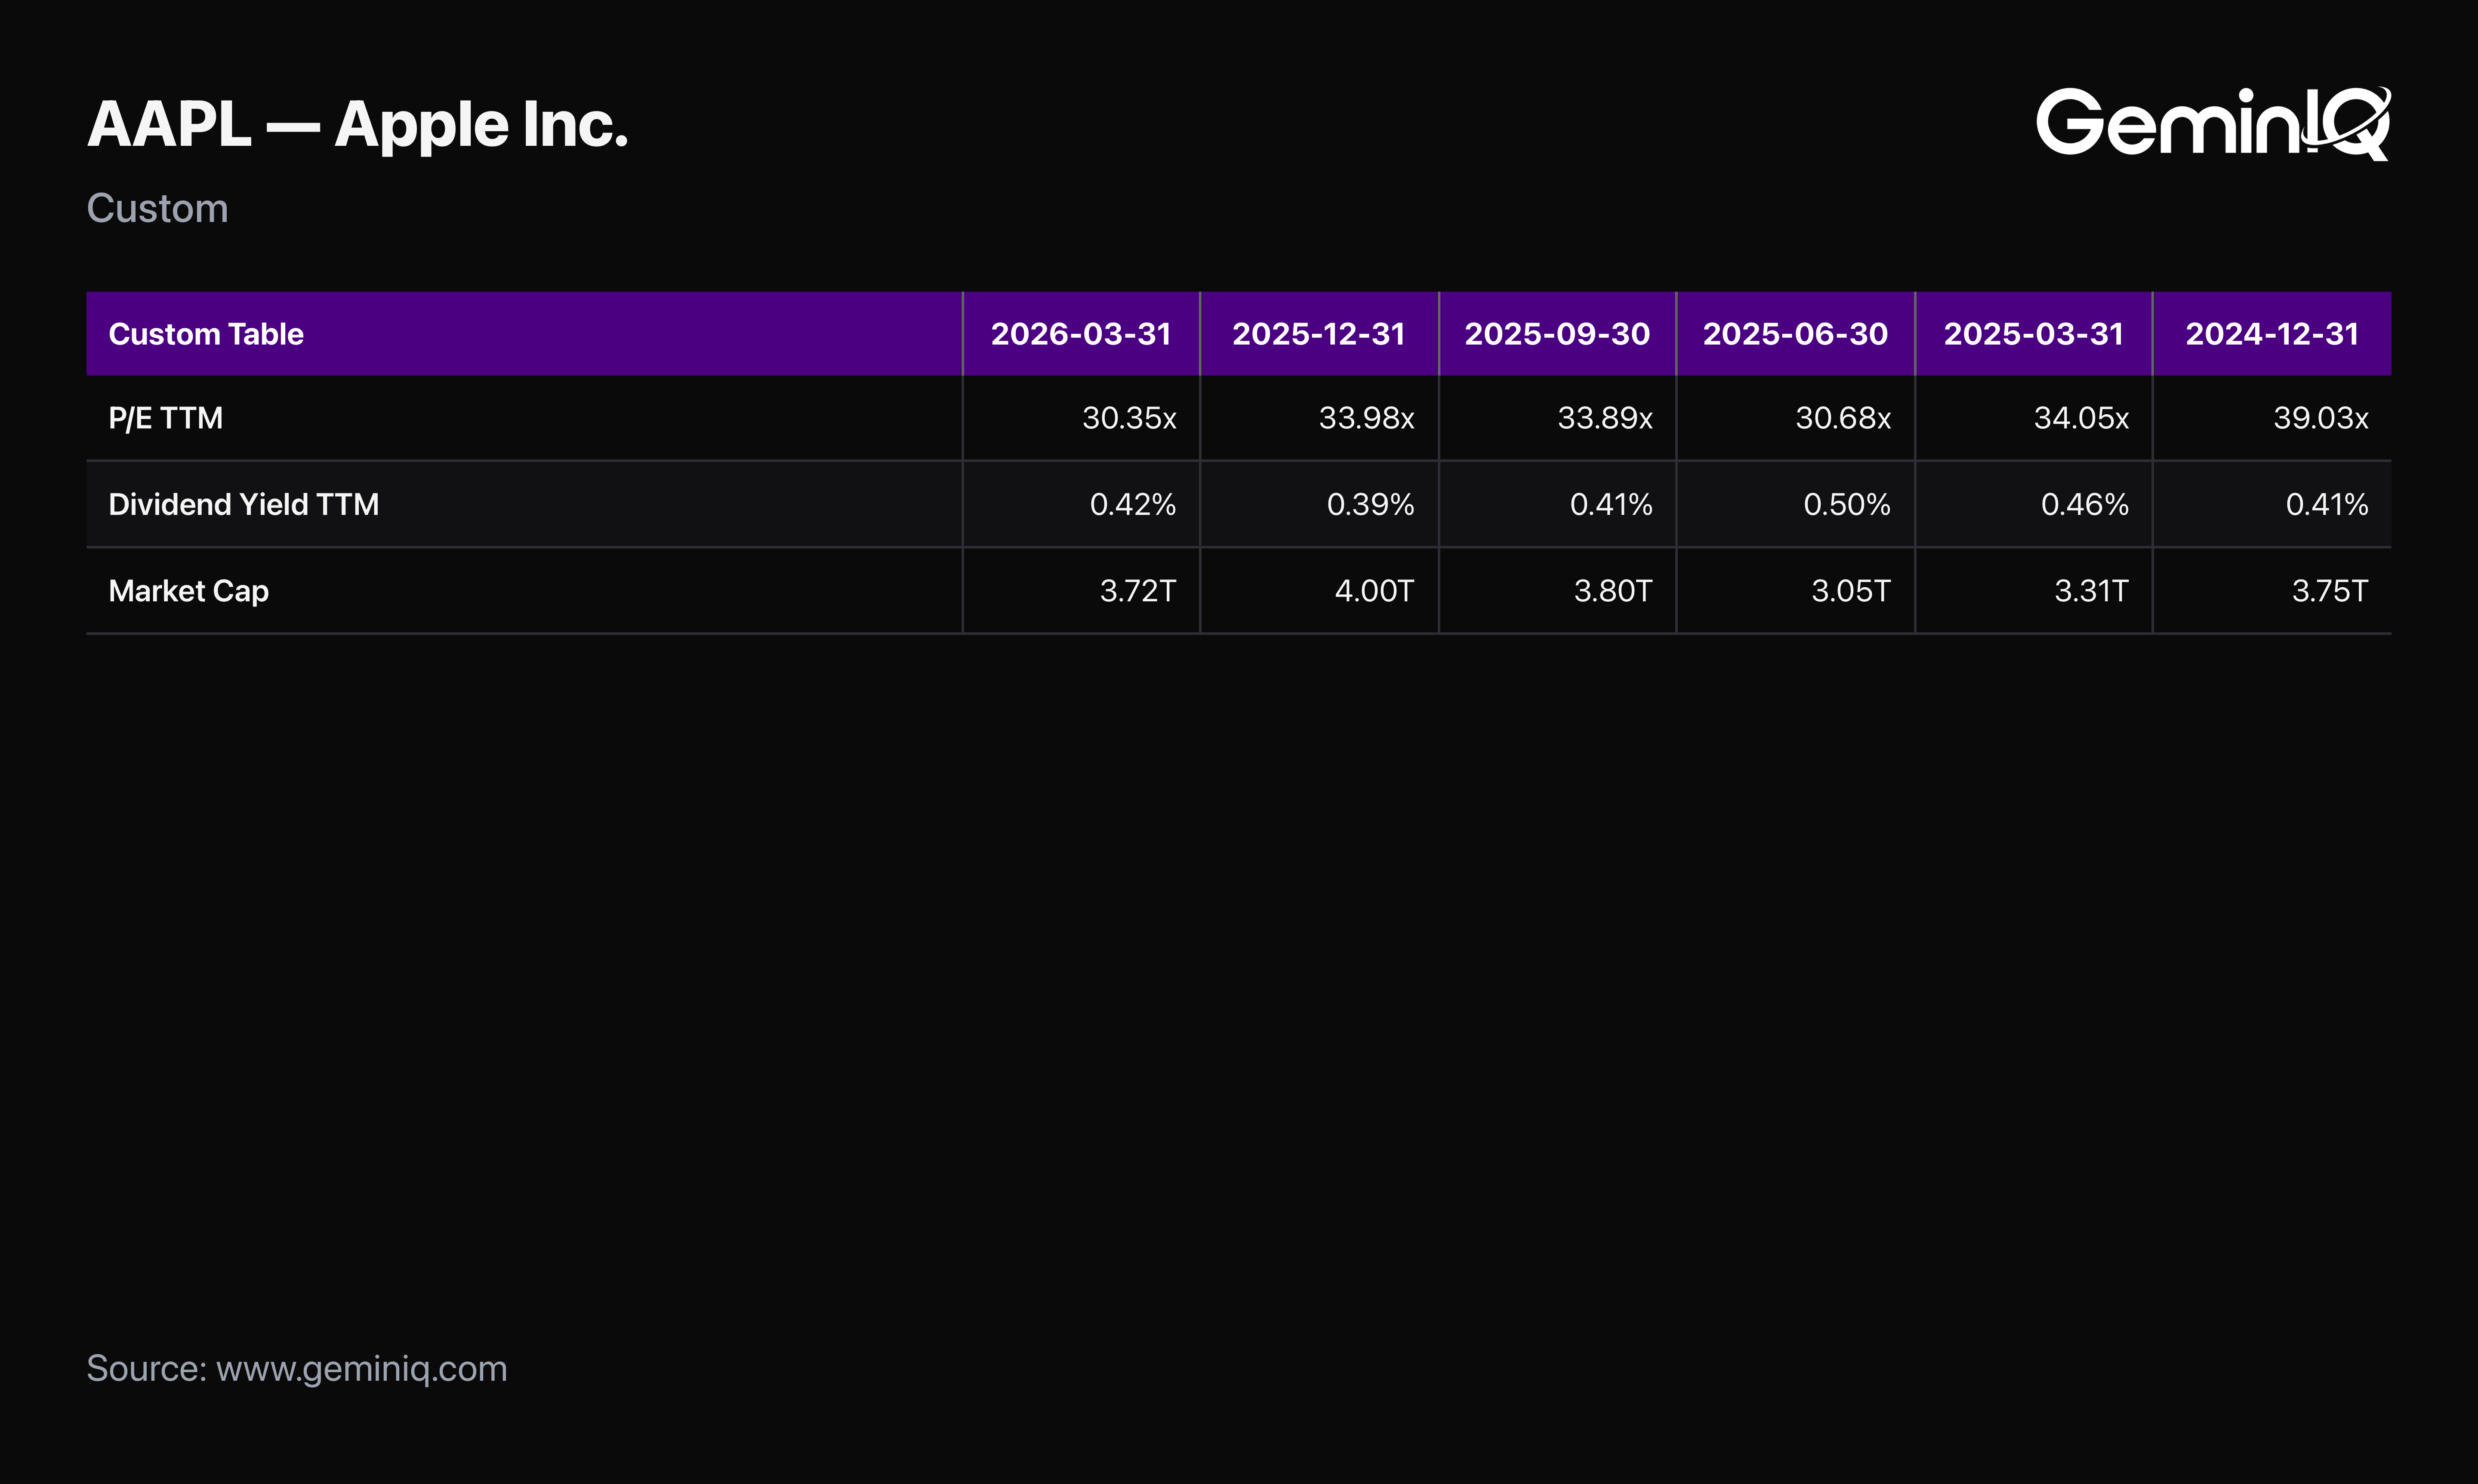
The Data: Apple's dividend yield (TTM) is 0.42% — nowhere near a figure that would attract yield-focused buyers in the first place, which makes the "yield trap" framing largely beside the point. On the value side, P/E (TTM) sits at 30.4x, down from 34.0x last quarter and well below the 39.0x reading from December 2024, even as the stock's market cap held near $3.72 Trillion. The multiple has been compressing as earnings caught up, not the other way around.
The GeminIQ Edge: Institutional Ownership data shows institutions holding 59.2% of shares outstanding as of the most recent 13F reporting period, down modestly from 61.1% the quarter before — a normal fluctuation, not a distribution pattern. Combined with Insider Transactions data showing zero open-market purchases in the recent filing window — consistent with Apple's pattern of essentially no executive open-market buying in over a decade of filings — there's no smart-money signal here in either direction. It isn't a yield play. It isn't obviously cheap, either. It's a capital-efficiency compounder that got quietly less expensive while everyone argued about iPhone units.
Frequently Asked Questions
What does GeminIQ's data show about Apple's retained earnings turning positive?
GeminIQ's Financial Statements show Apple's Retained Earnings (Accumulated Deficit) line item moving from -$2.18 Billion as of the Q1 FY2026 10-Q to $12.36 Billion as of the Q2 FY2026 10-Q, a swing of roughly $14.5 Billion in a single quarter. The shift coincides with a slowdown in buyback-driven share reduction relative to continued net income growth.
Is Apple's 81.7% ROIC unusual for a company of its size?
Yes. GeminIQ's pre-calculated Return on Invested Capital for Apple has ranged from roughly 65% to 83% over the trailing five quarters, an extreme figure for a company of Apple's market capitalization. Most large-cap companies post ROIC in the 10-20% range; Apple's capital-light model and buyback-compressed equity base produce a structurally higher number.
When did Apple last file its 10-Q, and what period does it cover?
Apple's most recent filing is a Form 10-Q filed May 1, 2026, covering the fiscal quarter ended March 28, 2026 (Q2 FY2026).
Where can I verify Apple's retained earnings figure against the original SEC filing?
The figure is drawn directly from Apple's Q2 FY2026 10-Q, filed with the SEC on May 1, 2026. The full filing is publicly available on SEC EDGAR (linked in the citation block below).
Wall Street's data. Main Street's price.
Institutional terminals charge thousands a year for as-filed accuracy. GeminIQ gives you the same thing for a fraction of the cost: financials built directly from raw SEC EDGAR filings, not third-party APIs, with full XBRL traceability back to the original 10-K or 10-Q. No normalized guesswork, just calculated metrics, charts, screeners, and watchlists built on numbers exactly as the company reported them. Start researching now at GeminIQ.com.
All financial figures cited in this article reference Apple Inc.'s Q2 FY2026 10-Q (filed May 1, 2026, period ending March 28, 2026). All SEC filings are publicly available at SEC EDGAR.
Disclaimer: The content in this blog is for educational and entertainment purposes only and does not constitute financial, legal, or tax advice. Investing involves risk, including the loss of principal. The views expressed are my own and not intended as financial advice or a guarantee of future performance.