
Altman Z-Score: Formula, Zones, and Limitations Explained

By Chad Hartman
Published · Last updated
The Altman Z-Score is one of the most widely cited quantitative tools in financial analysis — and one of the most widely misunderstood. Most financial platforms display a Z-Score. Most do not tell you which inputs they used to compute it. That gap matters more than the number itself. The same company can show a 3.4 on one platform and a 2.1 on another for the identical filing period, the difference driven entirely by how each platform sourced its working capital, EBIT, and market capitalization figures. Edward Altman developed the Z-Score at New York University in 1968 to predict corporate bankruptcy, producing a model with documented 72% accuracy two years ahead of filing. It does one thing: estimates the probability that a company will enter financial distress within the next two years. It does not measure quality, competitive position, or growth trajectory. Used correctly, the Z-Score is among the most reliable first-pass risk filters in fundamental analysis. Used carelessly — run on normalized data and misread as an investment signal — it provides false precision about a company's financial health.
Table of Contents
- What Is the Altman Z-Score?
- The Altman Z-Score Formula
- The Five Components Explained
- The Three Zones: Safe, Grey, and Distress
- Where the Altman Z-Score Breaks Down
- Why Two Platforms Show Different Z-Scores
- How to Use the Altman Z-Score in Practice
- Altman Z-Score vs. Piotroski F-Score
- Frequently Asked Questions
What Is the Altman Z-Score?
In 1968, Edward Altman published "Financial Ratios, Discriminant Analysis and the Prediction of Corporate Bankruptcy" — a paper that became one of the most referenced works in quantitative finance. The study applied discriminant analysis to 66 manufacturing companies, half of which had filed for bankruptcy, to identify which financial ratios could most reliably predict financial distress before it became visible to the market. Altman identified five ratios spanning liquidity, cumulative profitability, operating efficiency, market confidence, and asset productivity. Combined into a single weighted score, they produced a model that correctly classified bankrupt companies with 72% accuracy two years before their filing.
What makes the Z-Score durable is also what limits it: it is a structured, systematic assessment of whether a company's financial profile resembles those of companies that went bankrupt. It does not incorporate management quality, competitive dynamics, market conditions, or any qualitative factor. It reads the numbers and outputs a distress probability signal. For equity investors, that makes the Z-Score most valuable as a negative screener — a mechanism for eliminating companies with measurable bankruptcy risk before spending further analytical time on their valuation or business quality. A company in the distress zone is not necessarily uninvestable, but it carries an existential risk dimension that changes the return profile in a specific way. Bankruptcy produces total loss. A 40% drawdown does not.
The Altman Z-Score Formula
The full formula is:
Z = 1.2(A) + 1.4(B) + 3.3(C) + 0.6(D) + 1.0(E)
Where each variable represents a specific financial ratio drawn from the balance sheet and income statement:
A = Working Capital ÷ Total Assets B = Retained Earnings ÷ Total Assets C = EBIT ÷ Total Assets D = Market Value of Equity ÷ Total Liabilities E = Revenue ÷ Total Assets
The weights are not arbitrary. Altman derived them through statistical analysis of which ratios were most discriminating between the bankrupt and non-bankrupt cohorts in his original sample. Component C (EBIT/Total Assets) carries the highest weight at 3.3 because operating profitability relative to assets proved to be the single most predictive signal of impending bankruptcy. A company that cannot generate operating earnings from its asset base is consuming rather than producing value, and that structural problem compounds faster than any balance sheet adjustment can offset.
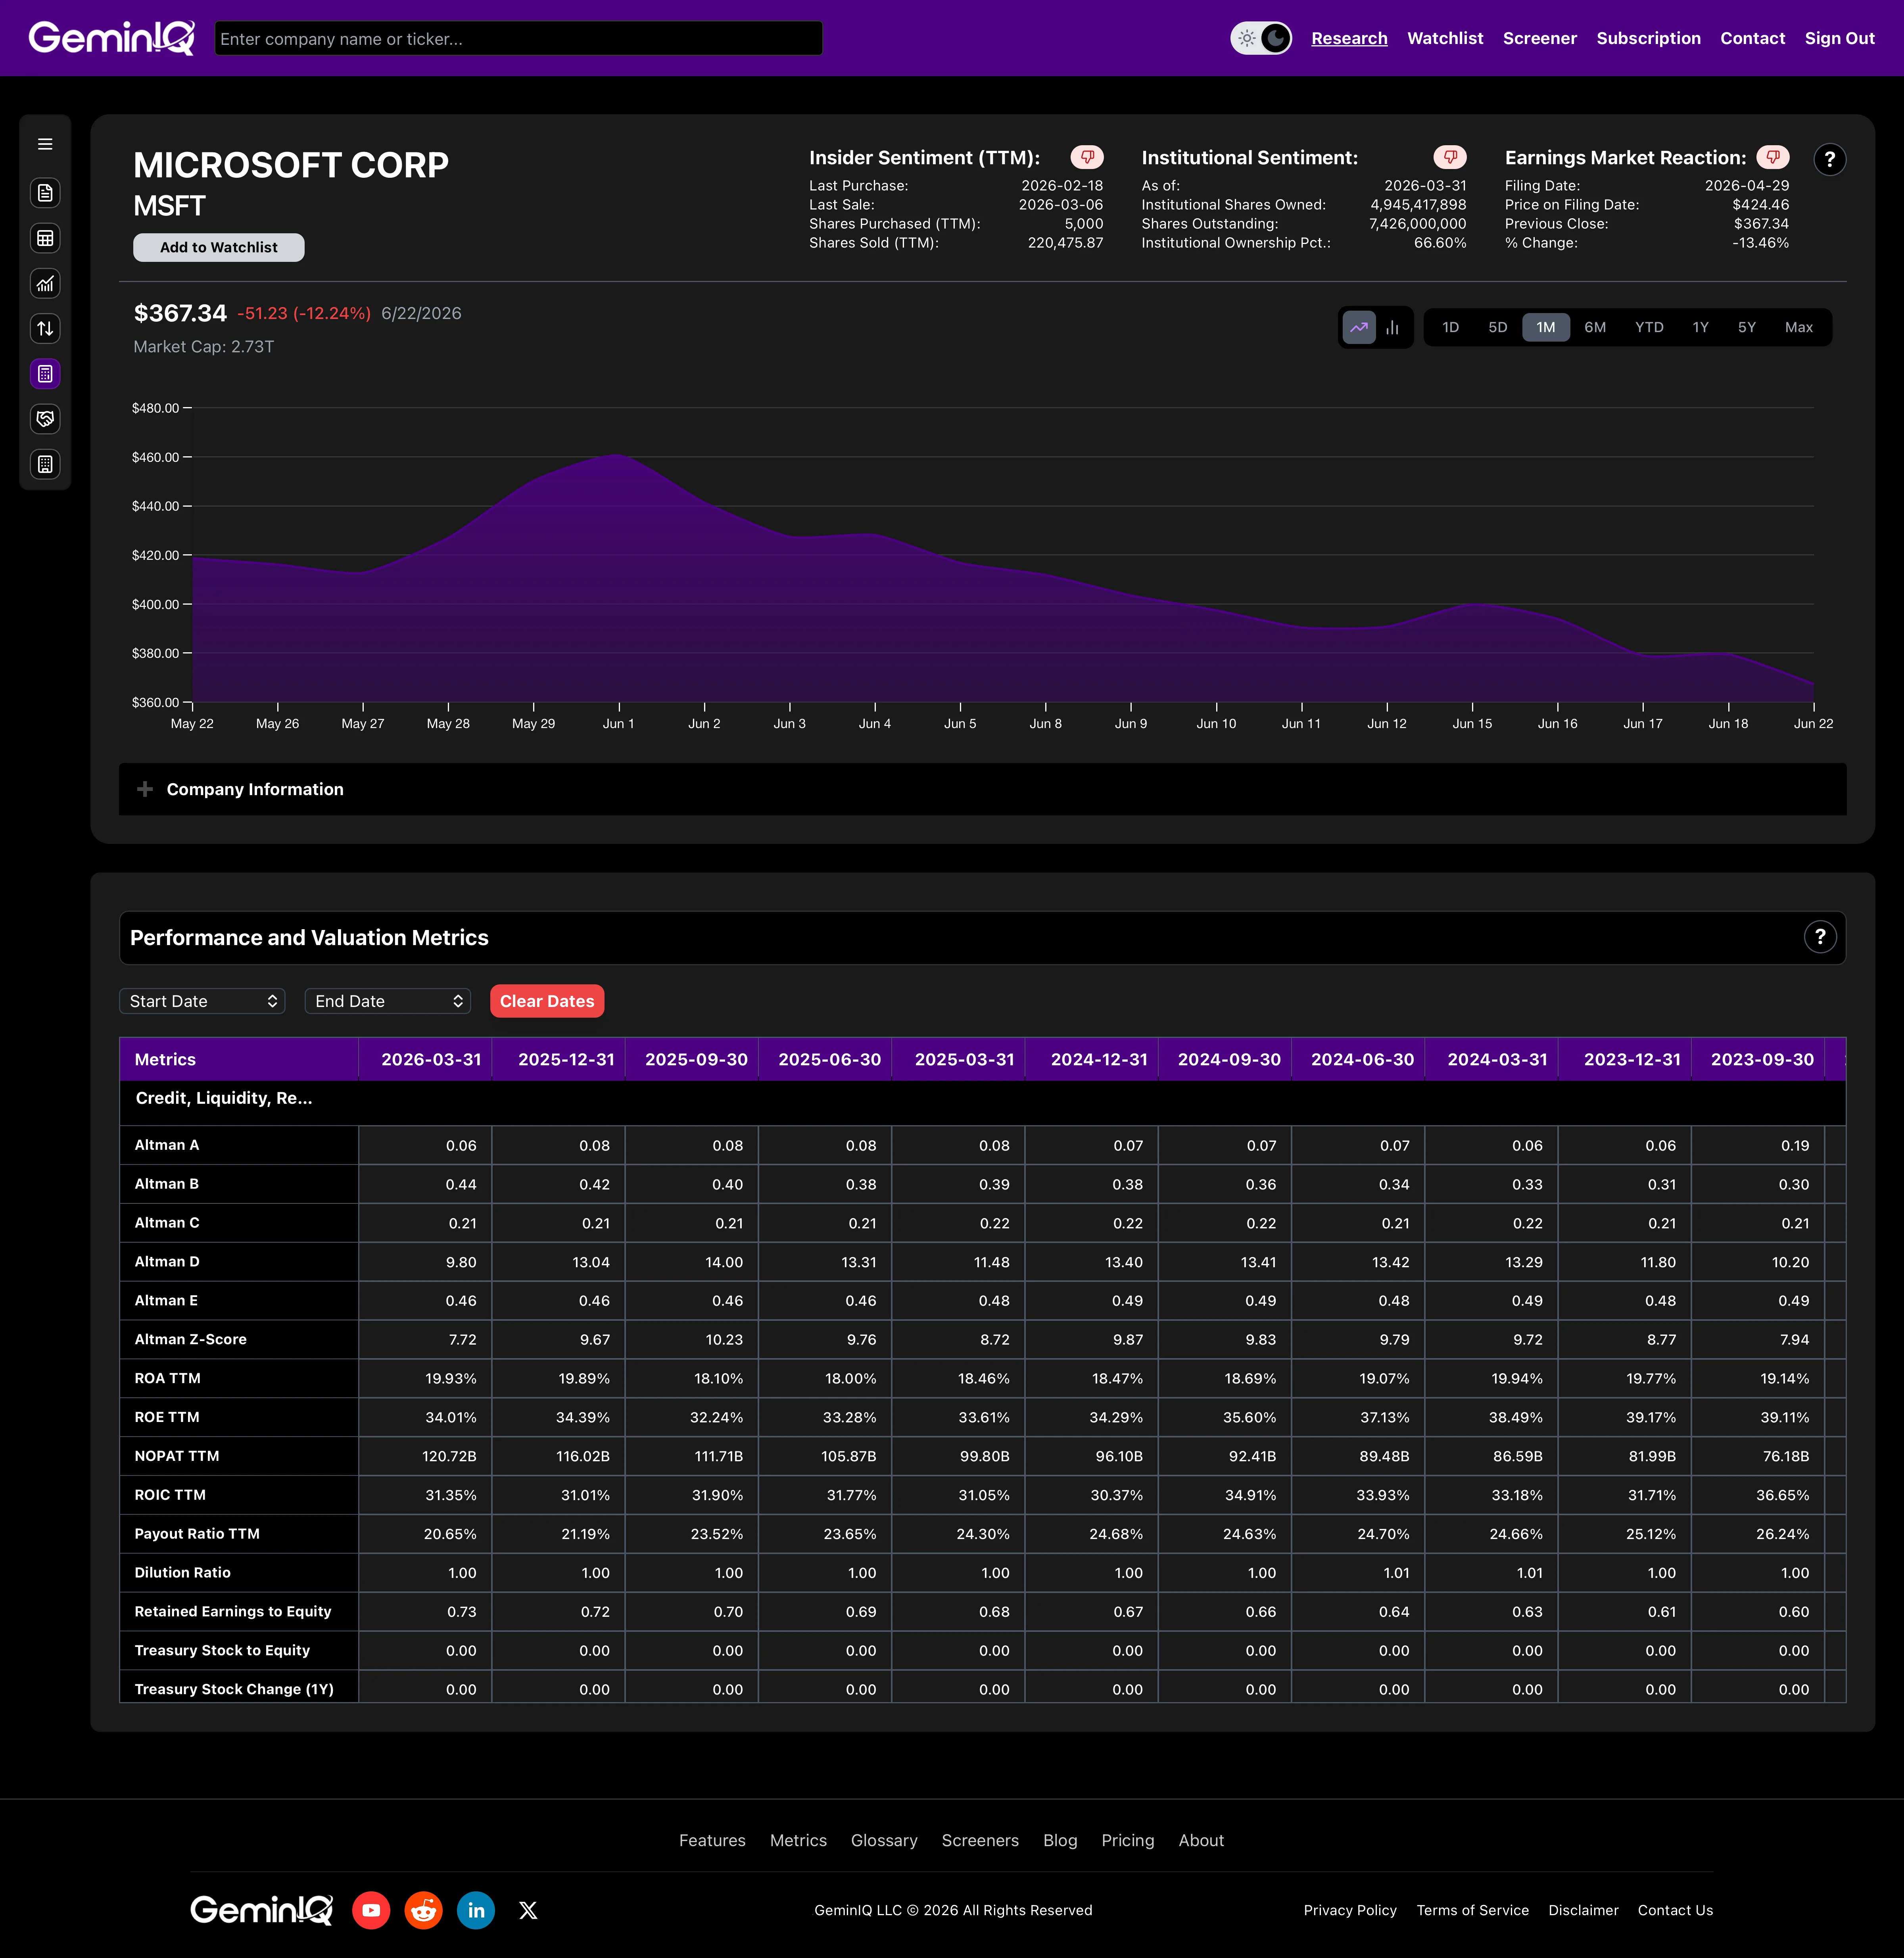
GeminIQ calculates the Altman Z-Score and all five individual component inputs directly from XBRL-tagged SEC filing data. Each component — labeled Altman A through Altman E on the platform — is available as a separately viewable and filterable field, which means you can see not just the composite score but exactly which dimension of the business is driving it.
The Five Components Explained
Component A: Working Capital ÷ Total Assets (Liquidity)
Working Capital is current assets minus current liabilities. Dividing by total assets normalizes the liquidity position to the scale of the business. A company with strong working capital relative to its asset base has a cushion to meet near-term obligations without liquidating long-term assets. A negative or rapidly shrinking Component A is an early warning: the company may be able to service long-term debt but is already struggling to fund day-to-day operations.
The weight of 1.2 reflects that liquidity is necessary but not singularly predictive. A business can run negative working capital and survive for years if it generates strong operating cash flow — retailers and subscription businesses routinely do. Component A reads the balance sheet snapshot; the rest of the formula contextualizes what that snapshot means.
Component B: Retained Earnings ÷ Total Assets (Accumulated Profitability)
Retained earnings represent the cumulative profit a company has kept inside the business across its entire operating history. Dividing by total assets produces a ratio that captures how much of the company's asset base has been self-funded through earnings rather than debt or equity issuances. A high Component B score means the business has a long track record of profitable operations. A low or negative B score means the company has either sustained historical losses, paid out most of its earnings, or is simply young.
This component receives a weight of 1.4 and embeds a structural bias against younger companies. A recently public business — even one that is currently profitable — will carry minimal retained earnings relative to assets because it has not had time to accumulate them. Altman was explicit that the model was designed for established public manufacturing companies. Component B is the place where the model most clearly shows its age when applied to modern businesses.
Component C: EBIT ÷ Total Assets (Operating Efficiency)
EBIT divided by total assets measures how productively the company converts its asset base into operating earnings. The weight of 3.3 reflects Altman's finding that this was the most discriminating ratio between bankrupt and non-bankrupt companies in his sample. A business that structurally cannot earn operating income from the assets it deploys is on a path toward distress regardless of how its balance sheet is temporarily arranged.
For investors familiar with Return on Assets, Component C is a close conceptual relative — both measure how much operating return a company generates per dollar of assets. The practical difference is that EBIT excludes taxes, making it comparable across tax regimes, and Component C feeds into the formula at the heaviest weight because Altman's data identified it as the single most discriminating signal of all five.
Component D: Market Value of Equity ÷ Total Liabilities (Market Confidence)
This is the Z-Score's market-facing input. It measures how much investor confidence exists in the company's equity value relative to what it owes — a high ratio signals that the market believes the business can service and ultimately retire its obligations. As the ratio falls toward 1.0 or below, the market is expressing doubt about whether the equity buffer is sufficient against the liability stack.
Component D receives a weight of 0.6 — the lowest in the formula — partly because market prices introduce short-term noise and partly because this ratio was less consistently predictive in Altman's original research than the pure accounting ratios. It is also the input most vulnerable to cross-platform differences: the same company will show materially different Component D values depending on whether the platform uses market cap at the filing period end date, at some arbitrary subsequent date, or averaged across a period.
Component E: Revenue ÷ Total Assets (Asset Productivity)
The final component measures how efficiently the company generates revenue from its asset base — essentially a version of Asset Turnover. High revenue relative to assets indicates a productive balance sheet. Low asset turnover may reflect overcapitalization, operational drag, or a business model that requires significant capital to operate. The weight is 1.0.
Component E can mislead in both directions for businesses that differ structurally from 1960s manufacturers. A capital-light software company may show very high Revenue/Total Assets — not because of operational excellence, but simply because it carries minimal physical assets on its balance sheet. A capital-intensive utility may show low Component E even with completely stable, predictable revenue. Neither reading reflects financial distress. Both reflect a structural mismatch with the formula's original context.
The Three Zones: Safe, Grey, and Distress
The Z-Score produces a continuous number, but Altman identified three interpretive zones from the distribution of scores in his bankrupt and non-bankrupt cohorts.
A score above 3.0 places a company in the safe zone. Historically, companies at this level showed a very low probability of bankruptcy within two years. The safe zone is not a quality signal. It does not mean the business is a good investment, that it is growing, or that its stock is cheap. It means the composite of its liquidity, profitability, leverage, and efficiency does not resemble the companies in Altman's bankrupt cohort.
A score between 1.8 and 3.0 is the grey zone — statistically uncertain territory where the Z-Score alone cannot reliably classify a company as healthy or distressed. Further investigation is required. A score of 2.8 trending downward over consecutive quarters is a very different situation from a 1.9 that has been stable or improving. The grey zone is where trend analysis becomes as important as the level.
A score below 1.8 is the distress zone, where the empirical frequency of bankruptcy within two years is meaningfully elevated. This does not guarantee bankruptcy — companies in the distress zone can and do recover, restructure, or access capital. But the historical probability is high enough that equity investors should treat a sub-1.8 score as a flag requiring explicit explanation before committing capital.
The practical severity becomes concrete when applied to real companies. In GeminIQ's airline sector analysis, American Airlines posted an Altman Z-Score of 0.60 — more than a full point below the distress threshold of 1.8 and deep into territory where the empirical probability of financial distress is elevated — while Delta Air Lines showed 1.34 and United Airlines showed 1.29, both also in the distress zone — below the 1.8 threshold, if not as deeply as American — despite broadly similar capital structures. The divergence traced primarily to negative retained earnings — accumulated historical losses that drove Component B deep into negative territory. Same industry. Similar asset footprints. A Z-Score of 0.60 versus 1.34 and 1.29, explained almost entirely by one component's accumulated history.
Where the Altman Z-Score Breaks Down
The Z-Score's limitations are structural. Altman himself acknowledged that the model was calibrated on a specific dataset — 66 publicly traded manufacturing companies in the 1960s — and that its predictive accuracy degrades outside that context.
Financial institutions are explicitly excluded from the model's scope. Banks, insurance companies, and investment firms have capital structures that make the five ratio inputs either meaningless or inverted. A bank's liabilities include customer deposits, not just creditor obligations. Its assets are primarily financial instruments rather than productive business assets. Running the Z-Score on a financial institution produces a number that carries no valid interpretive meaning.
Capital-light technology companies present a different problem. A profitable software business with strong recurring revenue may carry minimal retained earnings because it is young, minimal total assets because its intellectual property is not capitalized at cost, and high revenue relative to assets. The composite score can look distressed even when the business generates strong free cash flow. The model reads a company with thin asset coverage and a short earnings history and flags distress. The reality is that its capital-light structure simply does not conform to the 1960s manufacturing template.
Utilities and infrastructure businesses encounter the opposite distortion. Heavy asset bases suppress Components C and E, while stable regulated revenues produce consistent but modest operating margins. Many utilities maintain grey-zone Z-Scores through periods that bear no resemblance to financial distress, their scores driven by a business model rather than by any balance sheet deterioration.
Early-stage and recently public companies run into the retained earnings problem directly: any company that invested at a loss during its growth phase — even one that has been profitable for years — enters every Z-Score calculation with Component B handicapped by accumulated historical losses. That is a record of past investment, not present failure, but the formula makes no distinction.
Why Two Platforms Show Different Z-Scores
The Z-Score is more input-sensitive than most composite metrics. All five components feed into a single weighted sum, so a discrepancy in any one of them shifts the final number — sometimes enough to move a company across a zone boundary.
The most common sources of divergence are working capital treatment, EBIT definition, and market cap timing. Under ASC 842, adopted by most public companies between 2019 and 2021, operating lease obligations appear as current liabilities on the balance sheet. A company with significant lease commitments — a retailer, restaurant chain, or airline — shows higher current liabilities and therefore lower working capital on an as-filed basis than it would have under the prior standard. A platform applying a pre-ASC 842 normalized balance sheet template inflates working capital for these companies, producing a more favorable Component A — and a higher composite Z-Score — than the raw filing supports.
EBIT is also not standardized across platforms. Some use operating income as a direct proxy for Component C, which is usually correct but diverges when there are non-operating items classified above the operating income line. Others apply normalization adjustments for restructuring charges or acquired intangible amortization, changing the EBIT figure without changing the underlying filing data. The as-filed OperatingIncomeLoss XBRL tag from the income statement is the most consistent input for Component C, but not every platform uses it without modification.
Component D's market cap input is the most timing-sensitive of the five. A company that reports on a March 31 period end but whose market cap is pulled at any subsequent date will show a Component D that does not correspond to the balance sheet being analyzed. GeminIQ computes market capitalization for Component D as the closing price on the filing period end date multiplied by basic shares outstanding from that same period — keeping the market confidence ratio internally consistent with the balance sheet inputs it is being compared against.
Standard screeners display a Z-Score and rarely disclose which of these choices were made in computing it. GeminIQ's Calculated Metrics exposes each input separately — Altman A through Altman E — so the specific component driving an anomalous composite is immediately visible rather than buried in an opaque final number. For a deeper look at how data sourcing choices affect calculated financial metrics more broadly, the financial data verification guide covers the mechanics in detail. A platform that shows a single Z-Score without exposing its five inputs is not showing you the Altman Z-Score. It is showing you its own version of it.
How to Use the Altman Z-Score in Practice
The most reliable application of the Altman Z-Score is as a negative filter. It eliminates companies with elevated bankruptcy risk before investing analytical energy in their valuation, competitive position, or management quality. A value screen run without a distress filter will consistently surface companies trading at low multiples for exactly one reason: the market has priced in the possibility of permanent impairment. Filtering out sub-1.8 scores before examining those names removes the most dangerous category of value trap in a systematic way, without requiring any judgment about individual companies.
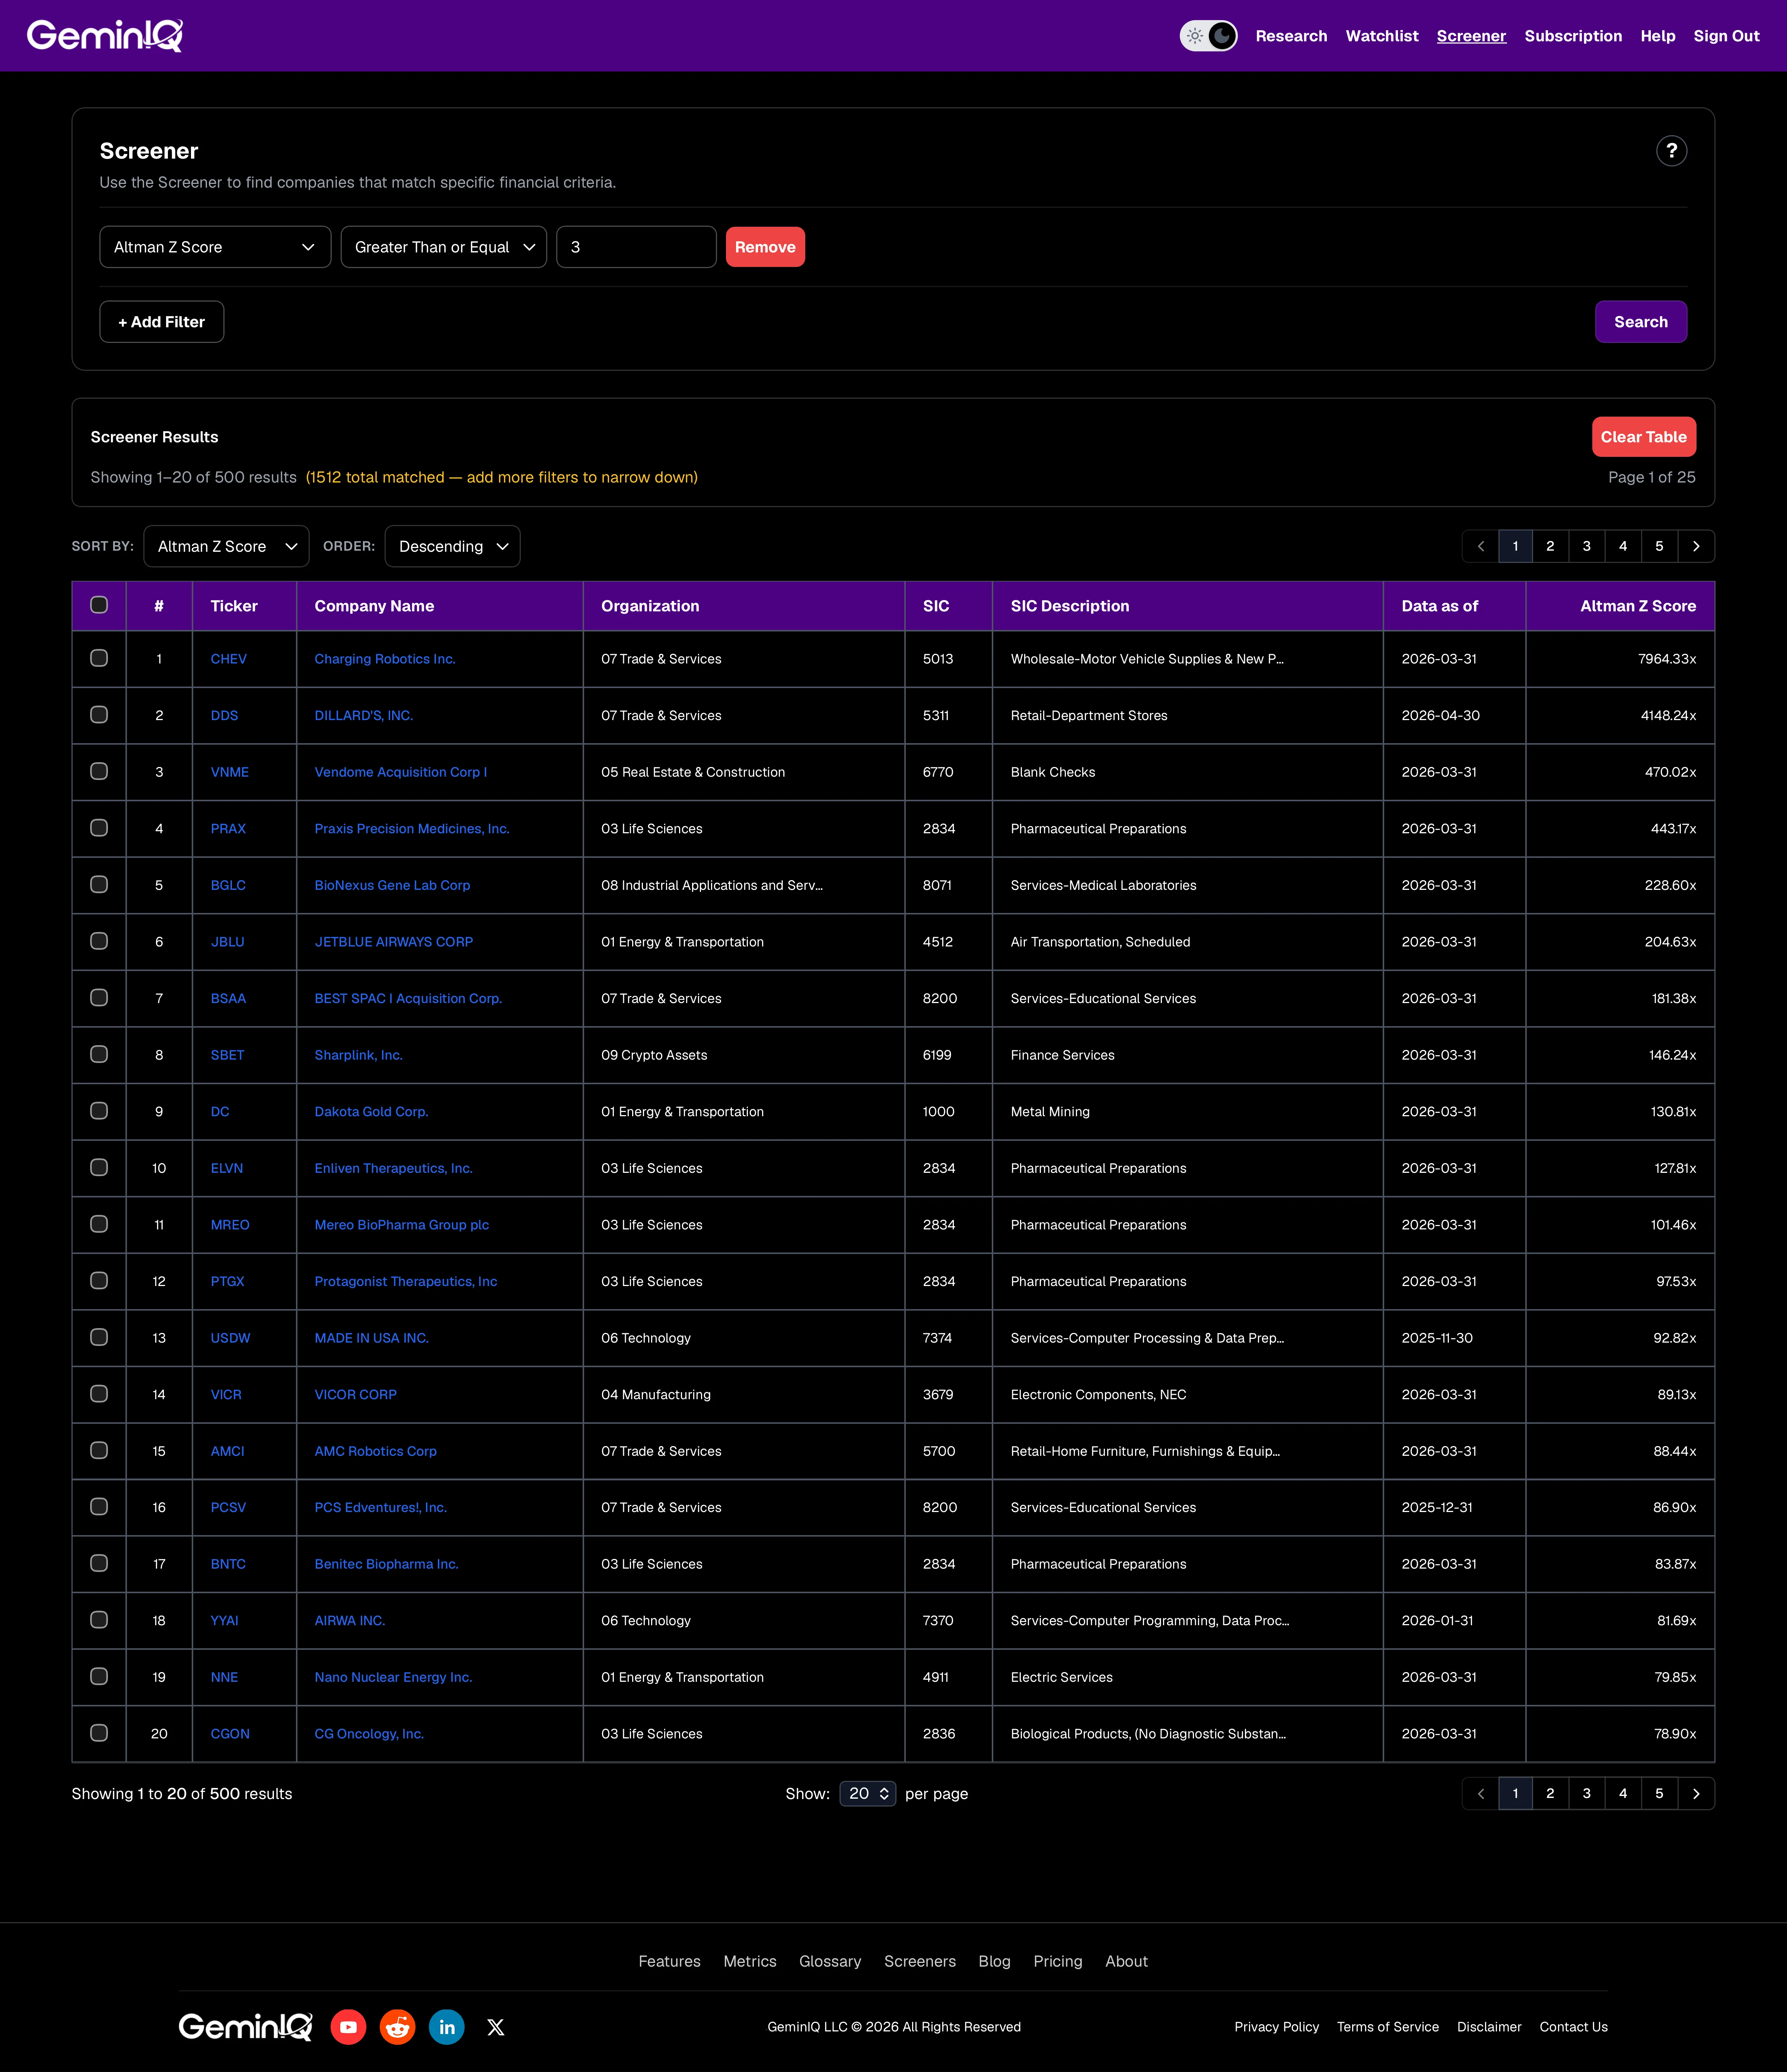
GeminIQ's Altman Z-Score Safe screener applies a single filter — Altman Z-Score ≥ 3.0 — to restrict results to the safe zone. The screener can be combined with additional overlays: Return on Assets to add a profitability gate, Debt Ratio for a leverage check, or Current Ratio for a liquidity confirmation. Because GeminIQ exposes Altman A through Altman E as separate filterable fields, it is also possible to filter on individual components — for example, targeting companies with strong Component C (EBIT/Total Assets) even if their composite score falls in the grey zone, which may identify operationally sound businesses temporarily penalized by low retained earnings or market confidence.
The trend of the Z-Score across quarters is often as informative as its level at any single point. A company sitting at 2.6 is in the grey zone regardless of direction. A company that was at 3.2 twelve months ago and has declined to 2.6 is on a trajectory the static number alone does not capture.
GeminIQ's historical view makes period-over-period comparisons direct — the full filing history visible in a single view. A distress reading on accurate, as-filed data is a signal. The same reading on normalized inputs is noise with a number attached.
Altman Z-Score vs. Piotroski F-Score
The Altman Z-Score and the Piotroski F-Score are complementary tools that answer fundamentally different questions. Treating them as alternatives misses the specific value each provides.
The Z-Score asks: does this company's financial profile resemble those of companies that went bankrupt? It is a static snapshot measured against an external historical benchmark. A score of 1.4 means the company's ratios, at this moment, place it in territory where bankruptcy probabilities have historically been elevated.
The Piotroski F-Score asks: is this company's financial situation improving or deteriorating? It scores nine binary signals across profitability, financial strength, and efficiency — each reflecting whether that dimension has improved or declined year-over-year. The output is a directional reading, not a distress probability.
A company can carry a safe Z-Score above 3.0 and a low F-Score of 0–2, which means it is not currently at near-term distress risk but its fundamentals are trending in the wrong direction. A company can also carry a grey-zone Z-Score with a high F-Score of 8–9, signaling uncertain distress probability but consistent fundamental improvement. The Piotroski F-Score analysis covers these dynamics in depth. Used together, the Z-Score screens out existential risk and the F-Score screens out slow fundamental deterioration — the two most common failure modes in value investing, addressed simultaneously.
They also complement each other on a data dimension. The Z-Score embeds a historical accumulation signal through Component B (retained earnings) that the F-Score does not measure. The F-Score captures near-term trend reversals through its year-over-year comparisons that a static Z-Score snapshot will miss. Together, they address the two most reliable ways a cheap stock destroys capital — by going bankrupt, or by continuing to deteriorate until the valuation is no longer a bargain.
Frequently Asked Questions
What is a good Altman Z-Score?
Above 3.0 is the safe zone — the company's financial profile does not resemble Altman's bankrupt cohort. Between 1.8 and 3.0 is the grey zone, where the outcome is statistically uncertain and further investigation is required. Below 1.8 is the distress zone, where the empirical frequency of bankruptcy within two years is meaningfully elevated. These thresholds come directly from Altman's original research and have been validated across subsequent studies, though they are probability thresholds derived from a historical sample, not hard physical limits. A score just above 3.0 is not categorically safer than a score of 2.98.
Does the Altman Z-Score work for technology companies?
With significant reservations. The model was built on manufacturing companies with substantial physical assets, long operating histories, and straightforward capital structures. Capital-light software businesses often show suppressed Component B scores because they are young or invested at a loss during early growth, and their Revenue/Total Assets ratios differ structurally from manufacturers. A low Z-Score on a profitable, cash-generating software company is frequently a model mismatch rather than a genuine distress signal. The Z-Score is most reliable for established, asset-heavy companies in traditional industries — manufacturing, retail, transportation, energy. For technology companies, it functions best as one signal among several rather than a standalone risk filter.
How often should I update the Z-Score?
Quarterly, aligned with 10-Q filing cadence. Each new filing updates the balance sheet and income statement inputs that drive all five components. A company scoring 2.3 in Q1 may score 2.8 or 1.9 by Q3 depending on how its working capital, retained earnings, and EBIT have moved. The trend of the score across consecutive quarters is often as informative as its level at any point. GeminIQ updates the Altman Z-Score and all five component inputs with each new filing automatically.
Why does my platform show a different Z-Score than GeminIQ?
The composite score depends entirely on five inputs, and any difference in how those inputs are sourced, normalized, or timed propagates into the final number. The three most common sources of divergence are working capital treatment under ASC 842 (operating lease current liabilities affect Component A), EBIT definition (adjusted vs. as-filed operating income affects Component C), and market cap timing (which date is used for the share price in Component D). GeminIQ sources all inputs from XBRL-tagged SEC filings, uses period-end market cap for Component D, and preserves the as-filed balance sheet structure rather than applying normalized templates. Because the five individual component values are visible separately on the platform, when a composite score looks anomalous, the specific input driving the discrepancy can be identified and traced directly to the filing.
Can a distress-zone company still be a good investment?
Financially distressed companies do sometimes offer recovery opportunities — but the Z-Score distress zone is specifically territory where bankruptcy risk is not negligible. The asymmetry matters: a correct recovery thesis produces strong returns; an incorrect one produces permanent capital loss, because common equity holders are last in the liquidation priority queue. A value investor buying into a distress-zone company is making a specific claim about recovery probability that must be priced explicitly into the analysis — the cheap valuation alone is not a margin of safety against an existential outcome. Using the Altman Z-Score Safe screener as a first-pass filter removes this risk category entirely for investors who choose not to take it on.
Wall Street's data. Main Street's price.
Institutional terminals charge thousands a year for as-filed accuracy. GeminIQ gives you the same thing for a fraction of the cost: financials built directly from raw SEC EDGAR filings, not third-party APIs, with full XBRL traceability back to the original 10-K or 10-Q. No normalized guesswork, just calculated metrics, charts, screeners, and watchlists built on numbers exactly as the company reported them. Start researching now at GeminIQ.com.
Disclaimer: The content in this blog is for educational and entertainment purposes only and does not constitute financial, legal, or tax advice. Investing involves risk, including the loss of principal. The views expressed are my own and not intended as financial advice or a guarantee of future performance.