
Negative Equity From Buybacks: 31 Companies

By Chad Hartman
Published · Last updated
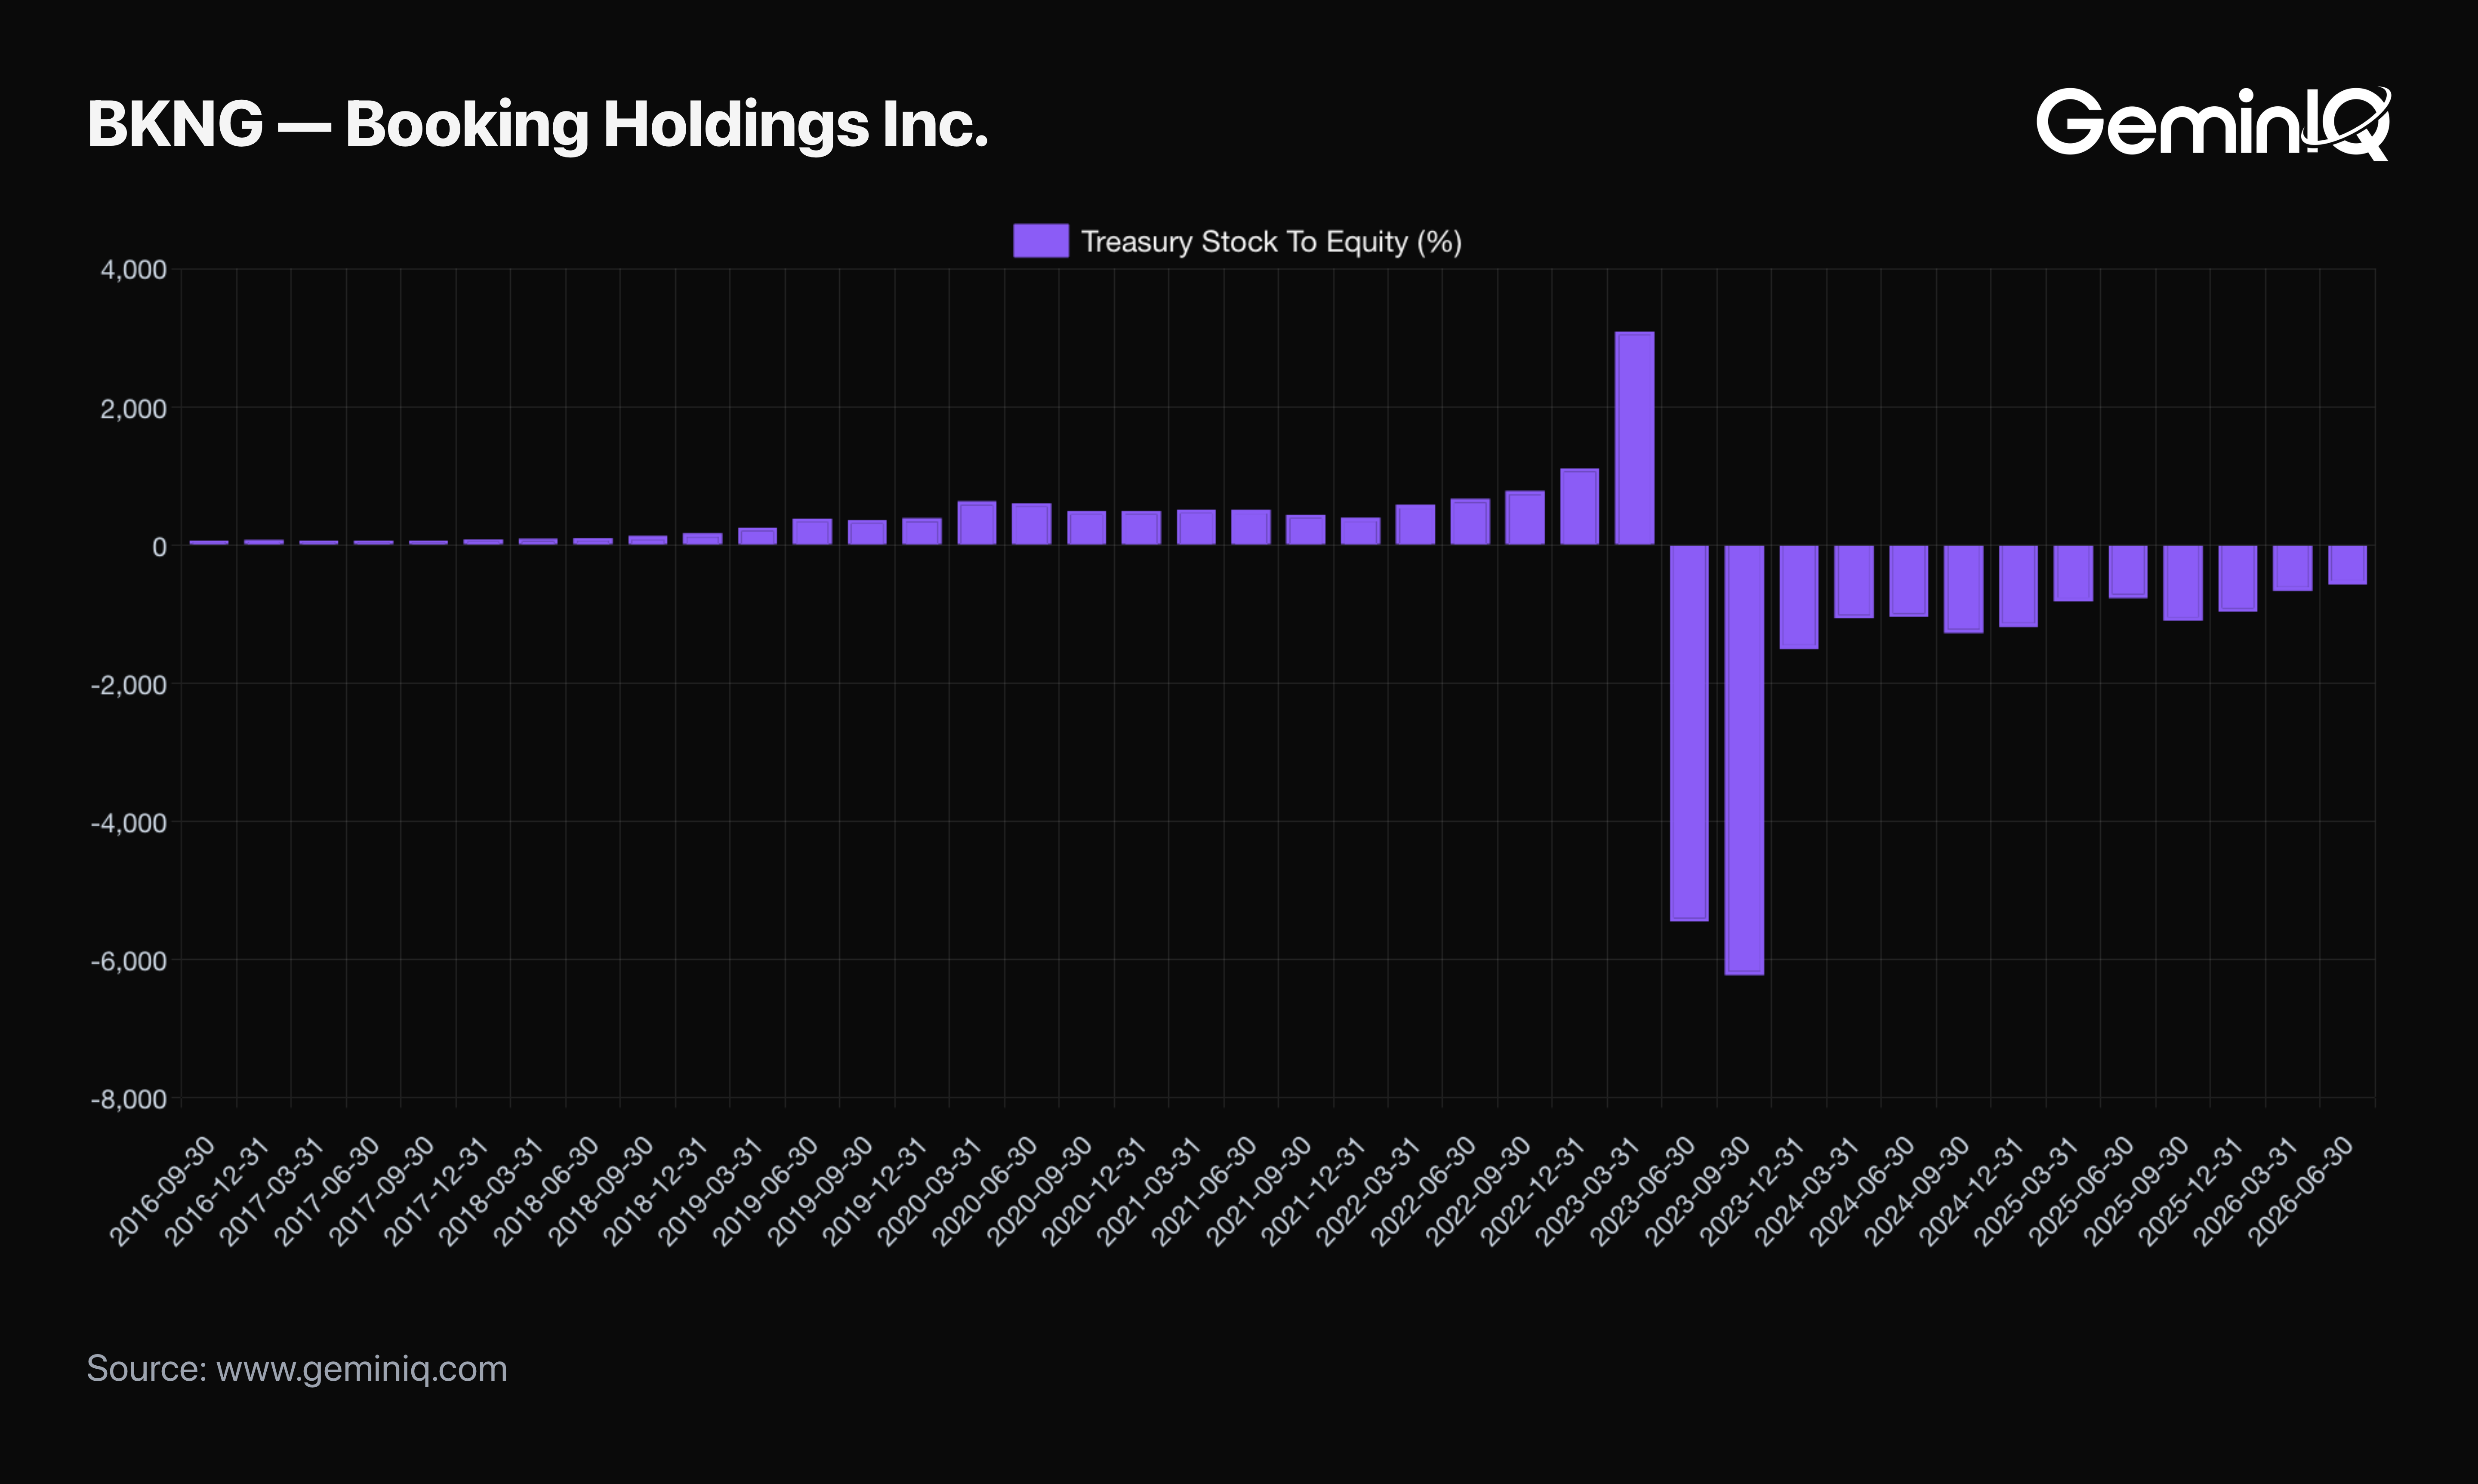
Booking Holdings reports -$10.8 billion in total stockholders' equity. Read the balance sheet in isolation and that number looks like a company drowning in accumulated losses. Read the filing itself and a different picture emerges: Booking Holdings has $43.0 billion in retained earnings — a profitable, cash-generative history — and $62.1 billion parked in treasury stock. The company did not lose its way into negative equity. It bought its way there, on purpose, one repurchase at a time.
This study reads GeminIQ's as-filed universe as of the most recent trailing-twelve-month filing period. It isolates companies with negative total stockholders' equity and positive retained earnings — the specific combination that identifies a deficit built by buybacks rather than by losses. 31 companies in GeminIQ's current filing snapshot meet that description. Separately, across the full population of 1,239 companies currently showing negative equity for any reason, 52 have treasury stock alone — before retained earnings even enters the calculation — large enough to fully explain the deficit on its own.
The Pattern
Negative stockholders' equity gets treated as a single warning signal in most screeners, and it collapses two entirely different stories into one number. A company can post negative equity because it has burned through capital on losses, which is a real solvency concern. Or it can post negative equity because it has spent decades generating profit and returning nearly all of it to shareholders through buybacks large enough to exceed the retained earnings that funded them. That is closer to a capital-allocation choice than a warning sign. The retained-earnings-positive filter below separates the second group from the first, and the twenty largest names in it are some of the most recognizable, cash-generative businesses in the market.
The Data
| Rank | Company | Ticker | Total Equity | Treasury Stock | Retained Earnings |
|---|---|---|---|---|---|
| 1 | Booking Holdings Inc. | BKNG | -$10.8B | $62.1B | $43.0B |
| 2 | Philip Morris International | PM | -$6.7B | $35.5B | $36.1B |
| 3 | Marriott International Inc. | MAR | -$4.5B | $29.7B | $19.5B |
| 4 | McKesson Corp | MCK | -$4.2B | $34.9B | $22.8B |
| 5 | Fair Isaac Corp | FICO | -$4.1B | $10.3B | $5.2B |
| 6 | Avis Budget Group, Inc. | CAR | -$3.4B | $10.7B | $0.9B |
| 7 | Cardinal Health Inc. | CAH | -$2.7B | $7.6B | $2.0B |
| 8 | MSCI Inc. | MSCI | -$2.7B | $10.4B | $5.9B |
| 9 | Altria Group, Inc. | MO | -$2.6B | $43.5B | $36.4B |
| 10 | Dell Technologies Inc. | DELL | -$1.4B | $16.1B | $6.3B |
| 11 | Verisk Analytics, Inc. | VRSK | -$1.2B | $12.1B | $8.0B |
| 12 | McDonald's Corp | MCD | -$1.0B | $80.5B | $72.0B |
| 13 | Travel & Leisure Co. | TNL | -$1.0B | $7.9B | $2.5B |
| 14 | Jack in the Box Inc. | JACK | -$0.9B | $3.2B | $1.8B |
| 15 | Pitney Bowes Inc. | PBI | -$0.9B | $3.0B | $2.7B |
| 16 | Equitable Holdings, Inc. | EQH | -$0.8B | $5.6B | $8.2B |
| 17 | United Parks & Resorts Inc. | PRKS | -$0.6B | $2.2B | $0.8B |
| 18 | DaVita Inc. | DVA | -$0.5B | $0.8B | $0.1B |
| 19 | BellRing Brands, Inc. | BRBR | -$0.5B | $0.9B | $0.4B |
| 20 | Papa John's International Inc. | PZZA | -$0.4B | $1.1B | $0.2B |
McDonald's: The Cleanest Case in the Data
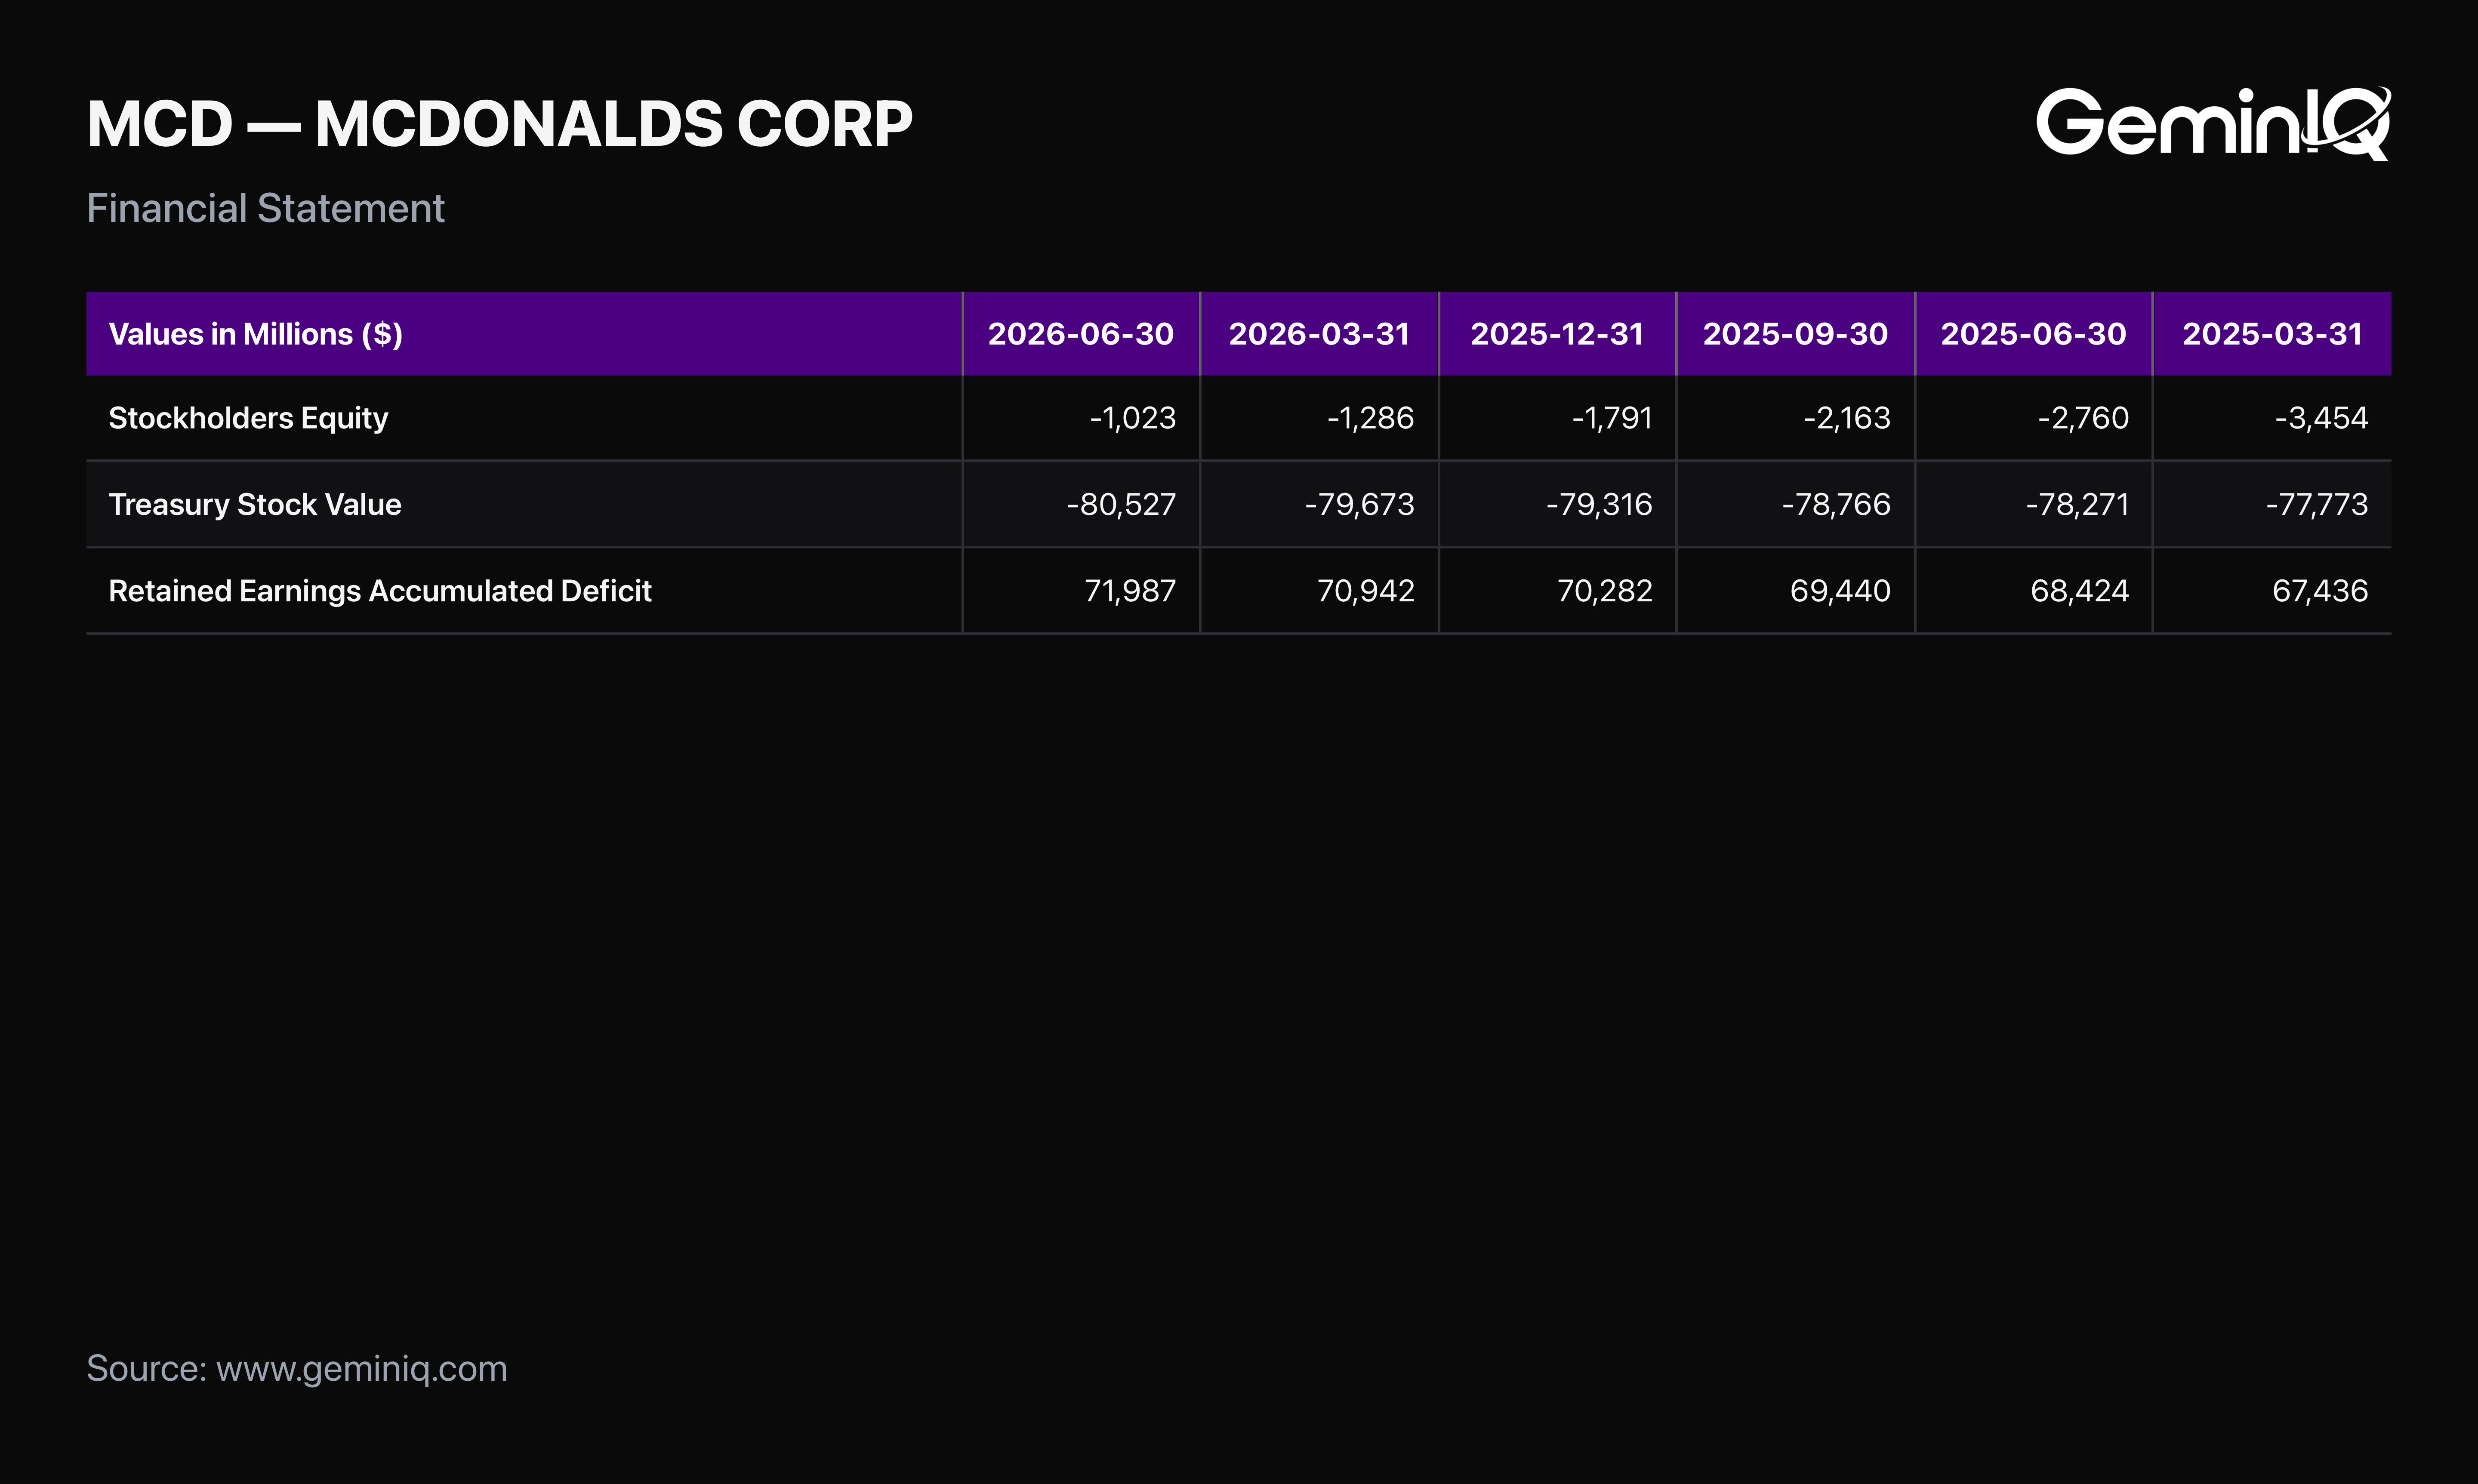
McDonald's is the sharpest illustration in this list. The company's $72.0 billion in retained earnings is larger than the total stockholders' equity of most companies on the S&P 500, and its $80.5 billion treasury stock balance exceeds it — the arithmetic difference is the entire -$1.0 billion equity figure on the balance sheet. This is not a company that lost money; it is a company that has returned more capital to shareholders over its history than the accounting value of the business it built to generate that capital in the first place.
Philip Morris International and McKesson tell the same story at different scale — both carry retained earnings that would put total equity solidly positive if treasury stock were excluded from the calculation entirely, and both are large, liquid, dividend-paying businesses that a "negative equity" screen alone would flag as distressed.
The ASC 842 Distinction Worth Knowing
A separate and unrelated reason a balance sheet can look more levered than it is: operating lease liabilities recognized under ASC 842. Third-party aggregators routinely count these liabilities as debt, even though they are not notes payable and do not carry the same default risk. That distinction does not explain the negative-equity pattern in this study — treasury stock and retained earnings are the entire story here. But it is worth separating from buyback-driven negative equity when reading any balance sheet screen that flags "high leverage" without showing the underlying line items.
The Method
Total stockholders' equity, treasury stock, and retained earnings are as-filed figures for each company's most recent filing period within the last fifteen months, read directly from GeminIQ's Financial Statements data. The ranking is restricted to companies with negative total equity and positive retained earnings — isolating deficits attributable to repurchases rather than to accumulated losses — and sorted by the magnitude of the equity deficit. GeminIQ's Treasury Stock To Equity metric expresses the same relationship as a ratio for any individual company on the platform. Full methodology is covered in How GeminIQ Builds Filing Data Studies.
Check Your Holdings
Pull up any position showing negative stockholders' equity on GeminIQ and check retained earnings before assuming distress. A negative-equity company with a large positive retained-earnings balance and a treasury stock line to match is telling a capital-return story, not a solvency one; a negative-equity company with negative retained earnings is a fundamentally different situation. Every reader can run that same check directly against GeminIQ's as-filed data.
Frequently Asked Questions
What does negative stockholders' equity mean?
It means a company's total liabilities exceed its total assets on the balance sheet. That can reflect accumulated losses, or — as this study isolates — a company that has simply returned more capital to shareholders through buybacks than the retained earnings that funded them, which is a very different situation.
Is negative equity from buybacks a warning sign?
Not in the way negative equity from accumulated losses is. In GeminIQ's data, Booking Holdings shows -$10.8 billion in equity alongside $43.0 billion in retained earnings — a profitable history, with $62.1 billion parked in treasury stock. The deficit reflects a capital-allocation choice, not a solvency problem.
How can you tell if negative equity comes from losses or buybacks?
Check retained earnings alongside total equity. A negative-equity company with positive retained earnings and a treasury stock balance large enough to explain the gap is a buyback-driven case; a negative-equity company with negative retained earnings reflects accumulated losses instead.
How many companies does this study cover?
31 companies in GeminIQ's current filing snapshot show negative total stockholders' equity alongside positive retained earnings — the specific combination that identifies a deficit built by buybacks rather than losses.
Wall Street's data. Main Street's price.
Institutional terminals charge thousands a year for as-filed accuracy. GeminIQ gives you the same thing for a fraction of the cost: financials built directly from raw SEC EDGAR filings, not third-party APIs, with full XBRL traceability back to the original 10-K or 10-Q. No normalized guesswork, just calculated metrics, charts, screeners, and watchlists built on numbers exactly as the company reported them. Start researching now at GeminIQ.com.
All figures are drawn from each company's as-filed 10-K and 10-Q filings, publicly available on SEC EDGAR. Rankings are computed from GeminIQ's Financial Statements data across the described universe and snapshot window.
Disclaimer: The content in this blog is for educational and entertainment purposes only and does not constitute financial, legal, or tax advice. Investing involves risk, including the loss of principal. The views expressed are my own and not intended as financial advice or a guarantee of future performance.