
Coca-Cola 10-K Analysis (2026): The Dividend Cash Gap

By Chad Hartman
Published · Last updated
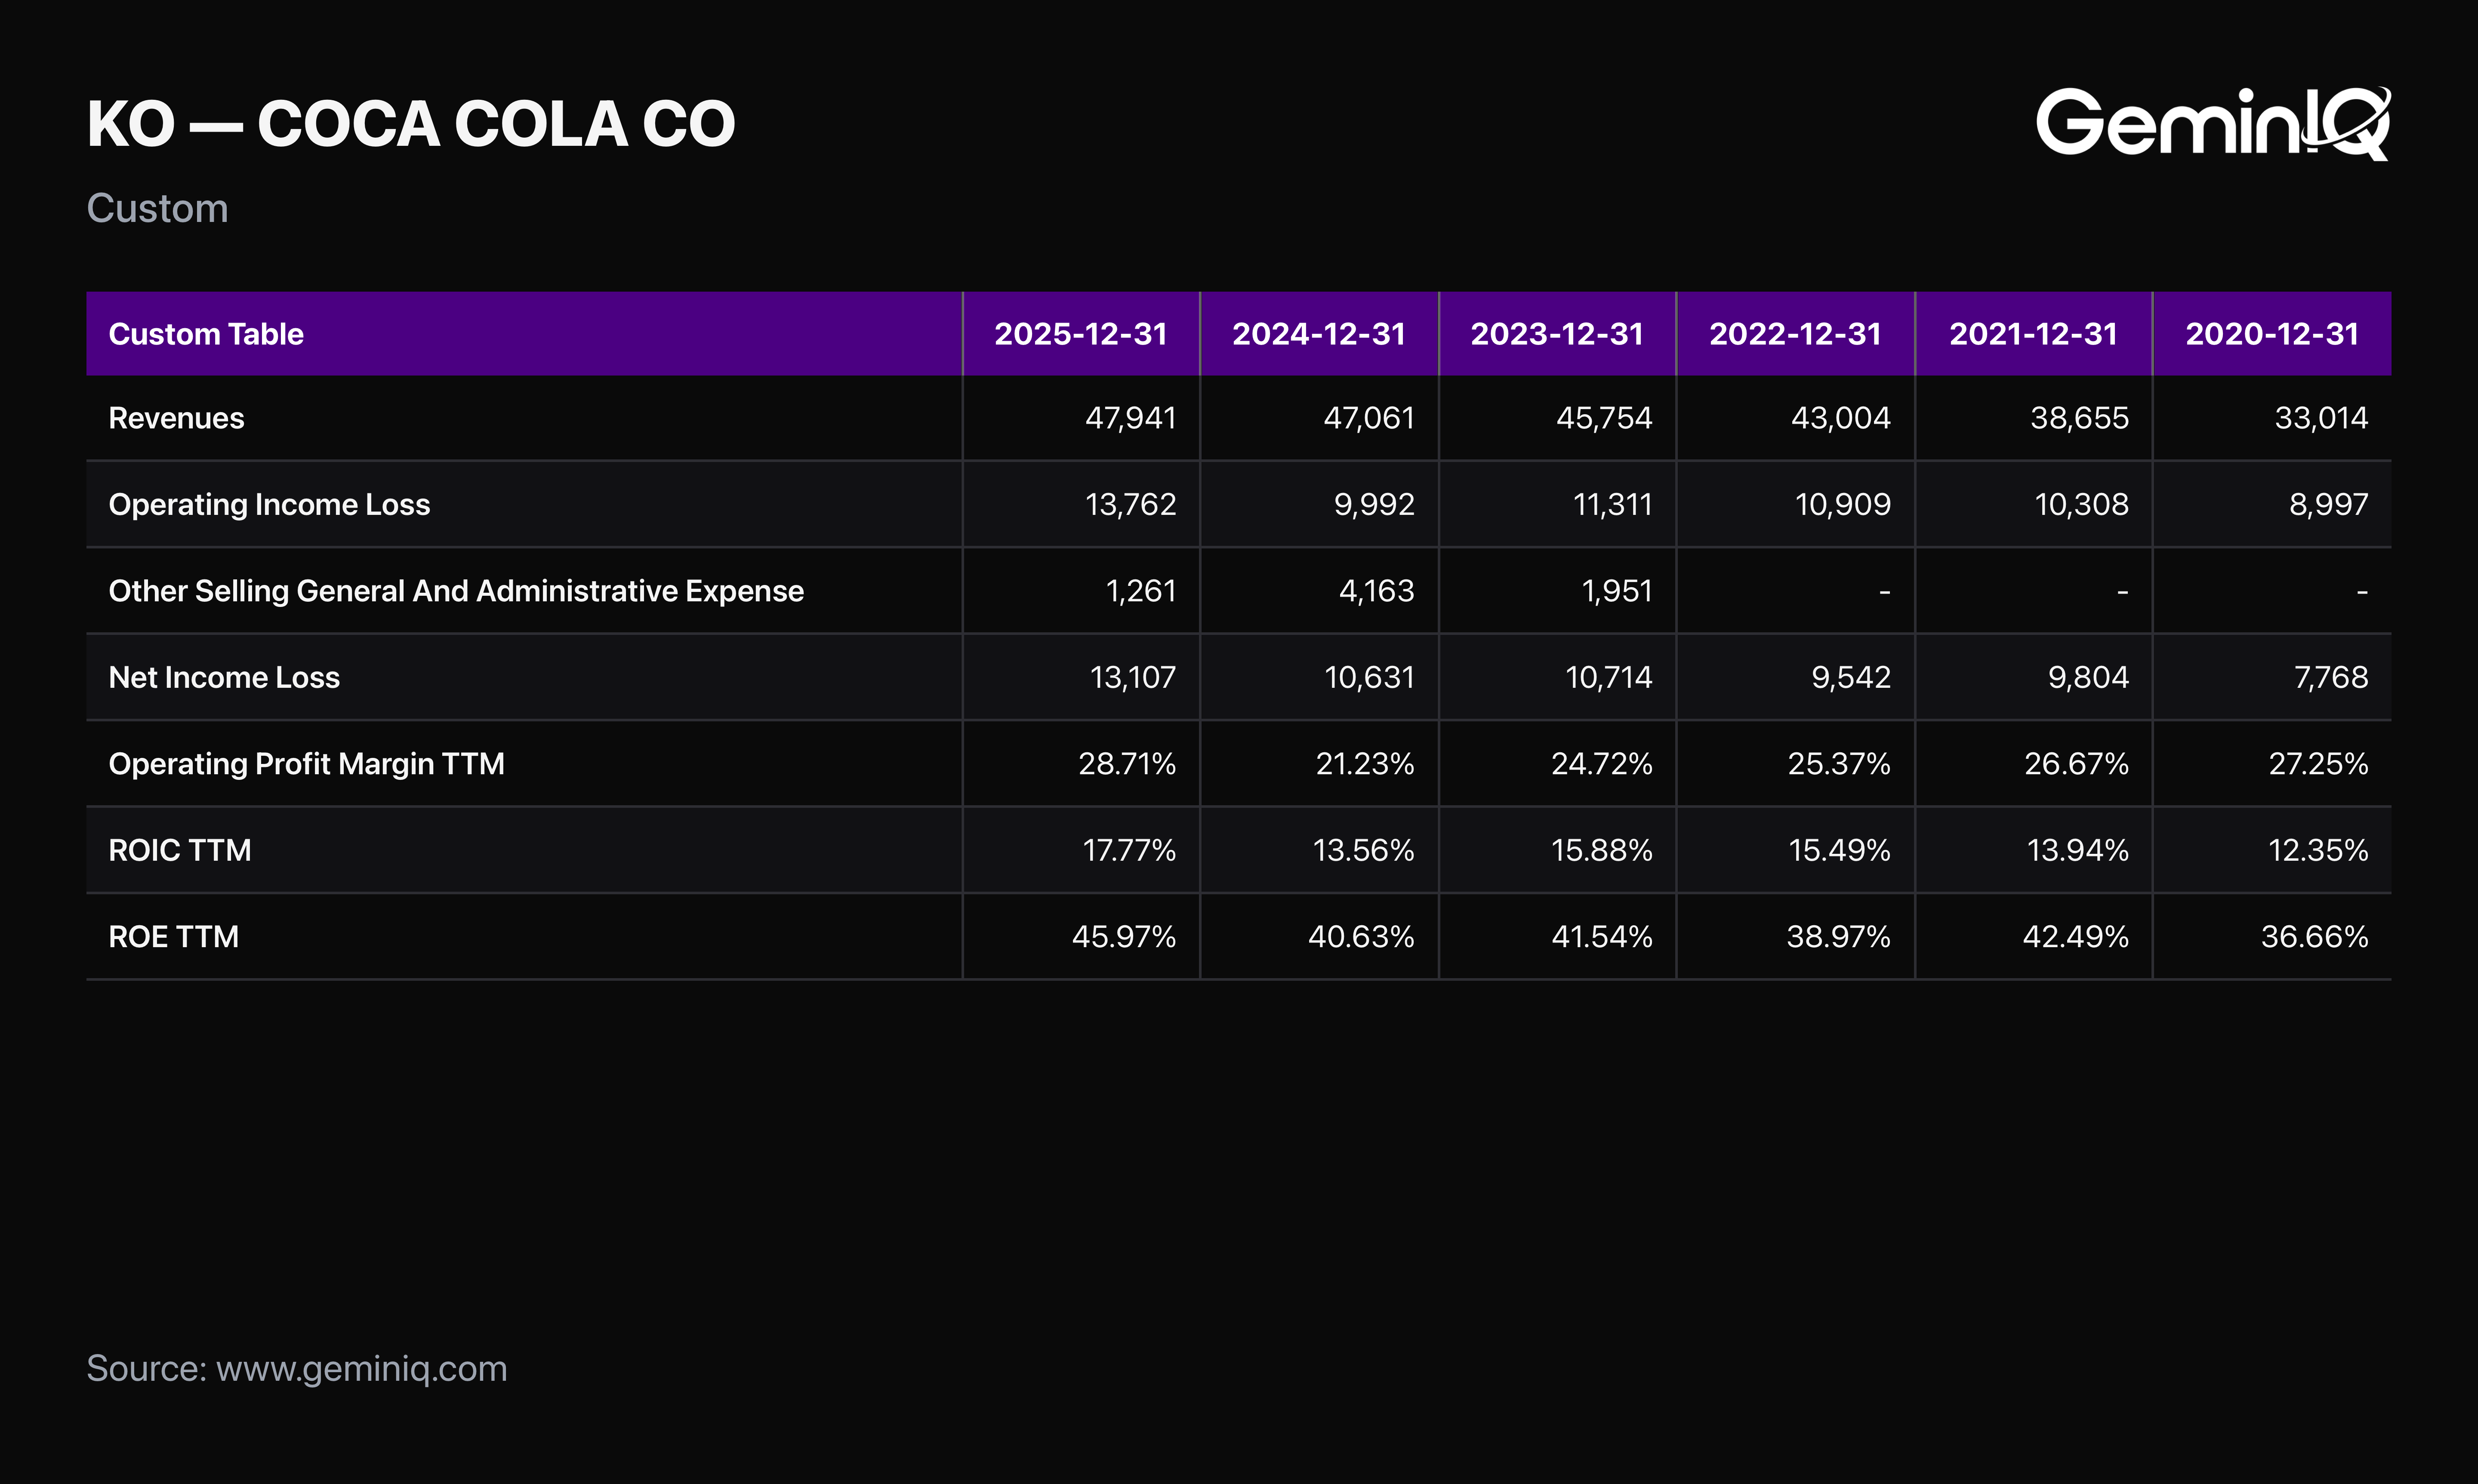
Coca-Cola Company ($KO) just filed its FY2025 10-K (filed February 20, 2026). By nearly every income statement measure, it was the strongest year the company has posted in over a decade: operating income of $13.76 Billion, an operating margin of 28.7%, and the highest return on invested capital in the seven-year window. The cash flow statement reports something the earnings headlines did not. Free cash flow came in at $5.30 Billion against $8.78 Billion in dividends paid — the second consecutive fiscal year the dividend exceeded the cash the business actually generated.
| Field | Value |
|---|---|
| Ticker | $KO |
| Filing | FY2025 10-K |
| Filed | February 20, 2026 |
| Period End | December 31, 2025 |
| Operating Margin (TTM) | 28.71% |
| Free Cash Flow (FY2025) | $5.30 Billion |
| Dividends Paid (FY2025) | $8.78 Billion |
| FCF Dividend Coverage | 0.60x |
Coca-Cola (KO) FY2025 10-K: The Best Income Statement in Over a Decade
Nothing on the face of Coca-Cola's income statement suggests a company under strain.
The Data: Coca-Cola reported Net Operating Revenues of $47.94 Billion in FY2025, up from $47.06 Billion the prior year. Operating Income climbed to $13.76 Billion from $9.99 Billion, an increase of 37.7%. Net Income Attributable To Shareowners Of The Coca-Cola Company reached $13.11 Billion against $10.63 Billion in FY2024. GeminIQ's pre-calculated Operating Profit Margin puts the TTM figure at 28.71%, up from 21.23%, while Return on Invested Capital reached 17.77% — the highest reading in the seven fiscal years on file — and Return on Equity hit 45.97%.
Part of that jump is a base effect rather than operating improvement. Other Operating Charges, filed under Other Selling General And Administrative Expense, fell from $4.16 Billion in FY2024 to $1.26 Billion in FY2025. That single swing accounts for roughly three-quarters of the operating income increase. The underlying business improved. It did not improve by 37.7%.
The GeminIQ Edge: A screener reading the income statement alone records FY2025 as a breakout year and stops there. Pulling the raw Financial Statements alongside GeminIQ's Calculated Metrics exposes the charge line driving most of the comparison — the kind of adjustment that never surfaces in a headline EPS beat.
Where the Earnings Stopped Becoming Cash
Record net income only matters if it arrives as cash. In FY2025, most of it did not.
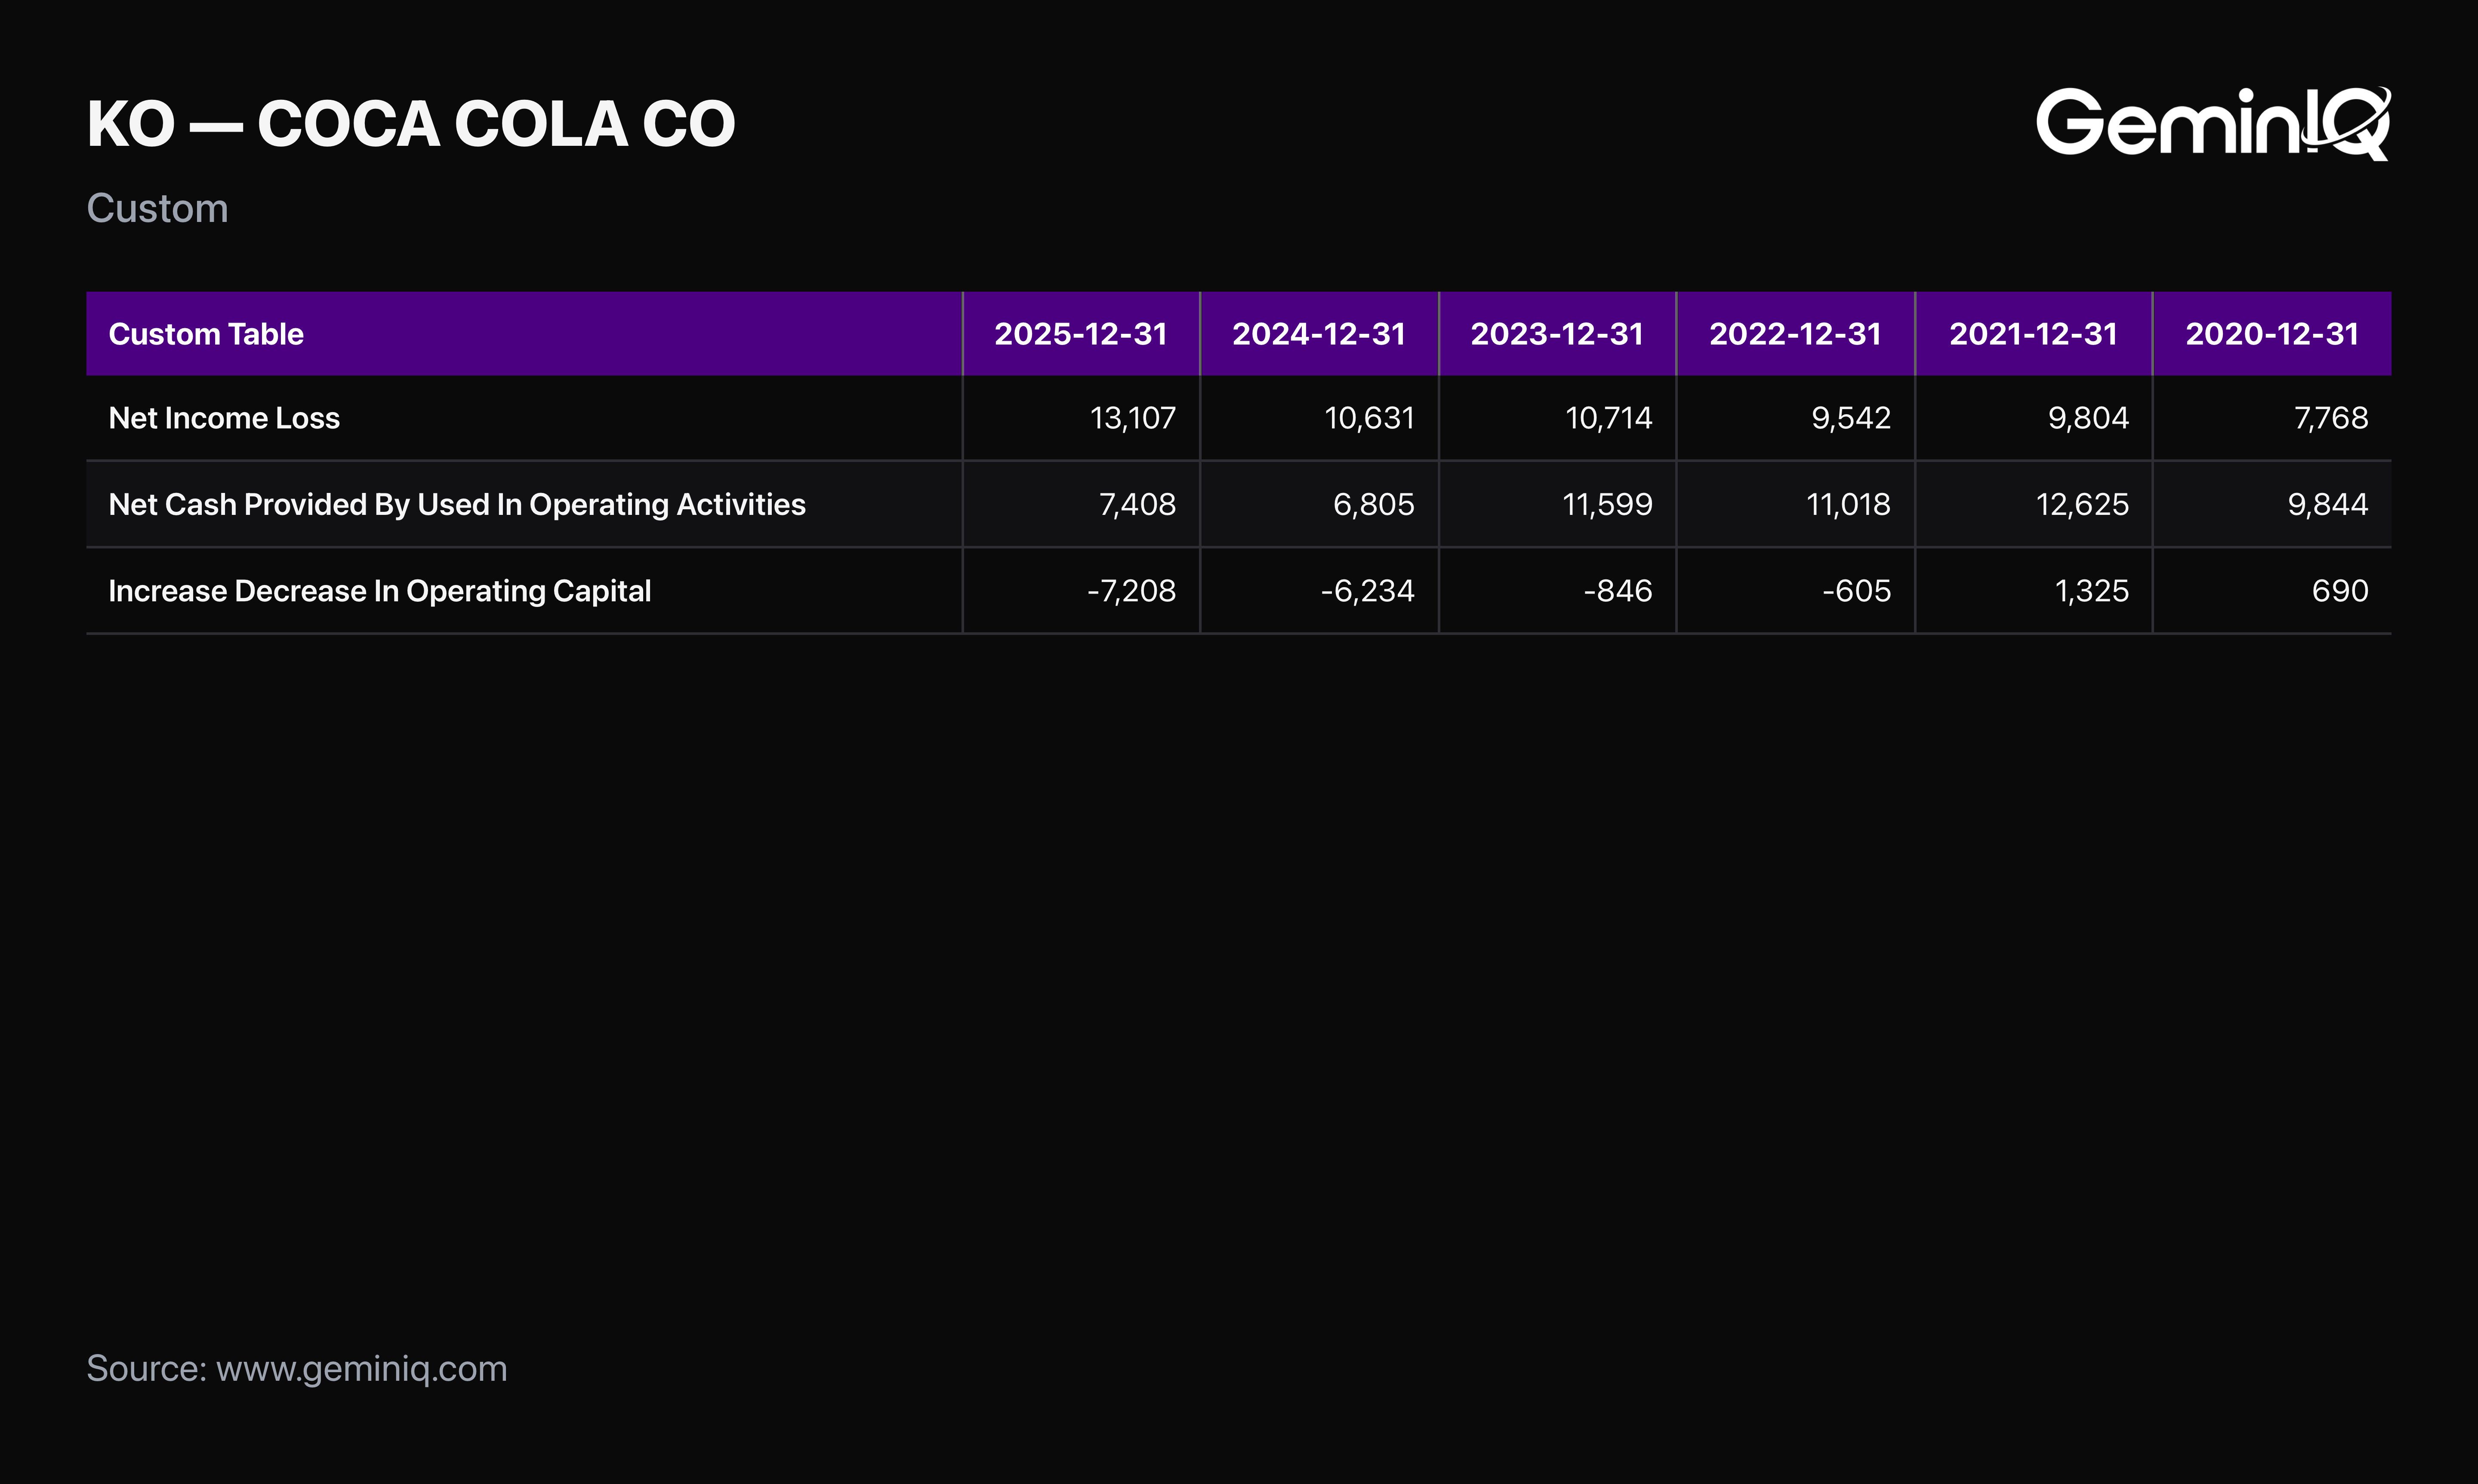
The Data: Net Cash Provided By Operating Activities totaled $7.41 Billion against net income of $13.11 Billion — a conversion rate of 56.5%. That figure has fallen every year for four years. Coca-Cola converted 128.8% of net income into operating cash in FY2021, 115.5% in FY2022, and 108.3% in FY2023, before dropping to 64.0% in FY2024 and 56.5% in FY2025. A business that reliably produced more cash than accounting profit now produces materially less.
The line responsible sits directly on the cash flow statement. Net Change In Operating Assets And Liabilities, filed as Increase Decrease In Operating Capital, drained $7.21 Billion in FY2025 after draining $6.23 Billion in FY2024. Two consecutive years of outflows at that scale removed roughly $13.4 Billion of cash the income statement had already booked as profit.
The GeminIQ Edge: Most platforms display net income and operating cash flow on separate screens, which makes a widening gap between them nearly invisible. Read both statements as filed, in the same view, and a four-year conversion decline stops being a footnote and becomes the headline.
The Dividend Gap Nobody Prices In
This is where the two statements collide, and where one of the market's most trusted dividend records meets an arithmetic problem.
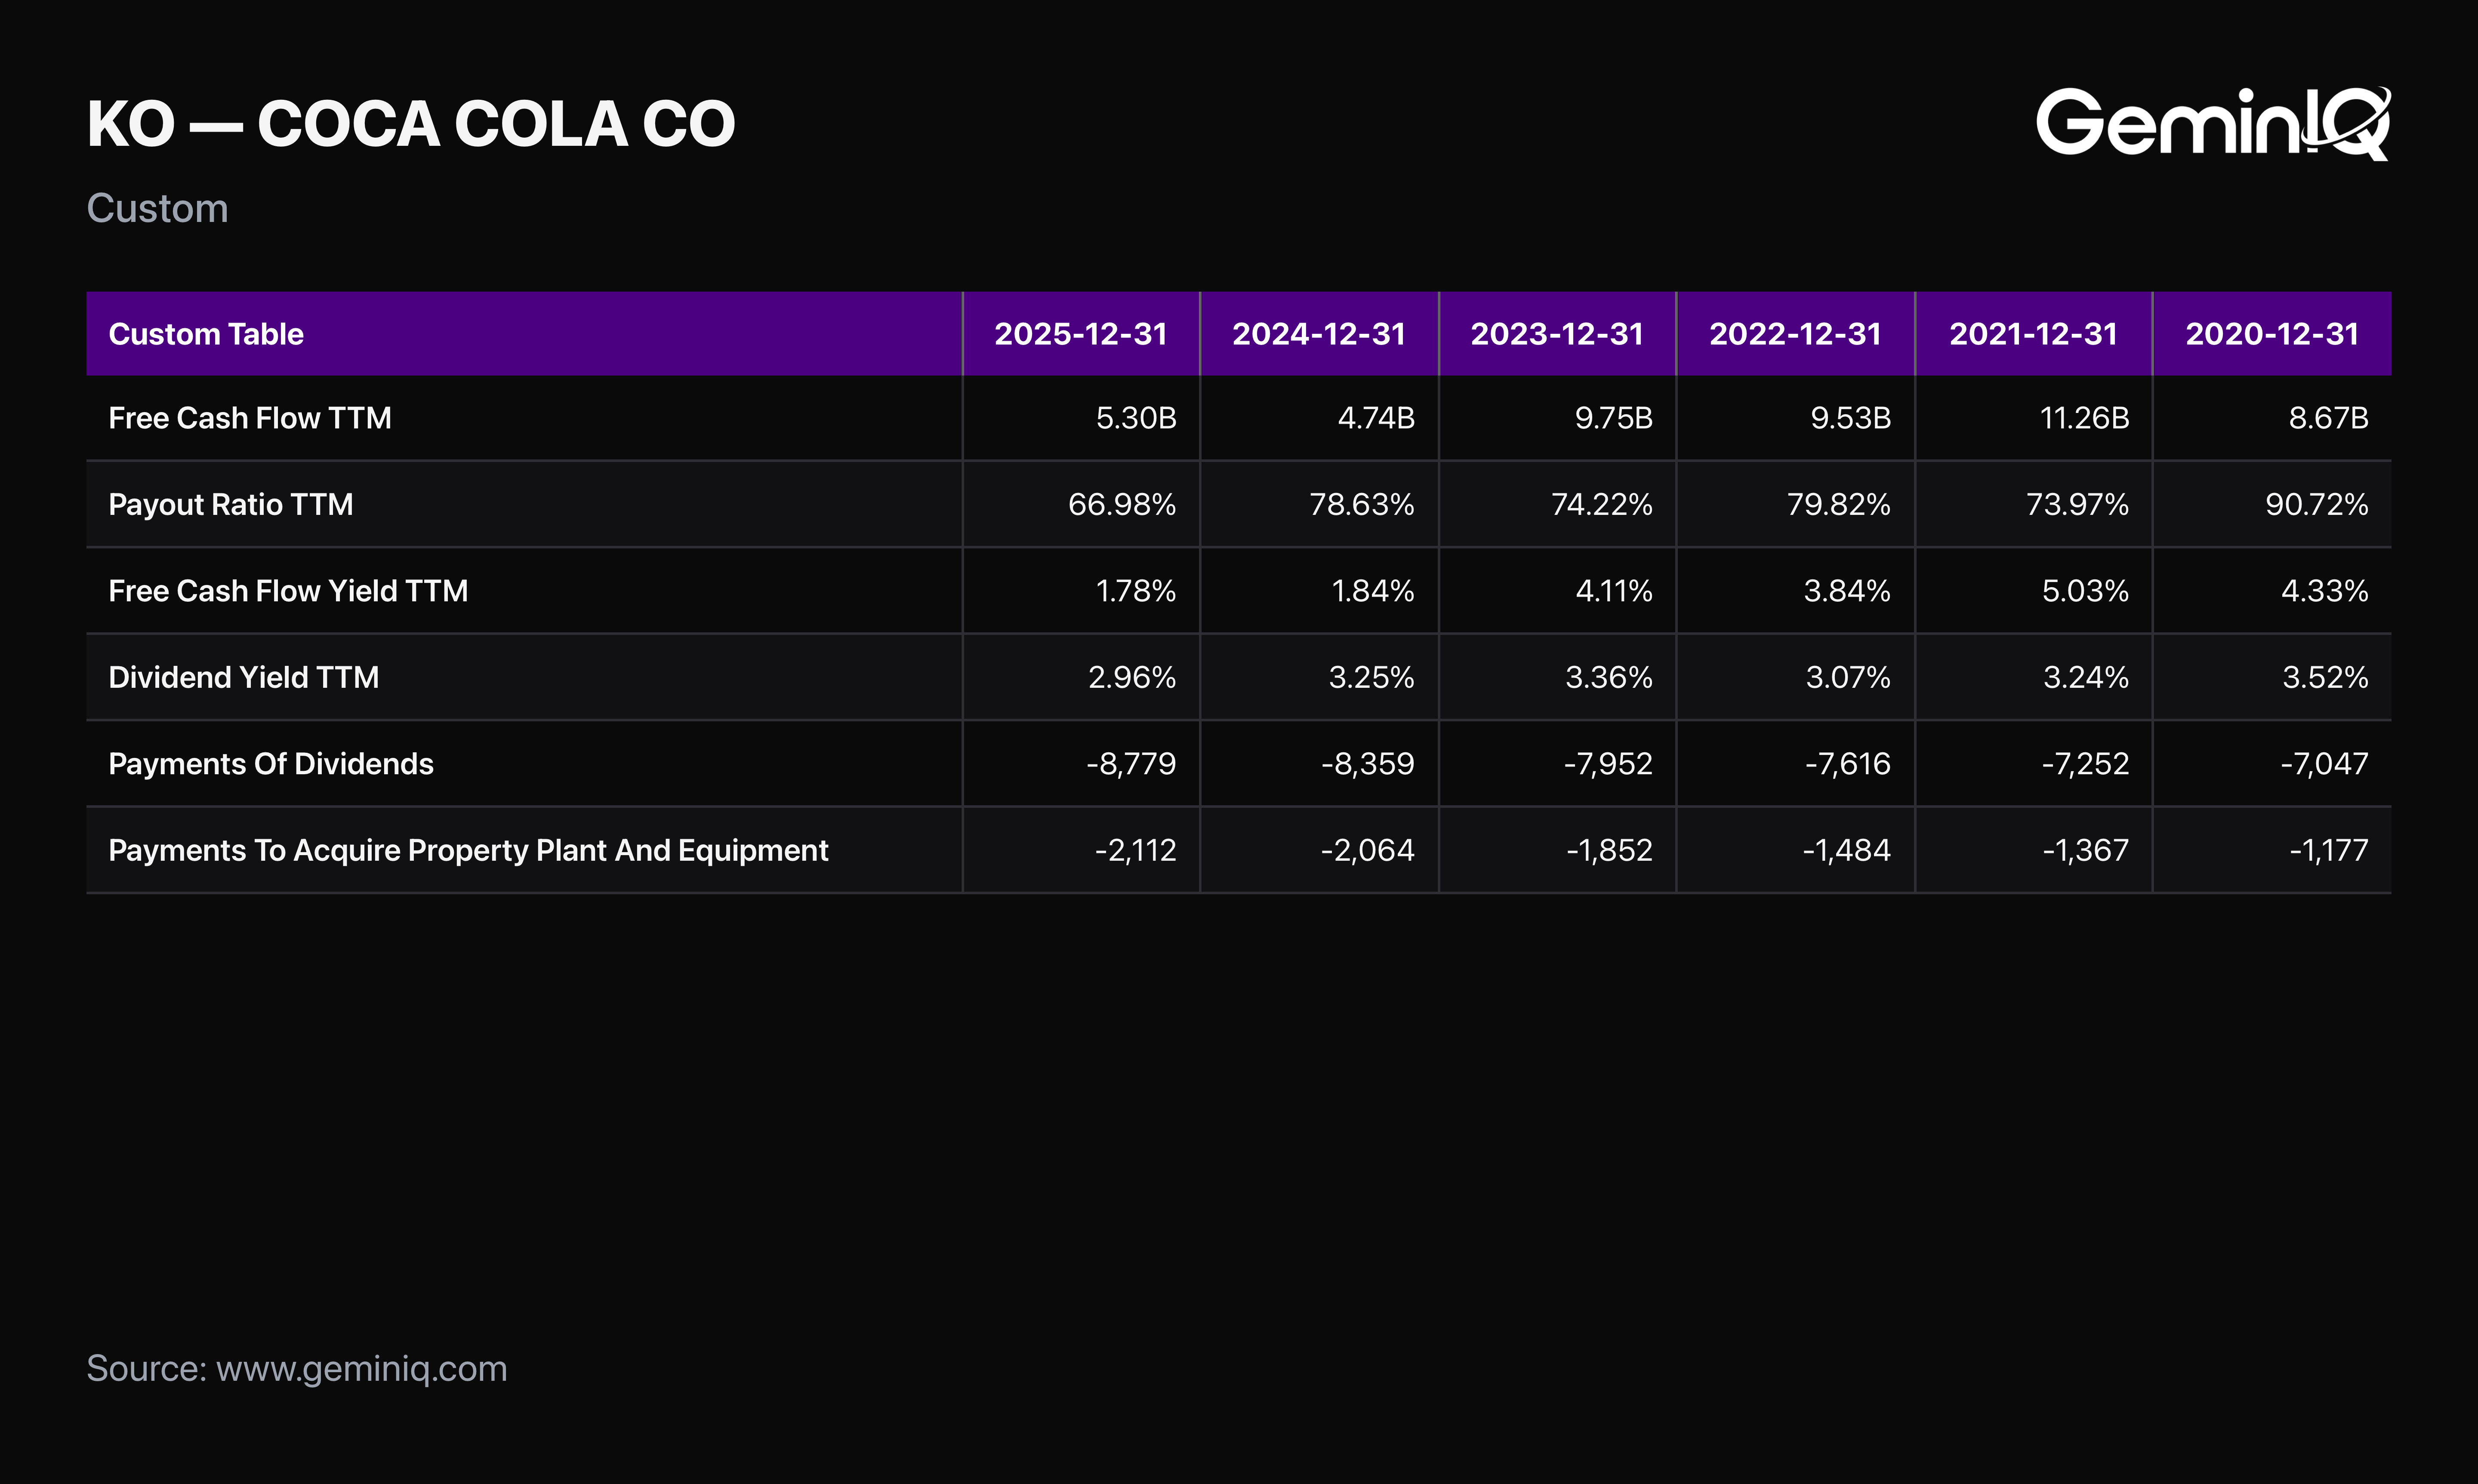
The Data: GeminIQ's pre-calculated Free Cash Flow for FY2025 is $5.30 Billion — operating cash flow of $7.41 Billion less Purchases Of Property, Plant And Equipment of $2.11 Billion. Payments Of Dividends for the same year totaled $8.78 Billion. The dividend exceeded free cash flow by $3.48 Billion, for coverage of 0.60x. FY2024 was worse at 0.57x, a shortfall of $3.62 Billion. In each of the five fiscal years before that, coverage ranged between 1.23x and 1.55x.
The metric most dividend screeners display for Coca-Cola tells the opposite story. GeminIQ's Payout Ratio reads 66.98% on a TTM basis, comfortably inside the range investors treat as sustainable — because it measures dividends against accounting earnings, not against cash. The same divergence runs through the yields. Free Cash Flow Yield sits at 1.78% while Dividend Yield sits at 2.96%. Shareholders are collecting a yield larger than the one the business produced.
The GeminIQ Edge: An earnings-based payout ratio of 66.98% and a cash-based coverage ratio of 0.60x describe the same dividend, in the same company, in the same year. Only one of them is built from the cash flow statement.
What Funded the Difference
A dividend that outruns cash flow for two years has to be paid from somewhere else. The financing and investing sections name the sources.
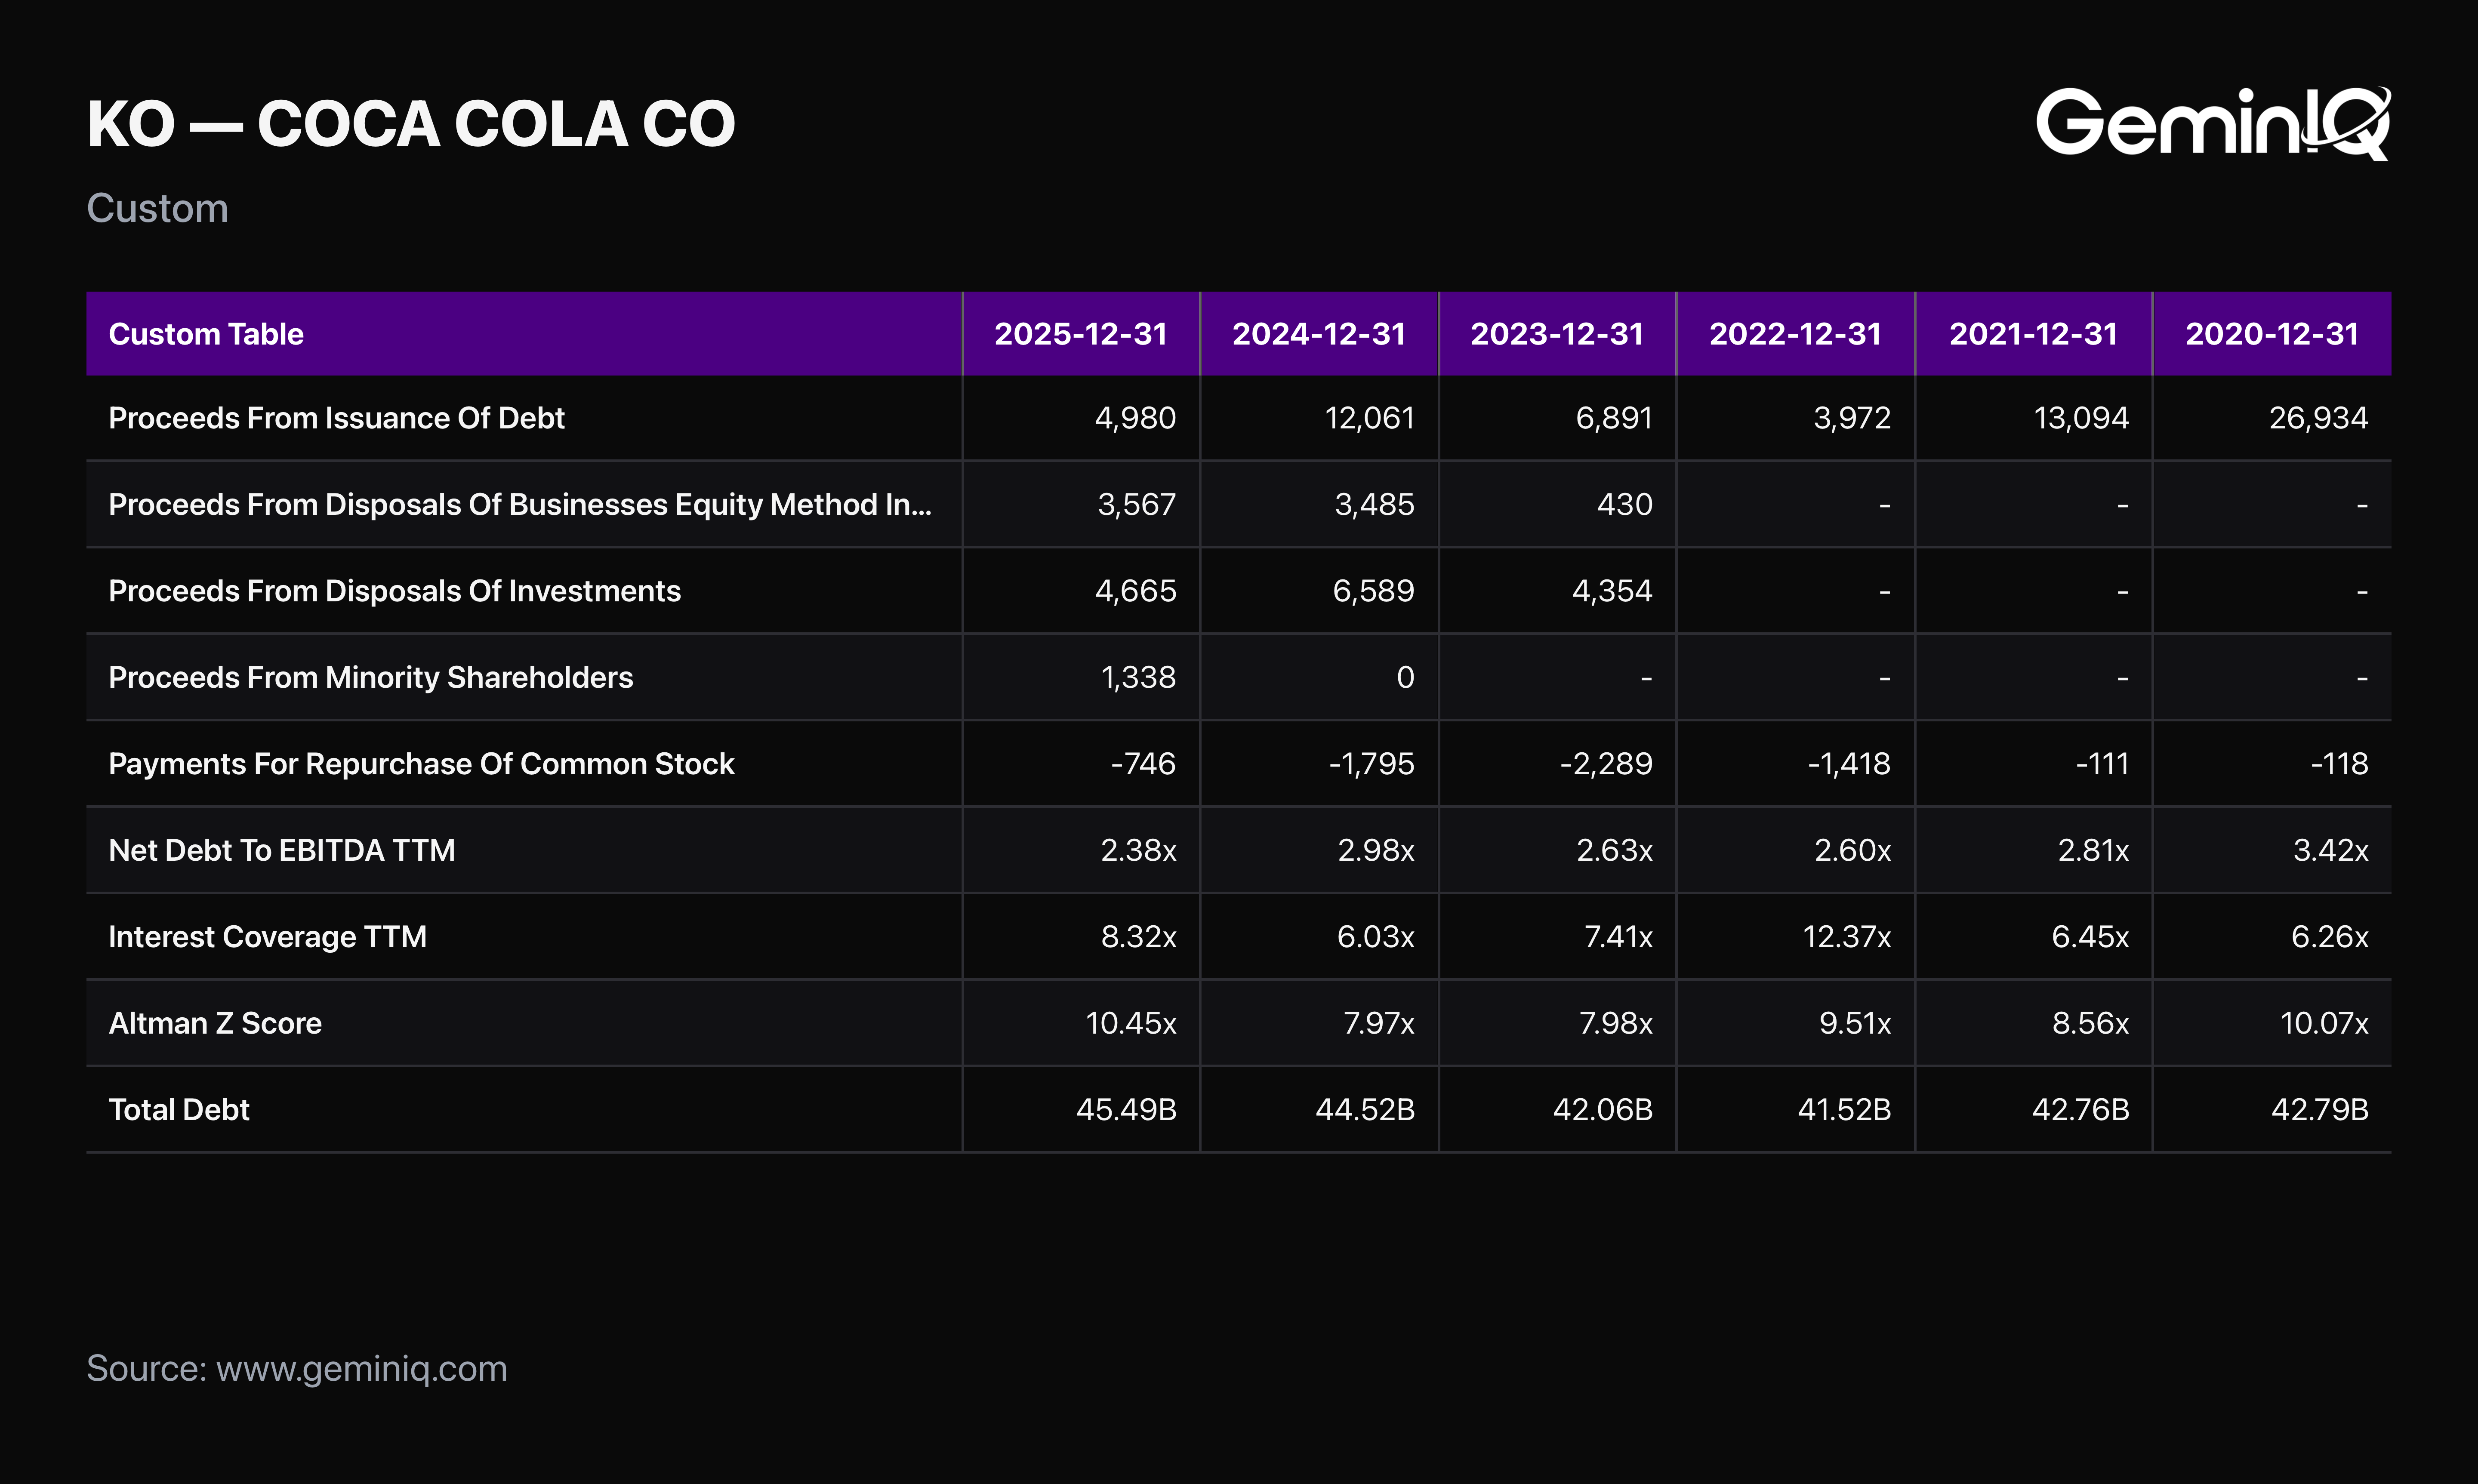
The Data: Proceeds From Issuance Of Debt brought in $4.98 Billion during FY2025. Asset sales supplied more: Proceeds From Disposals Of Businesses, Equity Method Investments And Nonmarketable Securities added $3.57 Billion, Proceeds From Disposals Of Investments another $4.67 Billion, and Proceeds From Minority Shareholders a further $1.34 Billion. The buyback absorbed the rest of the pressure. Payments For Repurchase Of Common Stock fell to $746 Million from $1.80 Billion, a reduction of 58.4%.
The balance sheet took this without visible stress, which is the part that keeps the story from being a distress story. Coca-Cola's total debt stands at $45.49 Billion and net debt at $35.22 Billion, yet GeminIQ's Net Debt to EBITDA improved to 2.38x from 2.99x, because EBITDA rose faster than borrowings. The Interest Coverage Ratio strengthened to 8.32x from 6.03x, and the Altman Z-Score sits at 10.45, deep in the safe zone.
The GeminIQ Edge: Coca-Cola is not a company in financial difficulty, and the leverage metrics say so plainly. What the filing shows is narrower and more specific. The dividend is currently funded by borrowings and asset sales rather than by operations, and a 58.4% cut to the buyback is the visible price of holding that line.
Smart Money and the Insider Record
What are the people actually running the company doing with their own money?
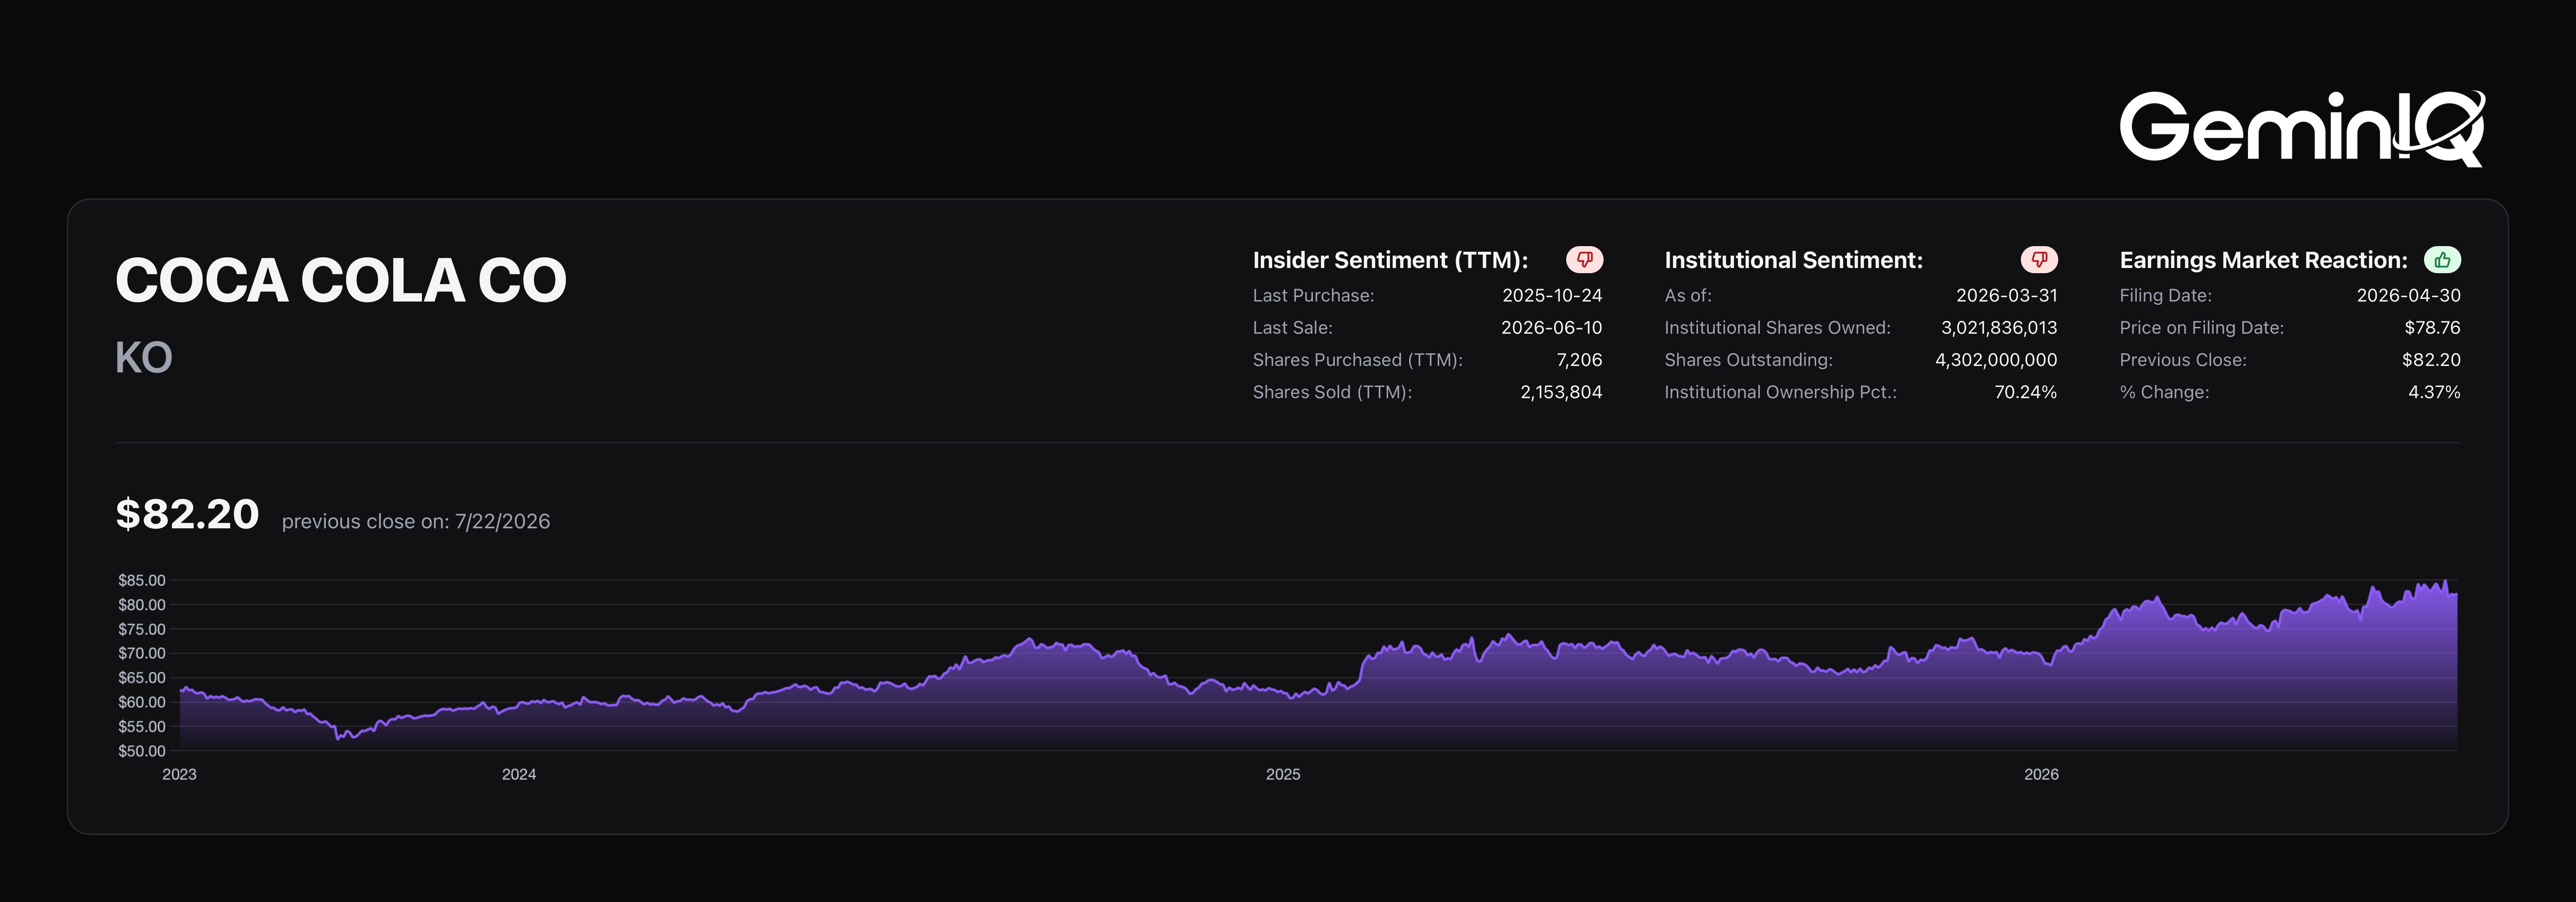
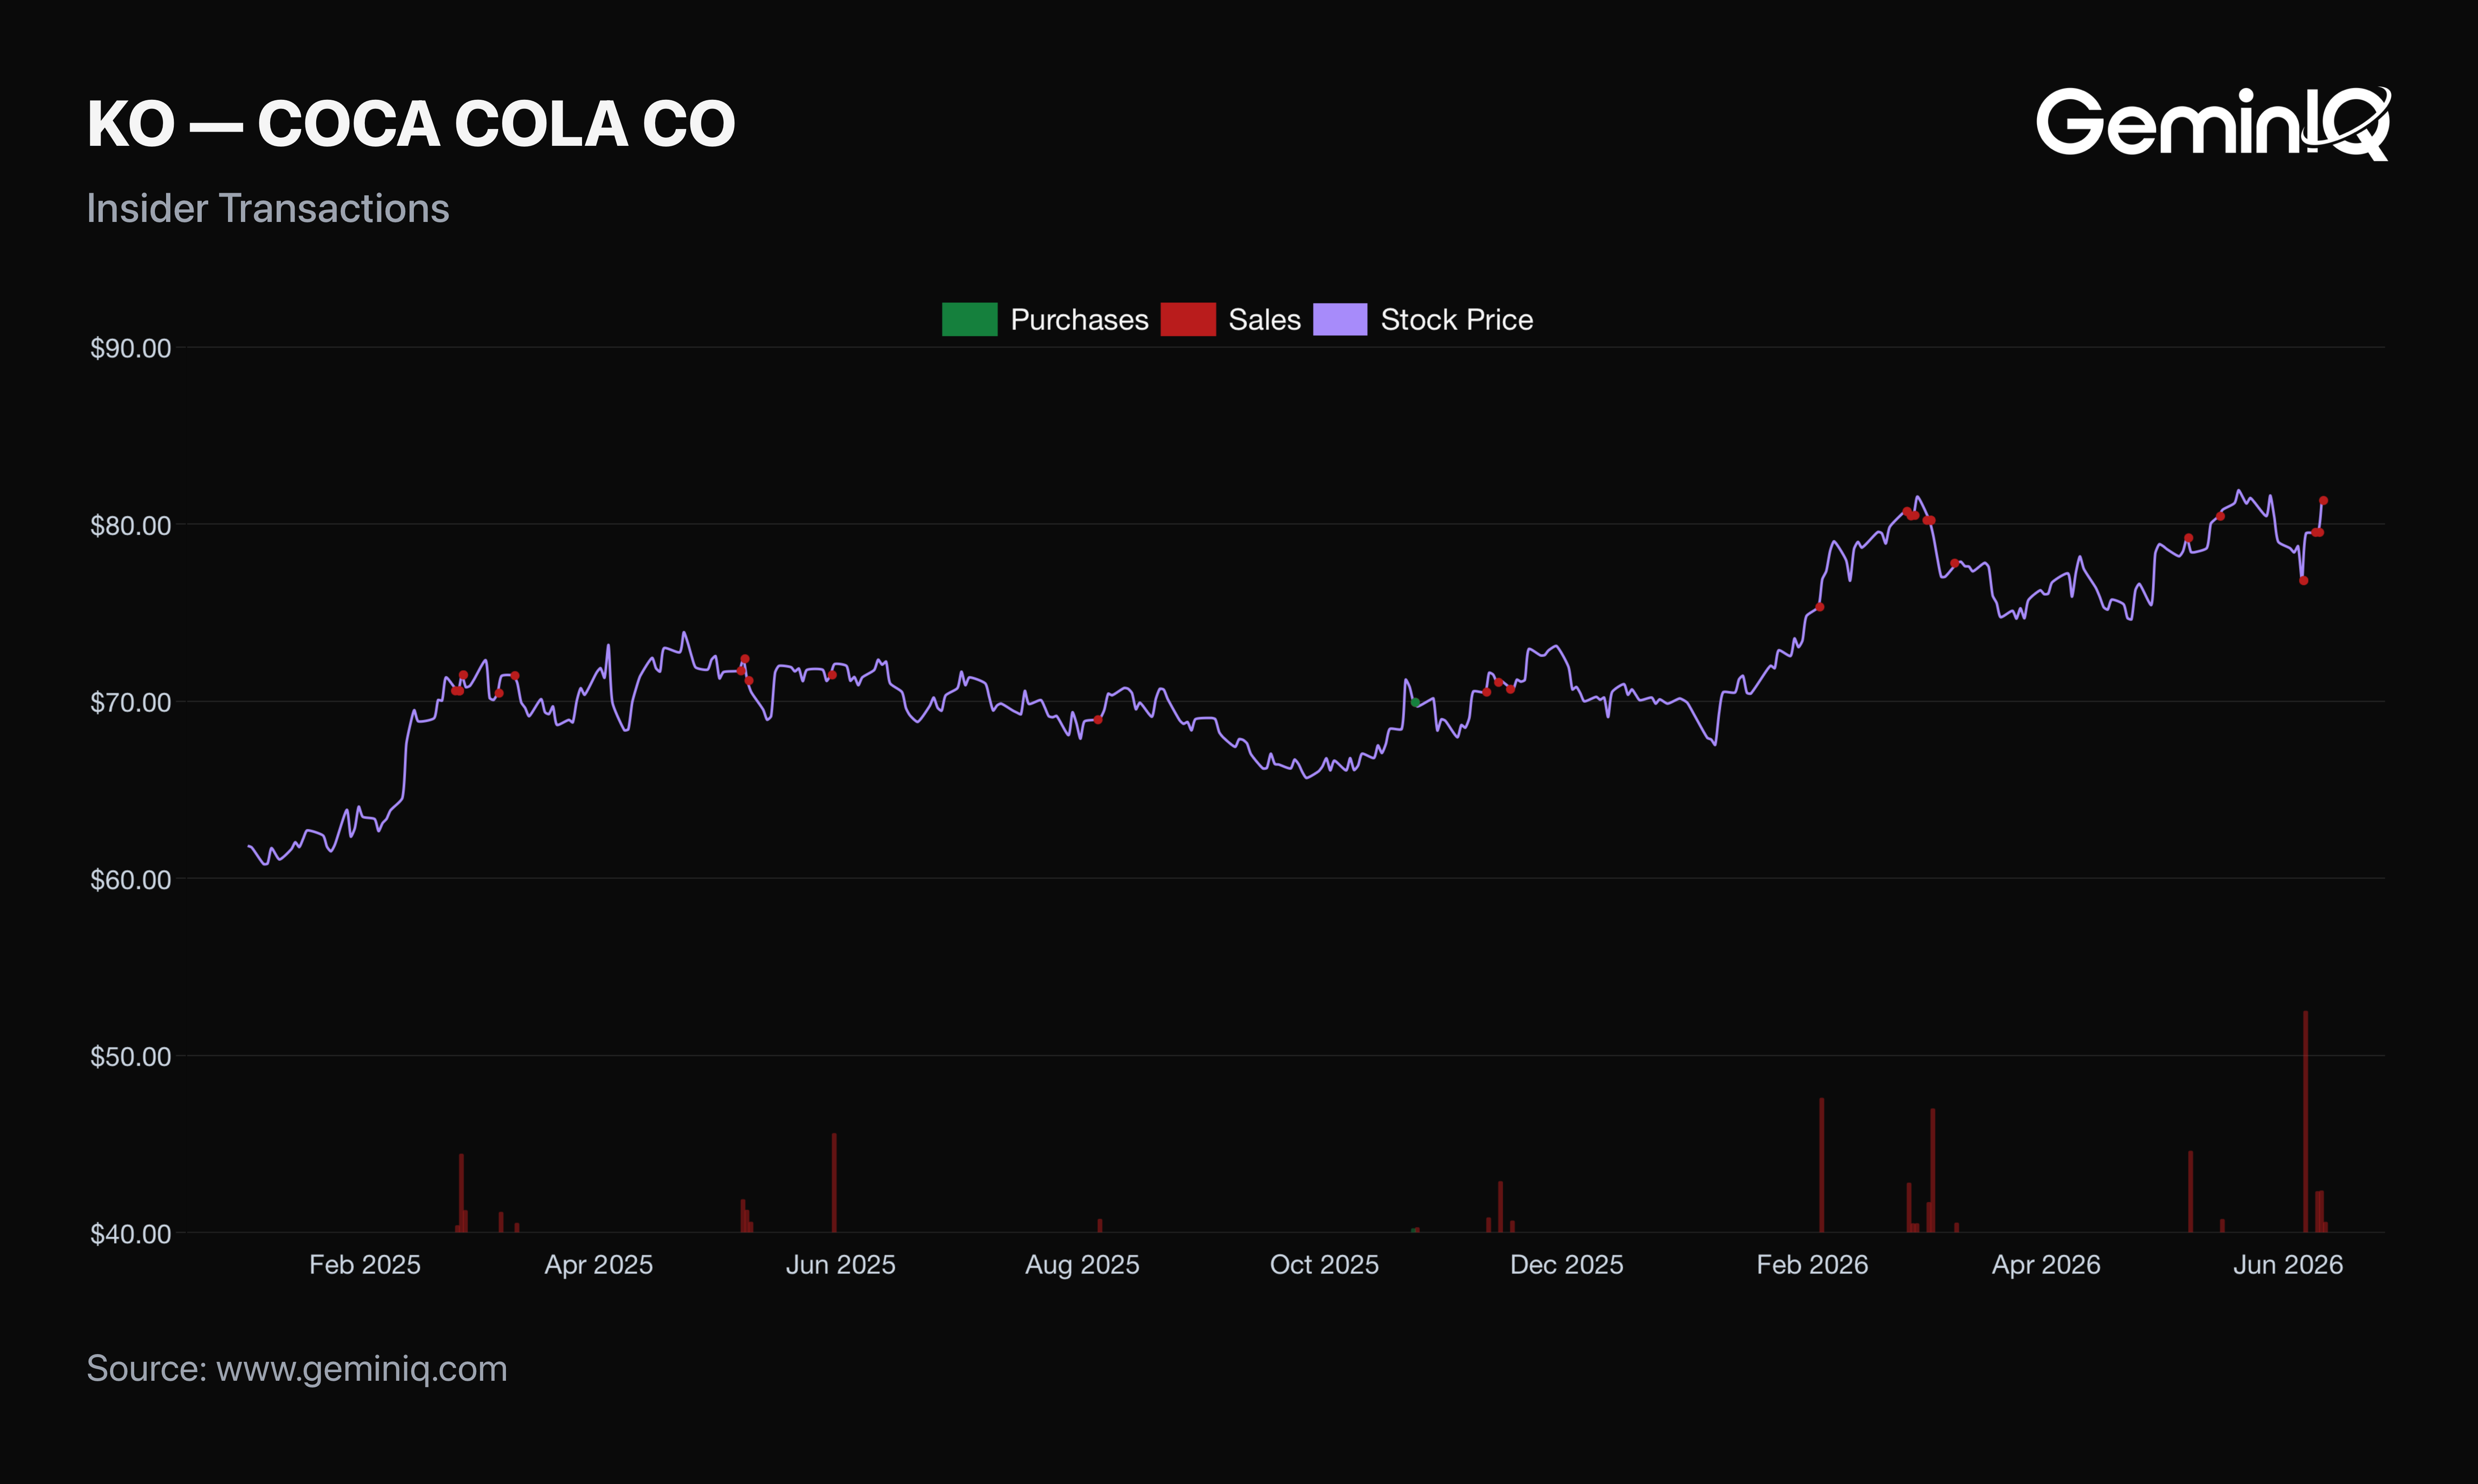
The Data: Since January 1, 2025, GeminIQ's Insider Transactions records 36 sale filings by Coca-Cola insiders totaling $228.94 Million, against 2 purchases totaling $998 Thousand — a ratio of roughly 229 to 1 by dollar value. Both purchases came from a single Director in October 2025, at $70.09 and $69.87 per share. The largest sale on file is 436,296 shares by the Chairman at $80.13 on June 5, 2026, for $34.96 Million, followed by 337,824 shares by the Chairman and CEO at $77.10 on February 3, 2026, for $26.05 Million.
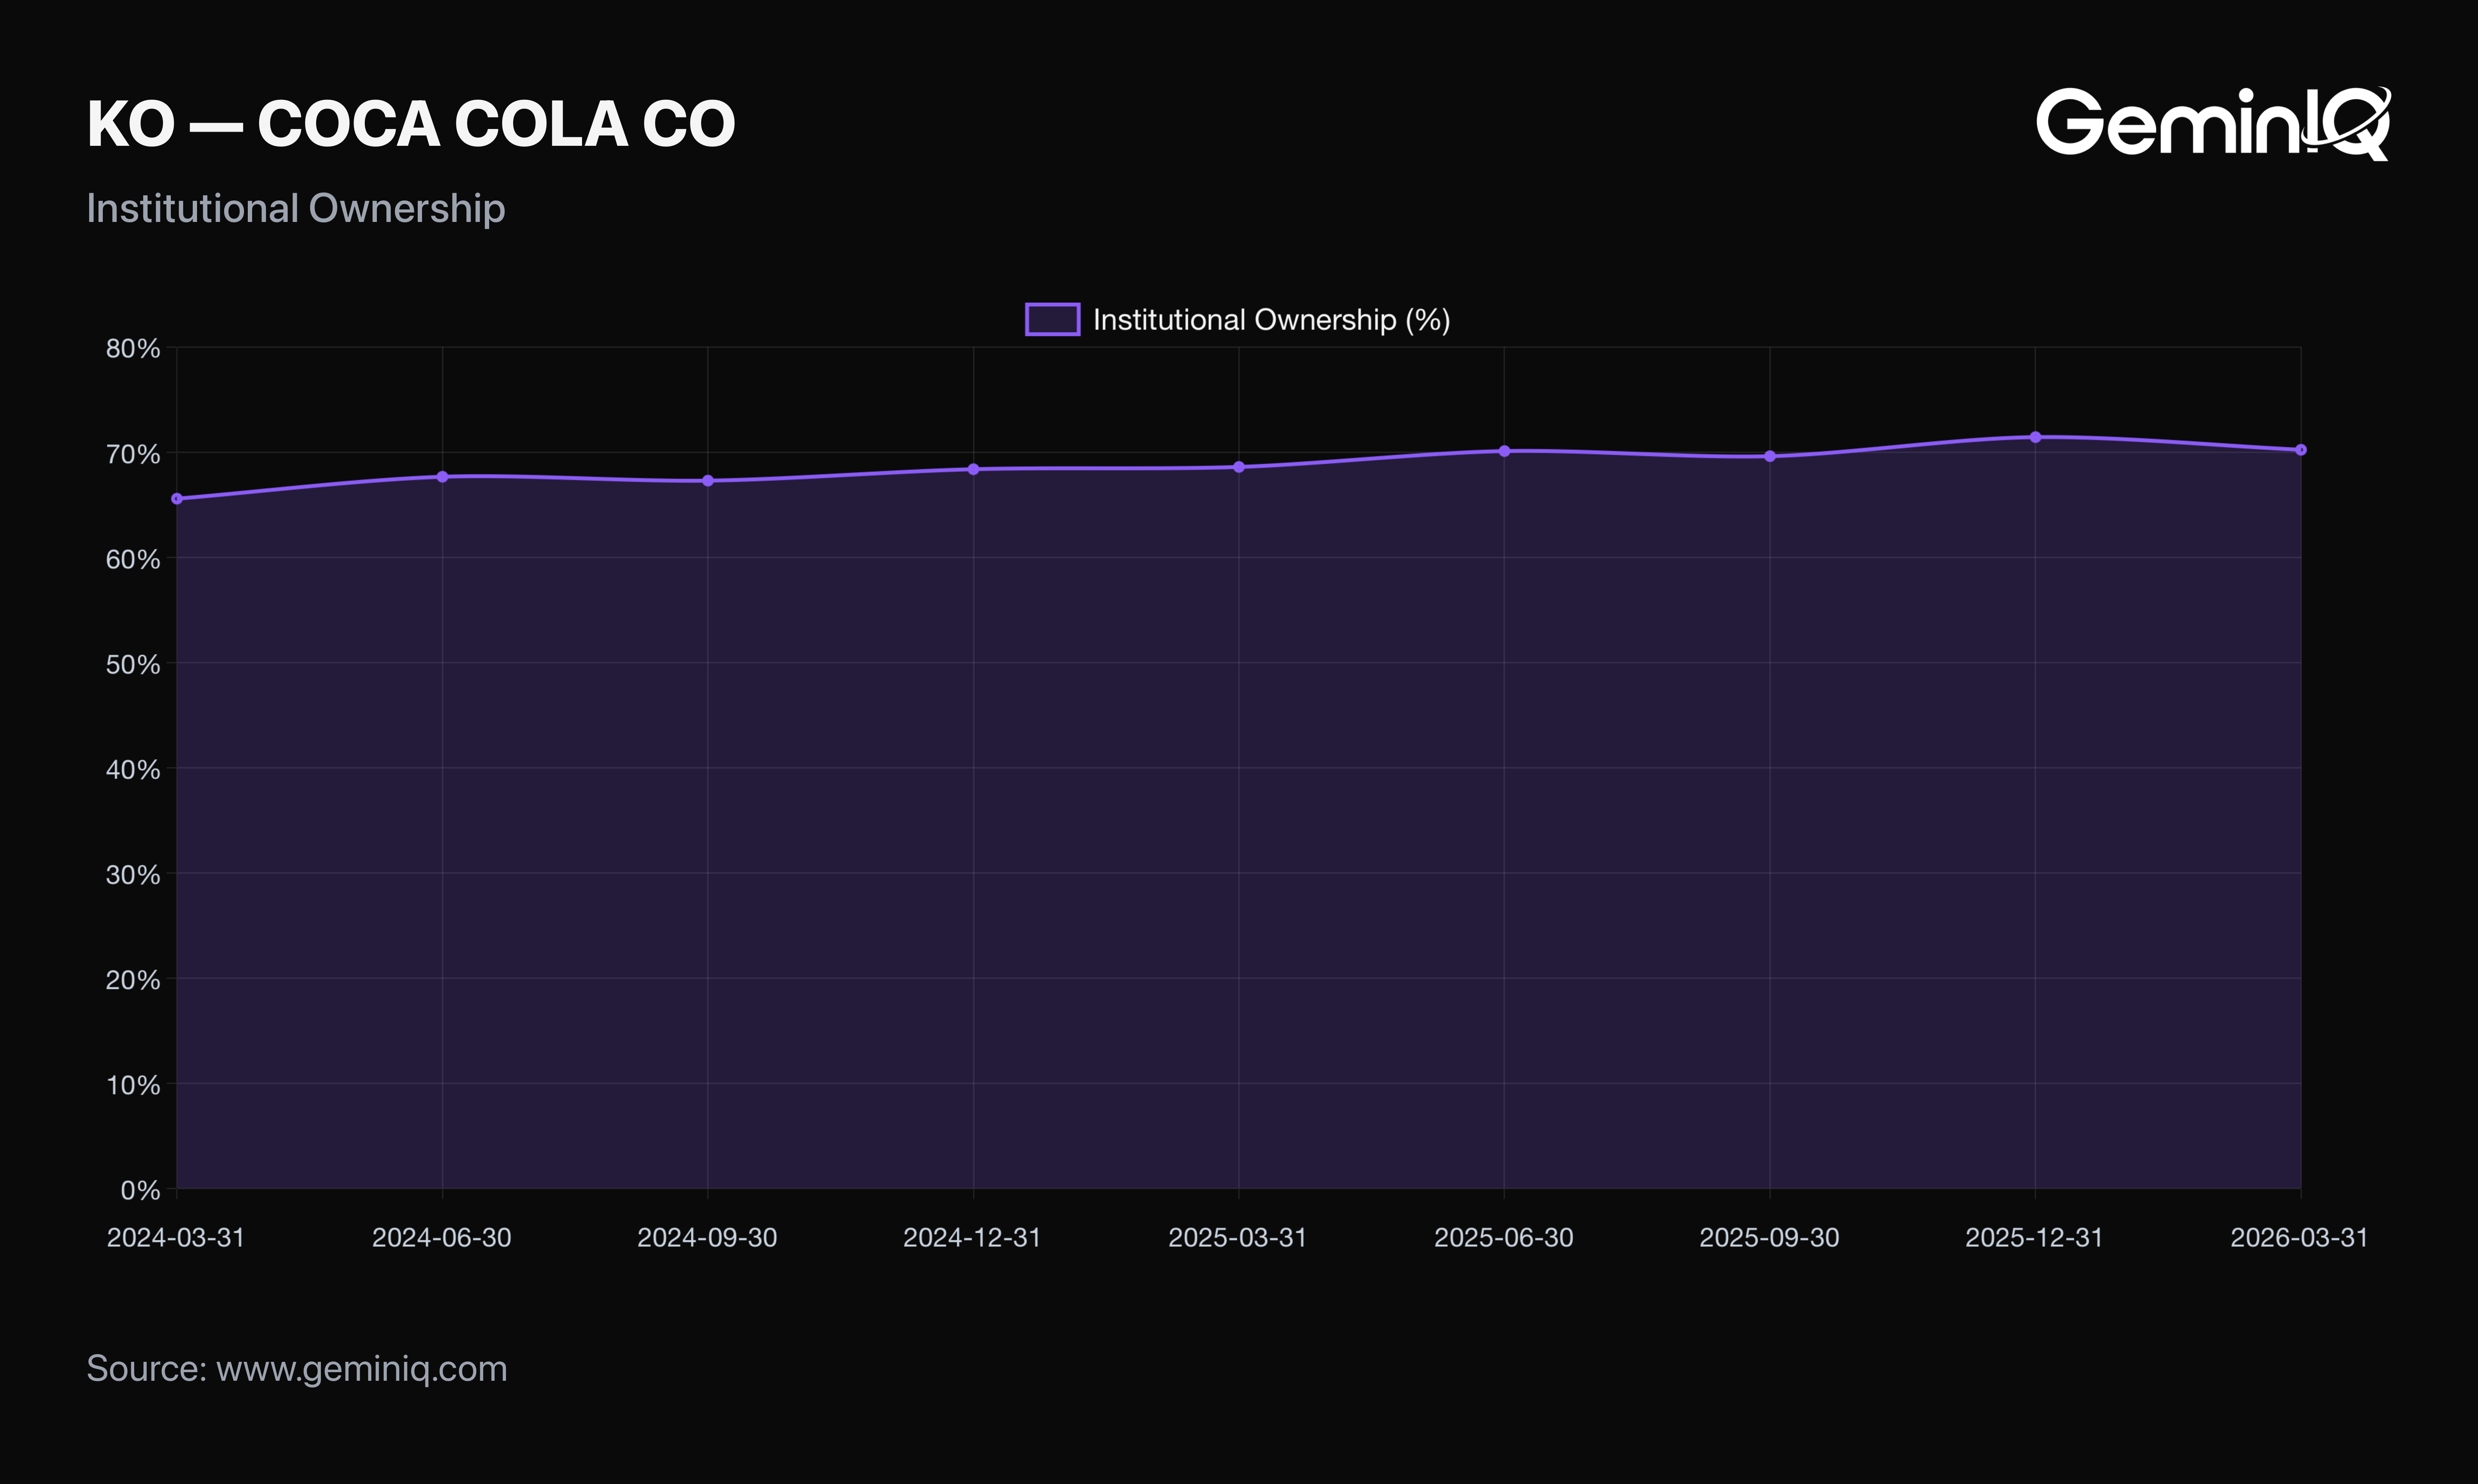
Institutional positioning moved the other way. Institutional Ownership rose to 71.45% of shares outstanding as of the quarter ending December 31, 2025, then eased to 70.24% as of March 31, 2026. Both figures come from quarterly 13F filings, so they describe positioning as of those quarter-ends rather than current holdings.
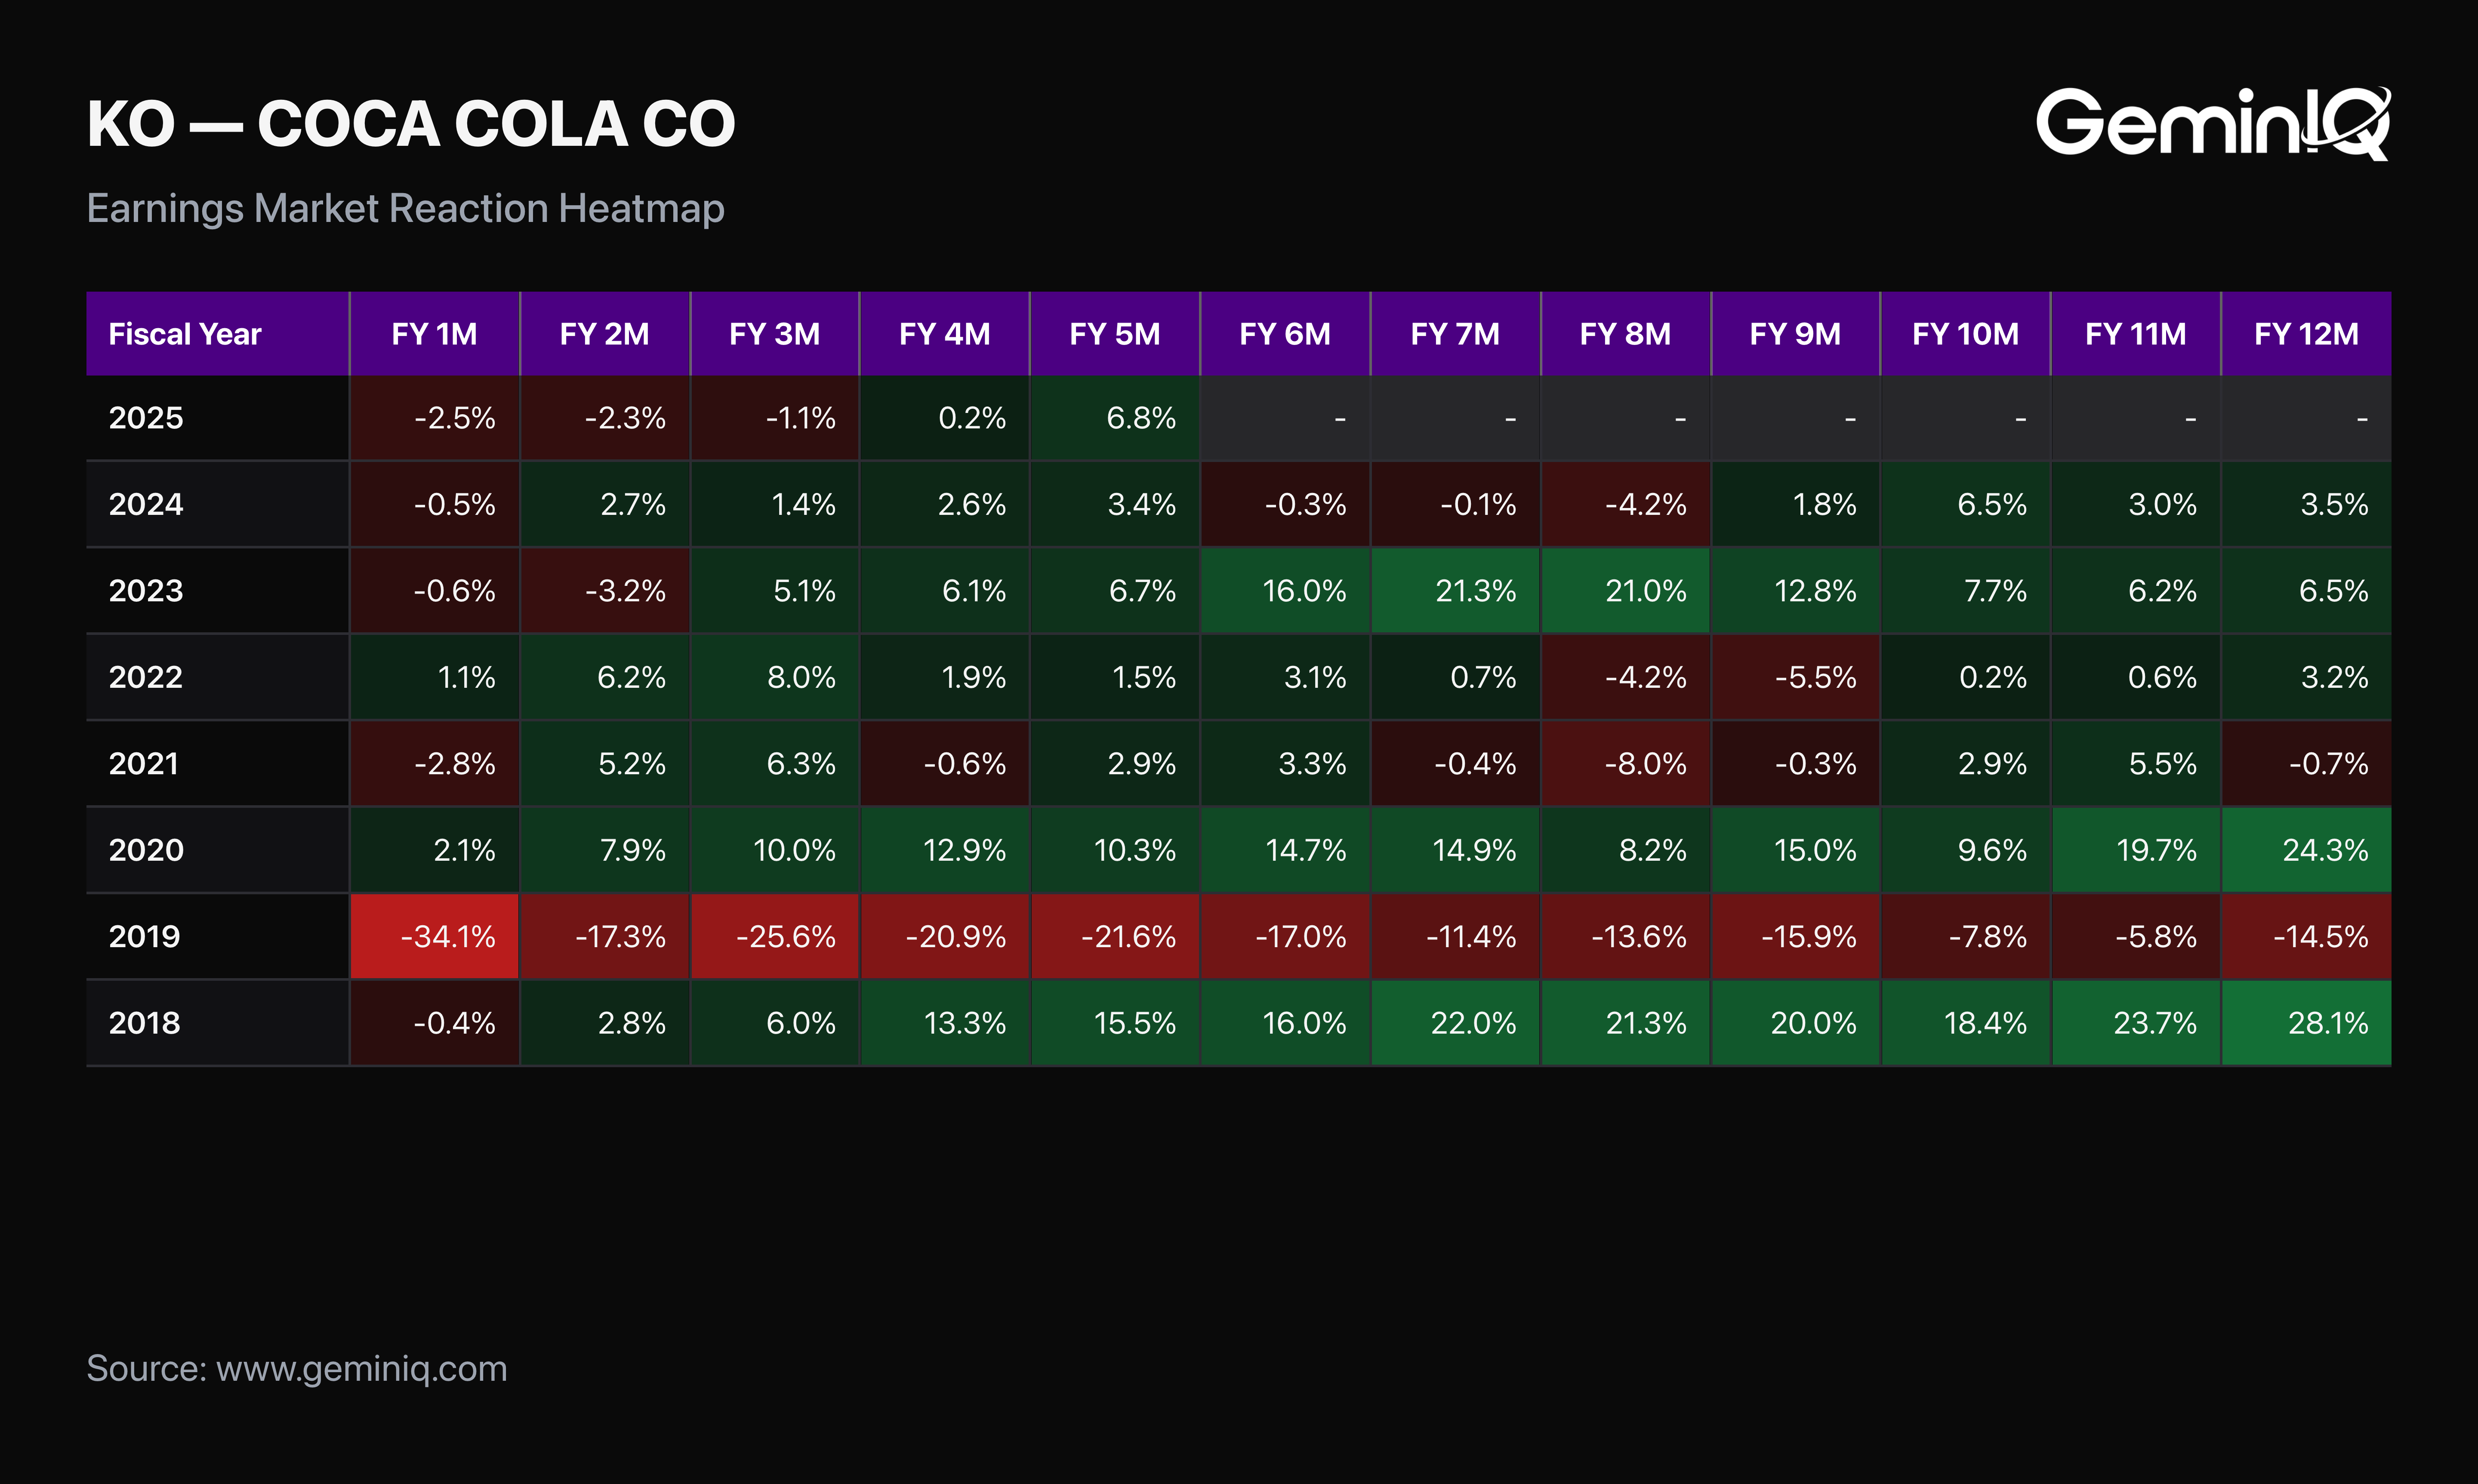
The GeminIQ Edge: Insider selling at a large-cap dividend name is routine and heavily scheduled, which is exactly why the dollar ratio matters more than the raw count. What followed the filing is the more useful record: GeminIQ's Earnings Market Reaction Heatmap shows the stock down 2.47% one month after this 10-K was filed and down 1.10% at three months, before turning to +6.80% at five months. The full twelve-month window has not yet elapsed.
Frequently Asked Questions
What does Coca-Cola's FY2025 10-K show?
Coca-Cola's FY2025 annual report shows Net Operating Revenues of $47.94 Billion, Operating Income of $13.76 Billion, and a 28.7% operating margin — the strongest income statement the company has posted in over a decade. The cash flow statement tells a different story: free cash flow of $5.30 Billion did not cover $8.78 Billion in dividends paid.
What is KO's free cash flow?
Coca-Cola's FY2025 free cash flow was $5.30 Billion, down sharply relative to its earnings. Free cash flow is operating cash flow less capital expenditures, both taken directly from the cash flow statement in the 10-K. That figure sits $3.48 Billion below the dividends the company paid in the same year.
Where can I find the KO annual report?
Coca-Cola files its annual report as a Form 10-K with the SEC, available on EDGAR and filed February 20, 2026 for FY2025. Every figure in this analysis is drawn from that filing via its XBRL tags rather than a third-party data feed.
Did Coca-Cola cover its dividend in FY2025?
Not from free cash flow. The FY2025 10-K shows free cash flow of $5.30 Billion against $8.78 Billion in Payments Of Dividends, a shortfall of $3.48 Billion and coverage of 0.60x. FY2024 showed a similar gap at 0.57x. The company covered the difference with debt issuance, asset disposals, and a 58.4% reduction in share repurchases.
Why does Coca-Cola's payout ratio look healthy?
Because the standard payout ratio measures dividends against accounting earnings rather than cash. GeminIQ's Payout Ratio reads 66.98% TTM, while cash-based coverage reads 0.60x. The gap between those two numbers is the same gap between net income of $13.11 Billion and operating cash flow of $7.41 Billion.
What caused Coca-Cola's cash conversion to fall?
Net Change In Operating Assets And Liabilities, filed as Increase Decrease In Operating Capital, drained $7.21 Billion in FY2025 and $6.23 Billion in FY2024. Operating cash flow converted 56.5% of net income in FY2025, down from 108.3% in FY2023.
Is Coca-Cola's balance sheet under stress?
The leverage metrics say no. Net Debt to EBITDA improved to 2.38x from 2.99x, interest coverage strengthened to 8.32x, and the Altman Z-Score sits at 10.45. The FY2025 filing describes a funding-mix question rather than a solvency question.
How can I check dividend coverage on my own holdings?
Compare GeminIQ's pre-calculated Free Cash Flow against Payments Of Dividends on the cash flow statement for each of the last five fiscal years, then set that ratio beside the reported payout ratio. Where the two disagree, the cash flow statement is the one built from money that actually moved.
Coca-Cola's most recent annual filing is a Form 10-K filed February 20, 2026, covering the fiscal year ended December 31, 2025 (FY2025).
Wall Street's data. Main Street's price.
Institutional terminals charge thousands a year for as-filed accuracy. GeminIQ gives you the same thing for a fraction of the cost: financials built directly from raw SEC EDGAR filings, not third-party APIs, with full XBRL traceability back to the original 10-K or 10-Q. No normalized guesswork, just calculated metrics, charts, screeners, and watchlists built on numbers exactly as the company reported them. Start researching now at GeminIQ.com.
All financial figures cited in this article reference The Coca-Cola Company's FY2025 10-K (filed February 20, 2026, period ending December 31, 2025). All SEC filings are publicly available at SEC EDGAR.
Disclaimer: The content in this blog is for educational and entertainment purposes only and does not constitute financial, legal, or tax advice. Investing involves risk, including the loss of principal. The views expressed are my own and not intended as financial advice or a guarantee of future performance.