
Days Inventory Outstanding: The Gross Margin Hit

By Chad Hartman
Published · Last updated
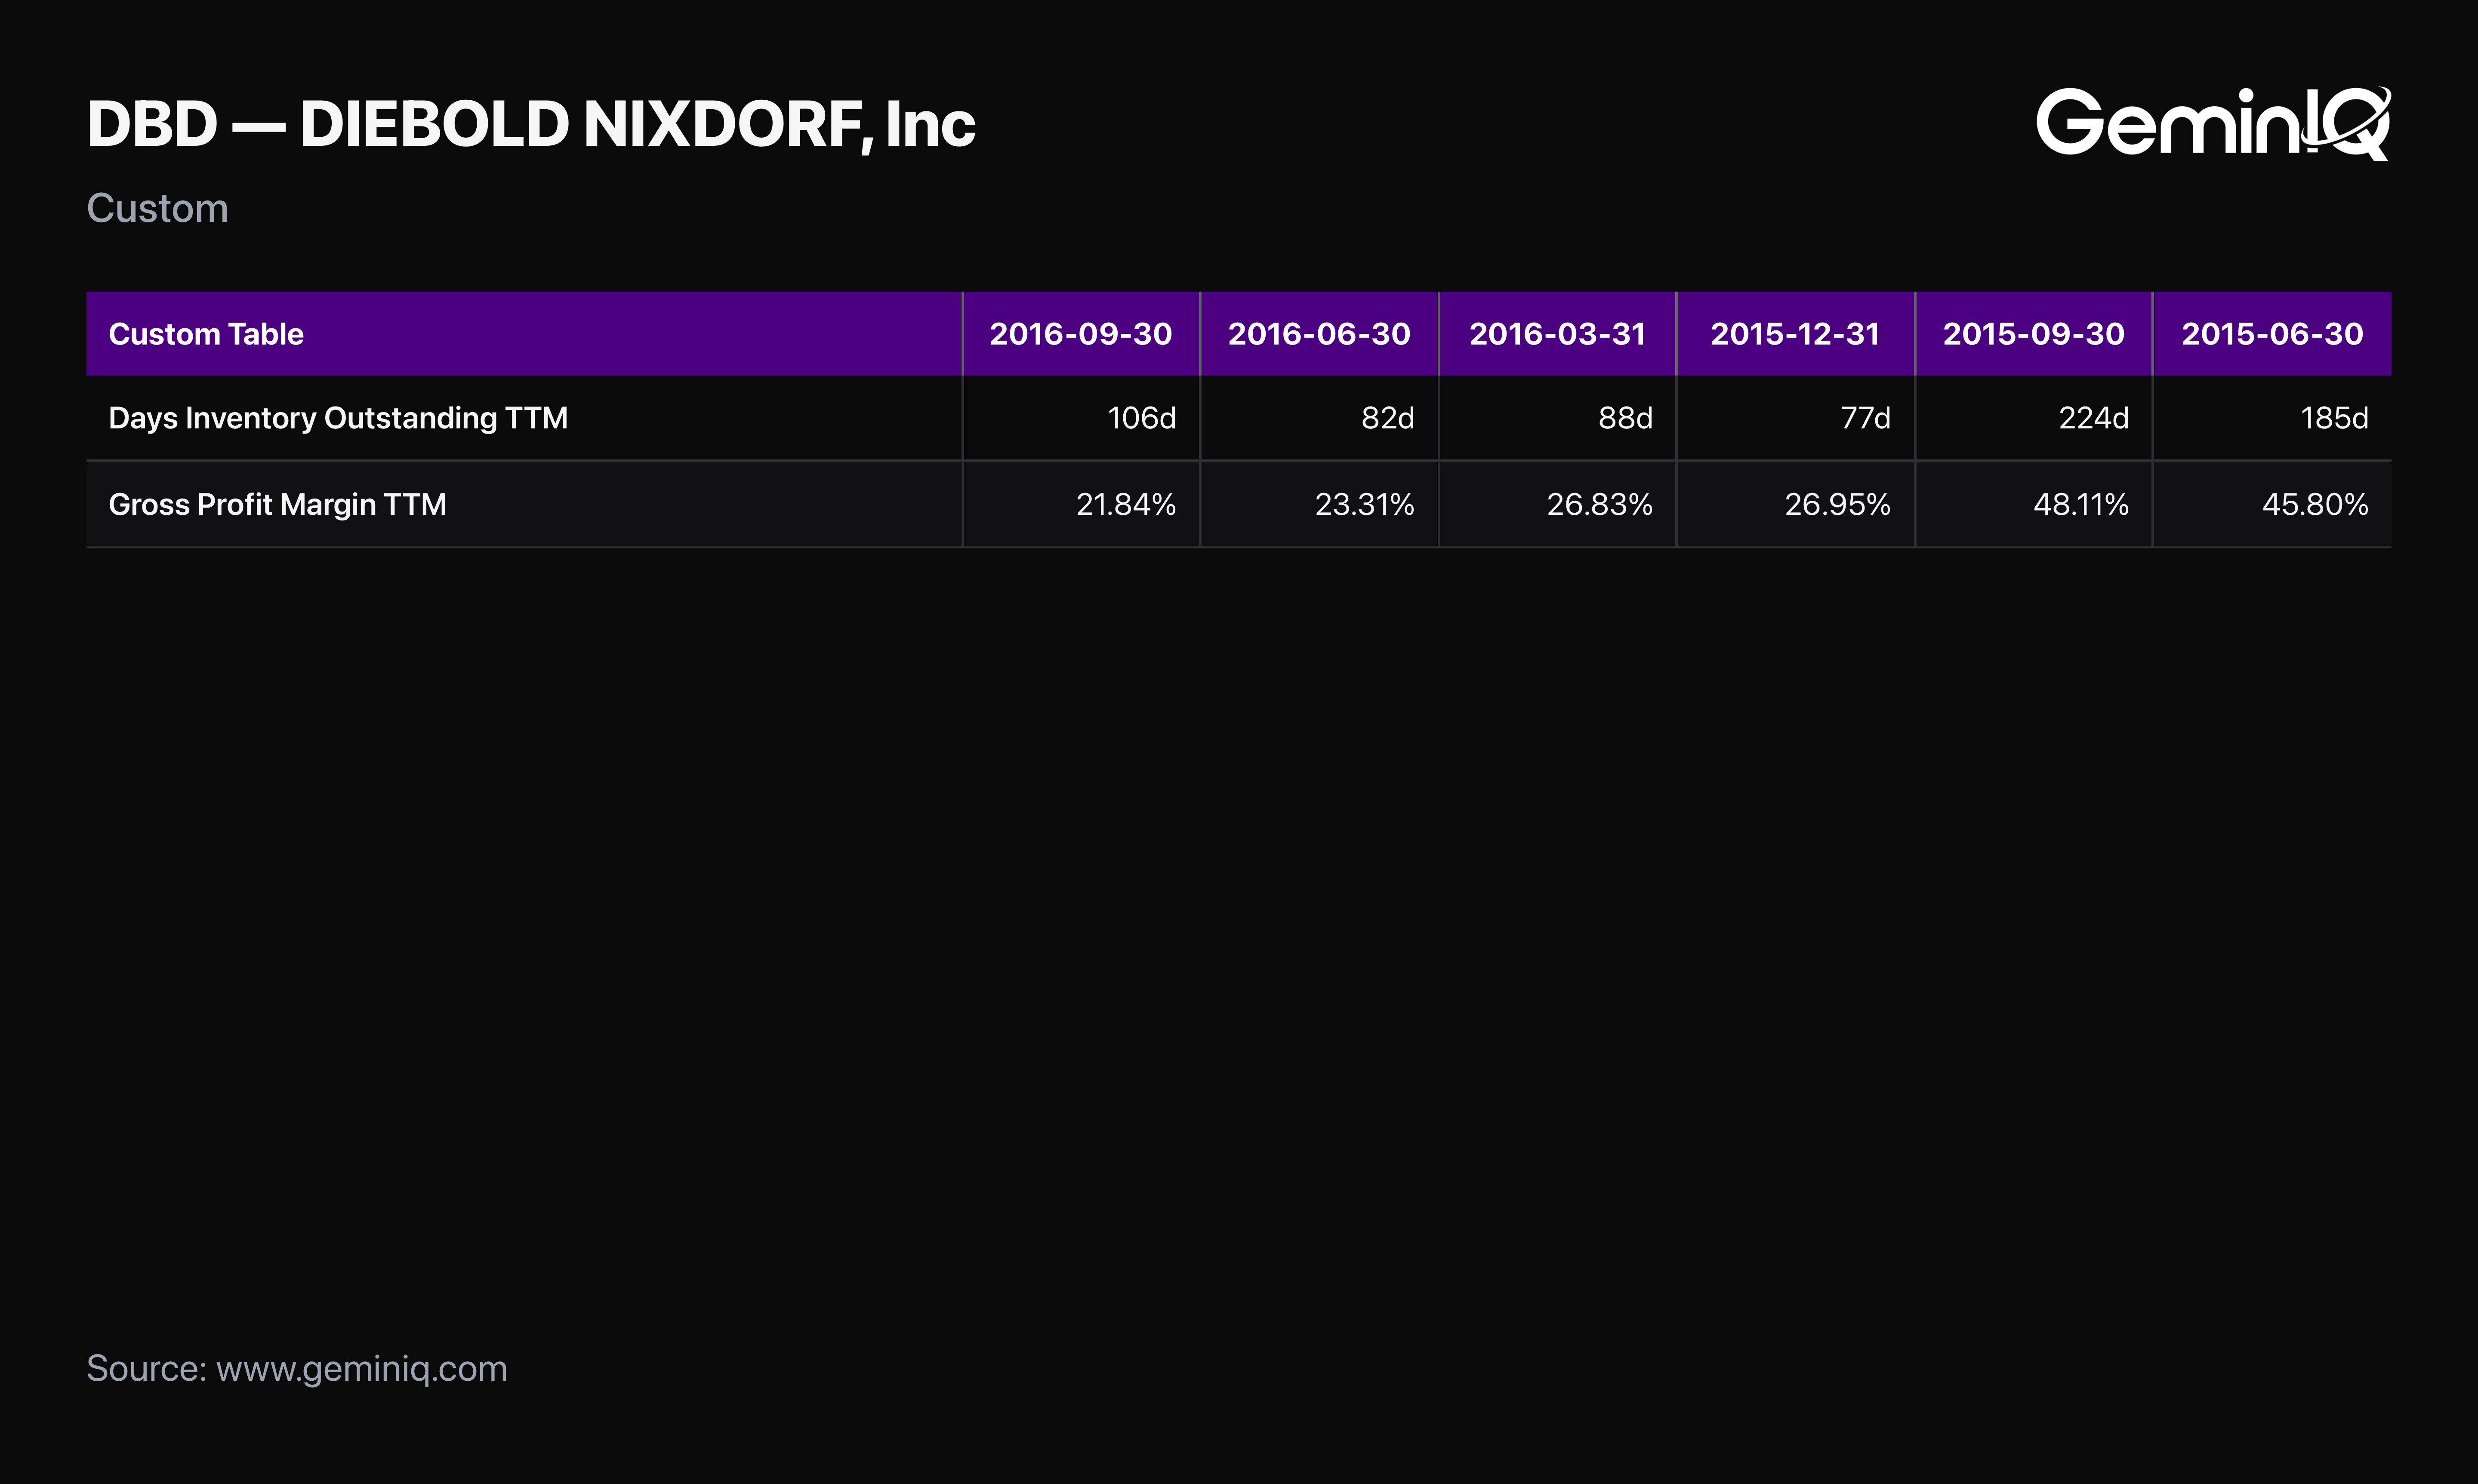
Diebold Nixdorf's Days Inventory Outstanding jumped from 69.98 days to 224.31 days — inventory that once turned over in about ten weeks was suddenly sitting on the books for more than seven months. One year later, the company's trailing gross profit margin had fallen from 48.11% to 21.84%, a decline of 26.27 percentage points. Inventory piling up isn't just a working-capital footnote. It's frequently the first visible sign that a company is about to discount its way through a glut it can't sell at full price.
This study reads GeminIQ's as-filed universe of trailing-twelve-month Days Inventory Outstanding readings, computing each company's year-over-year change in DIO and matching it to that company's own trailing gross profit margin one quarter and one year later. 90,260 filing-periods carry a valid year-over-year DIO comparison after excluding companies without a real, in-range inventory balance. That's a natural filter for inventory-carrying businesses across manufacturing, hardware, and physical-goods sectors, rather than a hand-picked sector list. This is a historical association measured over the sample window, not a forecast for any individual company.
The Pattern
Days Inventory Outstanding rising is not automatically a problem — a company can be stocking up ahead of a launch or a seasonal peak. But when DIO rises sharply relative to how the rest of the filing universe is moving in the same period, it tends to mean something specific: sales aren't clearing inventory at the pace the company expected. That gap usually gets closed with a markdown, a write-down, or both — both of which show up directly in gross margin. Whether that relationship actually holds up across thousands of filings, rather than in the handful of well-known cases most investors already know, is what this comparison tests.
The Data
| Cohort | Median Gross Margin Change, 1 Quarter Later | Median Gross Margin Change, 1 Year Later | N (1yr) |
|---|---|---|---|
| Top-decile DIO increase | -0.08 pts | -0.47 pts | 7,620 |
| Rest of universe | +0.03 pts | +0.15 pts | 69,156 |
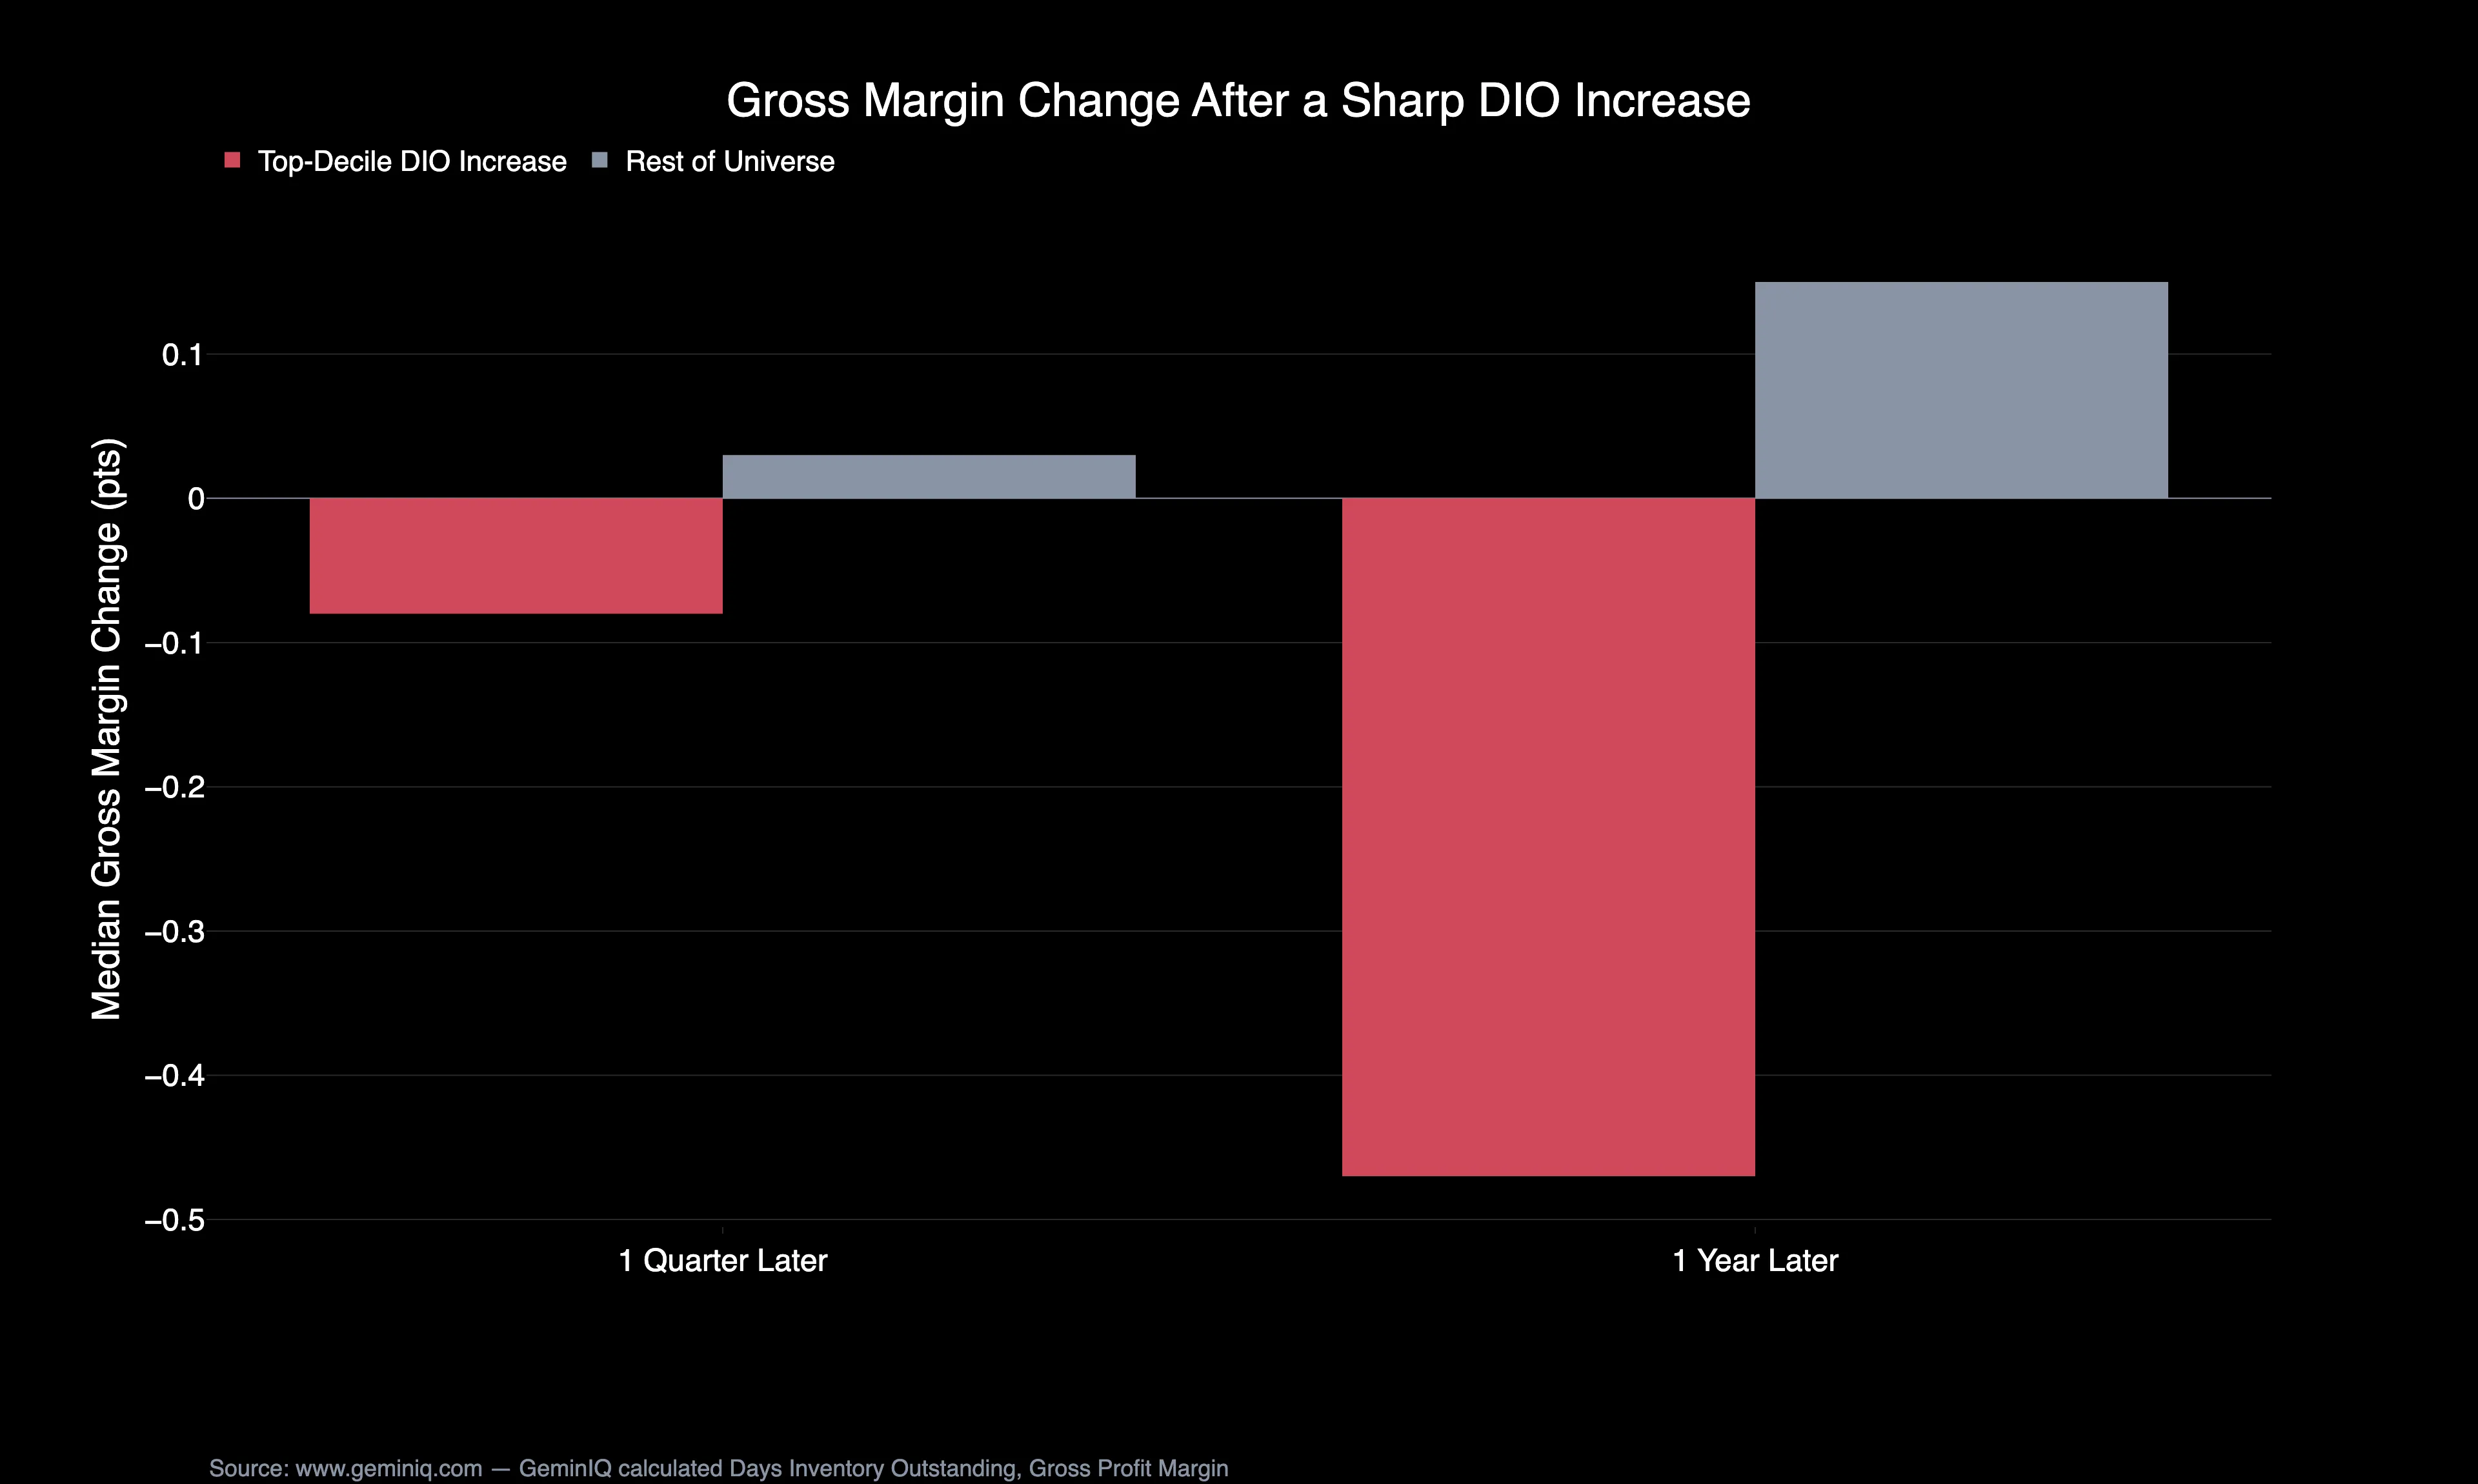
The top decile of DIO increase — a median jump of 49.3 days year-over-year — is followed by a median gross margin decline of 0.47 percentage points a year later, against a median gain of 0.15 points for the rest of the universe. On a mean basis, winsorized at the top and bottom 1%, the gap is wider still: -1.56 points for the top-decile cohort against +0.40 points for the base rate, a swing of nearly two full percentage points. The effect is present but modest at the one-quarter mark (-0.08 points versus +0.03 points). It widens by the one-year checkpoint, consistent with a markdown cycle that takes real time to work through a company's cost of goods sold rather than hitting in the same quarter the inventory builds.
The Extremes
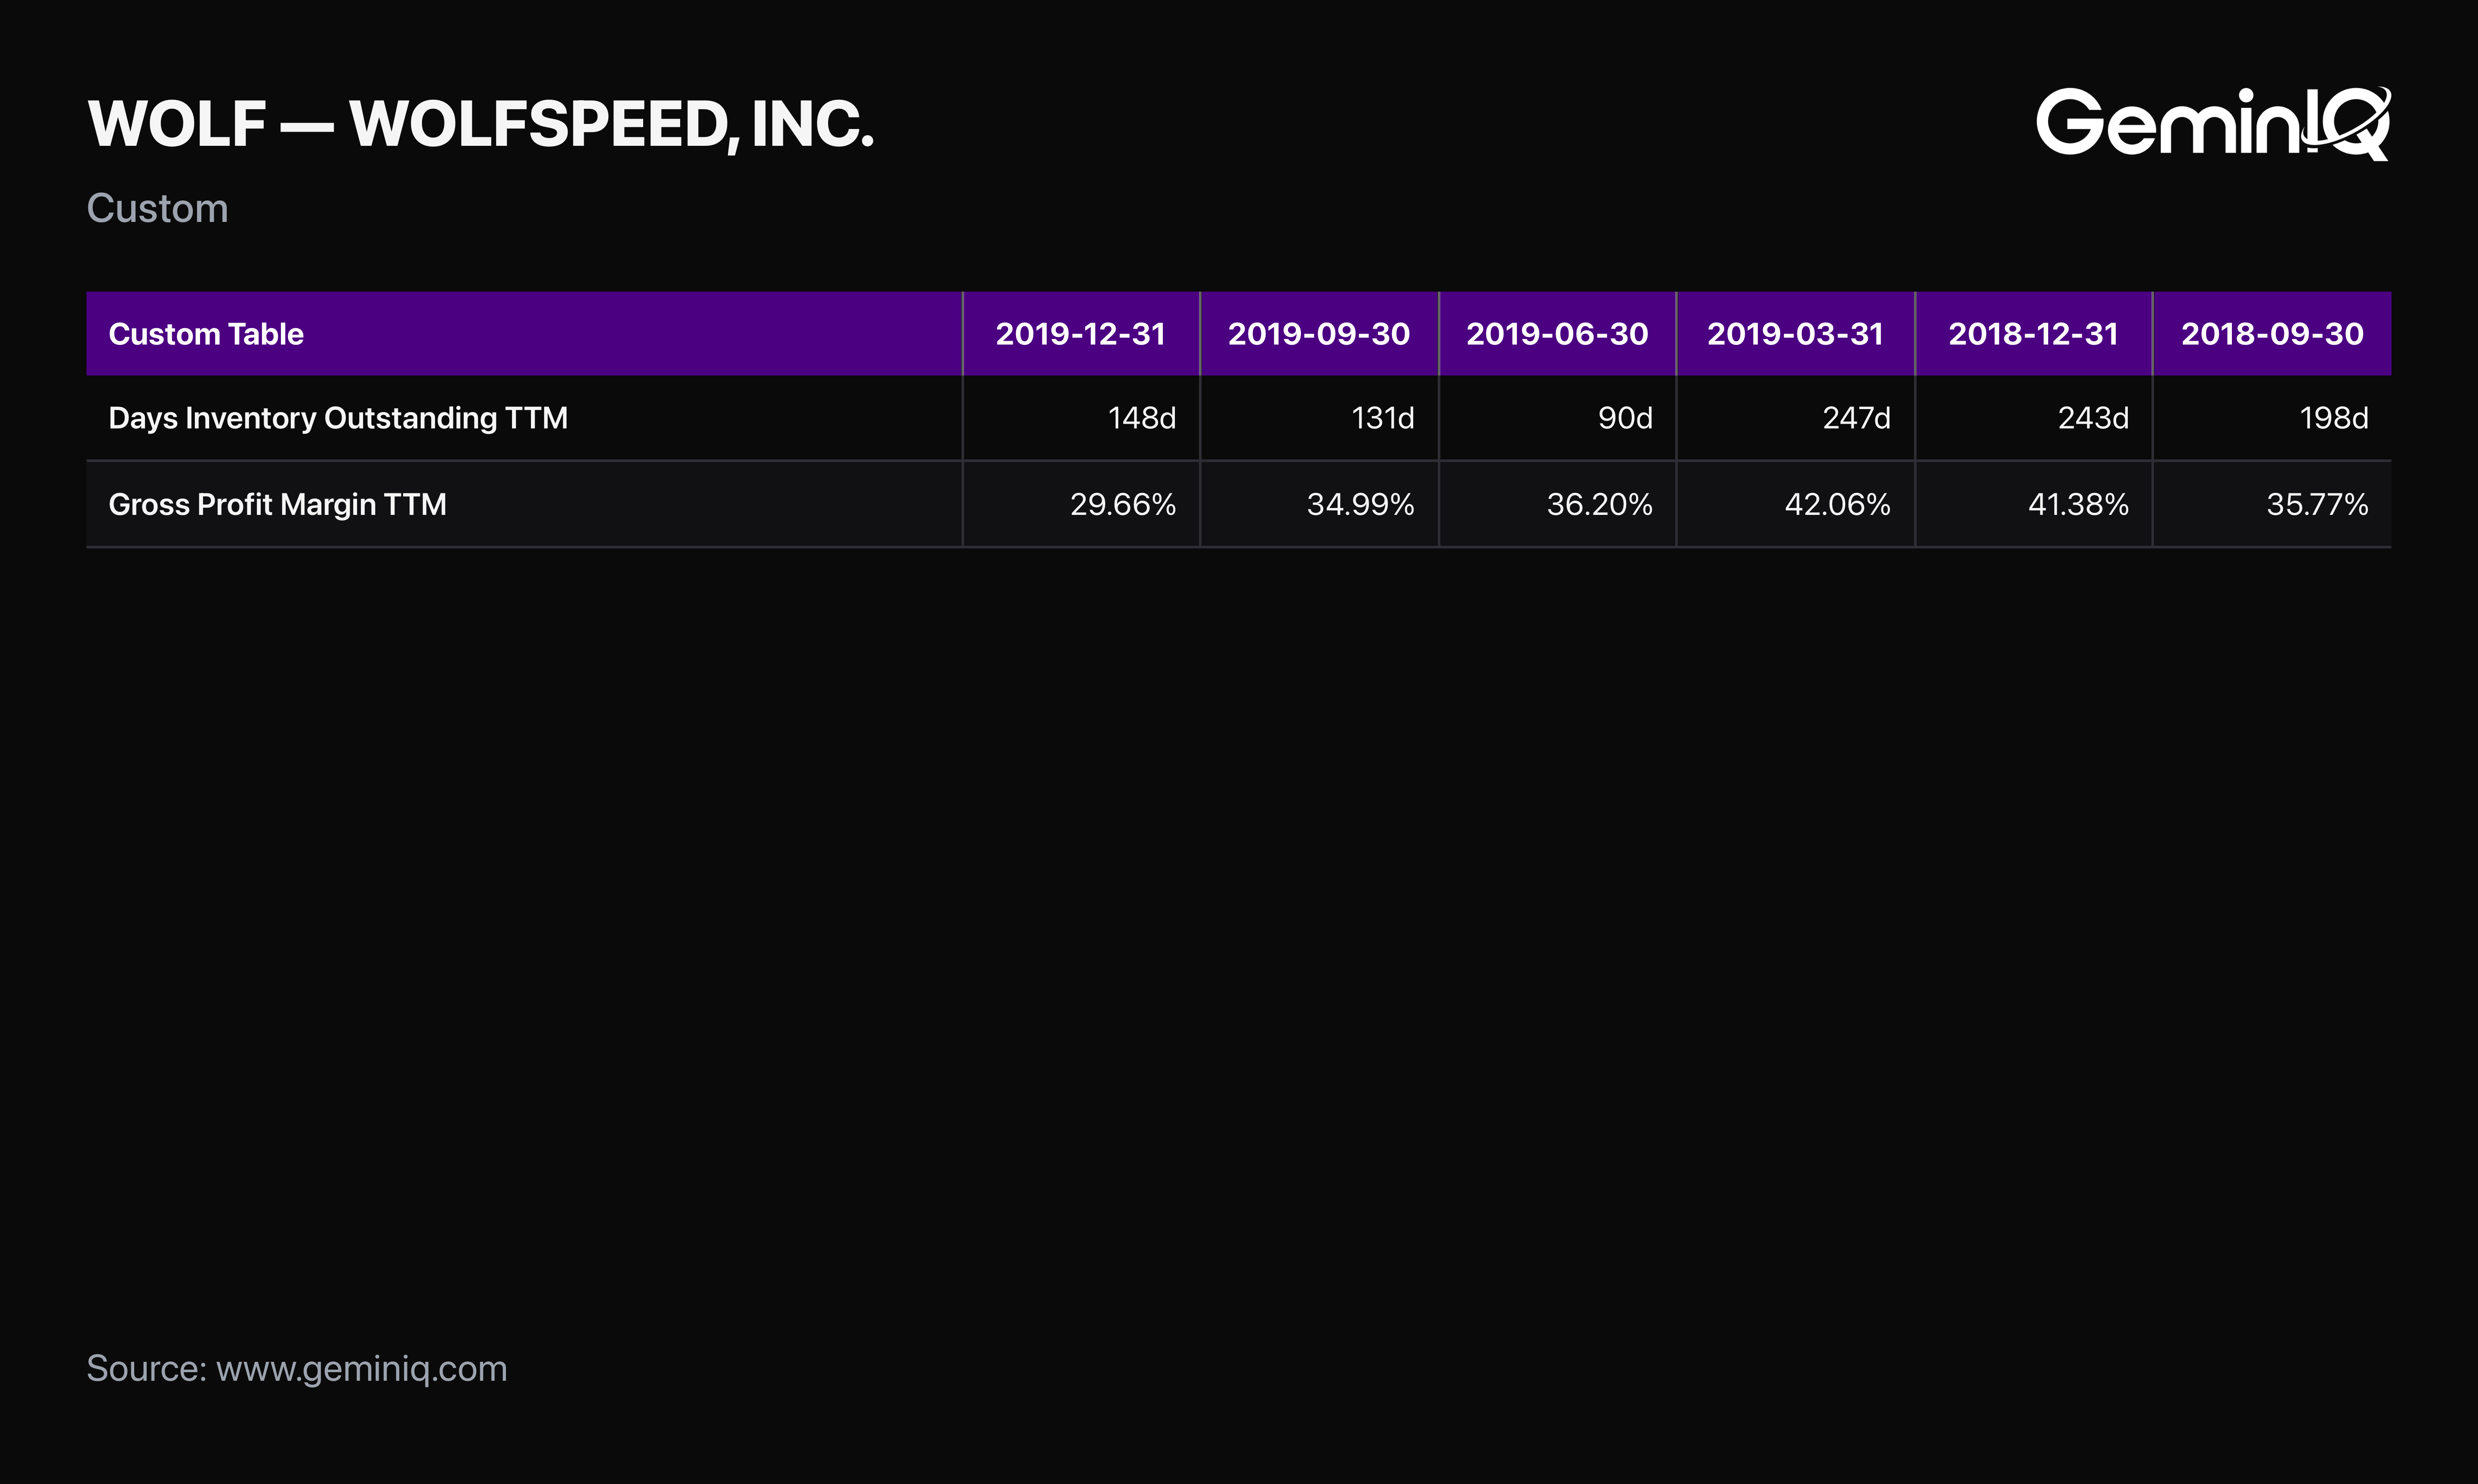
Diebold Nixdorf, cited in the opening, shows the pattern at its most severe: a 154.33-day jump in DIO followed by a 26.27-point gross margin collapse within a year. That collapse was part of a multi-year margin struggle at the ATM and banking-hardware maker that would eventually contribute to a 2023 Chapter 11 restructuring. Wolfspeed (then trading as Cree) shows the more typical, less dramatic version: DIO rose 146.73 days in a 2018 filing, and gross margin actually ticked up slightly one quarter later before falling 11.71 points over the full year. That lag is the reminder — this pattern plays out over time, not immediately, and "followed by" is doing real work in that sentence rather than "predicts."
The Method
Days Inventory Outstanding and Gross Profit Margin are both GeminIQ's trailing-twelve-month calculated metrics. Year-over-year DIO change compares each filing's reading to the same company's reading from approximately one year earlier, validated to a 330–400 day gap to exclude irregular fiscal cadences. Forward gross margin change is computed the same way, comparing each filing's margin to that same company's next quarterly reading (validated to a 75–110 day gap) and to its reading roughly a year out (330–400 day gap). Both DIO values in a comparison are required to fall between 1 and 365 days, which serves as this study's inventory-carrying filter — a company with no real inventory balance doesn't produce a usable DIO reading in the first place. Full methodology is covered in How GeminIQ Builds Filing Data Studies.
Check Your Holdings
Pull up any inventory-carrying position's Days Inventory Outstanding trend on GeminIQ's Calculated Metrics view and check whether it's climbing meaningfully faster than its own recent history. A rising DIO alone isn't a verdict, but this study's data says it's worth watching the gross margin line over the following few quarters rather than assuming inventory and margin move independently of each other.
Frequently Asked Questions
What does a rising Days Inventory Outstanding mean for gross margin?
In GeminIQ's data, companies in the top decile of year-over-year DIO increase saw a median gross margin decline of 0.47 percentage points over the following year, against a median gain of 0.15 points for the rest of the universe — a gap consistent with inventory that isn't clearing at full price eventually getting marked down.
Does a rising DIO always mean a company is in trouble?
No. A rising DIO can reflect a deliberate stock-up ahead of a launch or seasonal demand, not just unsold goods. The effect in this study is a median, base-rate-level pattern across a large sample — individual companies can and do buck it, which is why the trend is worth watching over several quarters rather than reacting to a single filing.
How is the gross margin effect measured — one quarter or one year out?
Both, and the two windows tell different parts of the story. The effect is small at one quarter (-0.08 points for the top-decile cohort versus +0.03 points for the base rate) and widens substantially by one year (-0.47 versus +0.15), consistent with a markdown or write-down cycle that takes time to fully move through cost of goods sold.
How many filings does this study cover?
90,260 filing-periods with a valid year-over-year Days Inventory Outstanding comparison, of which the top decile — companies with the sharpest DIO increases — carries 7,620 filings with a matched one-year-forward gross margin reading.
Wall Street's data. Main Street's price.
Institutional terminals charge thousands a year for as-filed accuracy. GeminIQ gives you the same thing for a fraction of the cost: financials built directly from raw SEC EDGAR filings, not third-party APIs, with full XBRL traceability back to the original 10-K or 10-Q. No normalized guesswork, just calculated metrics, charts, screeners, and watchlists built on numbers exactly as the company reported them. Start researching now at GeminIQ.com.
Data Appendix: Universe drawn from GeminIQ's as-filed 10-K and 10-Q database, publicly available on SEC EDGAR. 90,260 filing-periods with a valid year-over-year Days Inventory Outstanding comparison, built from GeminIQ's calculated Days Inventory Outstanding and Gross Profit Margin metrics. Forward gross margin changes are winsorized at the top and bottom 1%. Diebold Nixdorf's and Wolfspeed's cited figures predate the 3-year window shown on their current GeminIQ stock pages and are drawn from GeminIQ's full as-filed history. Methodology: How GeminIQ Builds Filing Data Studies.
Disclaimer: The content in this blog is for educational and entertainment purposes only and does not constitute financial, legal, or tax advice. Investing involves risk, including the loss of principal. The views expressed are my own and not intended as financial advice or a guarantee of future performance.