
Defense Sector Stock Analysis: Lockheed's Fading Returns

By Chad Hartman
Published · Last updated
Defense spending is up across the board, and it shows in the headline numbers. Lockheed Martin (LMT), Northrop Grumman (NOC), and General Dynamics (GD) all grew trailing-twelve-month revenue between 4.6% and 9.4% through their most recent quarterly filings. On revenue growth alone, this looks like a uniformly strong sector.
It isn't. Lockheed Martin's Q1 FY2026 10-Q (filed April 23, 2026, period ending March 29, 2026) shows the highest Price-to-Earnings Ratio of the three primes, 28.80x, attached to a Return on Invested Capital that has been falling for five straight years. That combination, a rising multiple on a shrinking return, isn't something a single quarter's comps table would flag. It only shows up when you look at the trend.
Using a GeminIQ Custom Watchlist to pull every quarter of Calculated Metrics for Lockheed Martin, Northrop Grumman, and General Dynamics back to 2021, the same sector splits into three distinct stories: one prime getting more expensive for less return, one that took a real, filed hit and mostly recovered, and one that has been quietly de-risking every year without anyone pricing it in.
| Company | ROIC (TTM) | P/E Ratio (TTM) | Altman Z-Score |
|---|---|---|---|
| Lockheed Martin (LMT) | 23.10% | 28.80x | 3.69 |
| Northrop Grumman (NOC) | 13.63% | 21.09x | 3.46 |
| General Dynamics (GD) | 14.38% | 21.17x | 4.10 |
Phase 1: The Return-on-Capital Divergence
Read the table above as a single quarter and Lockheed looks like the winner: the highest Return on Invested Capital of the three, by a wide margin. Read it as the end point of a five-year line, and the story flips.
Lockheed's ROIC has fallen in nearly every year since 2021: 41.55%, then 32.59%, then 30.42%, then 24.19%, a brief tick up to 25.51% in 2025, and 23.10% now. That's a decline of nearly half from where it started. General Dynamics moved the other way, holding in the low-teens before climbing every year since 2023: 12.75%, 12.43%, 12.16%, 13.41%, 14.15%, and 14.38% now. Northrop Grumman round-tripped through an actual trough: 19.99% in 2021, falling to 8.44% by 2023, before recovering to 13.63% today.
Lockheed's current ROIC is still the highest of the three in absolute terms. It's also the only one of the three moving in the wrong direction.
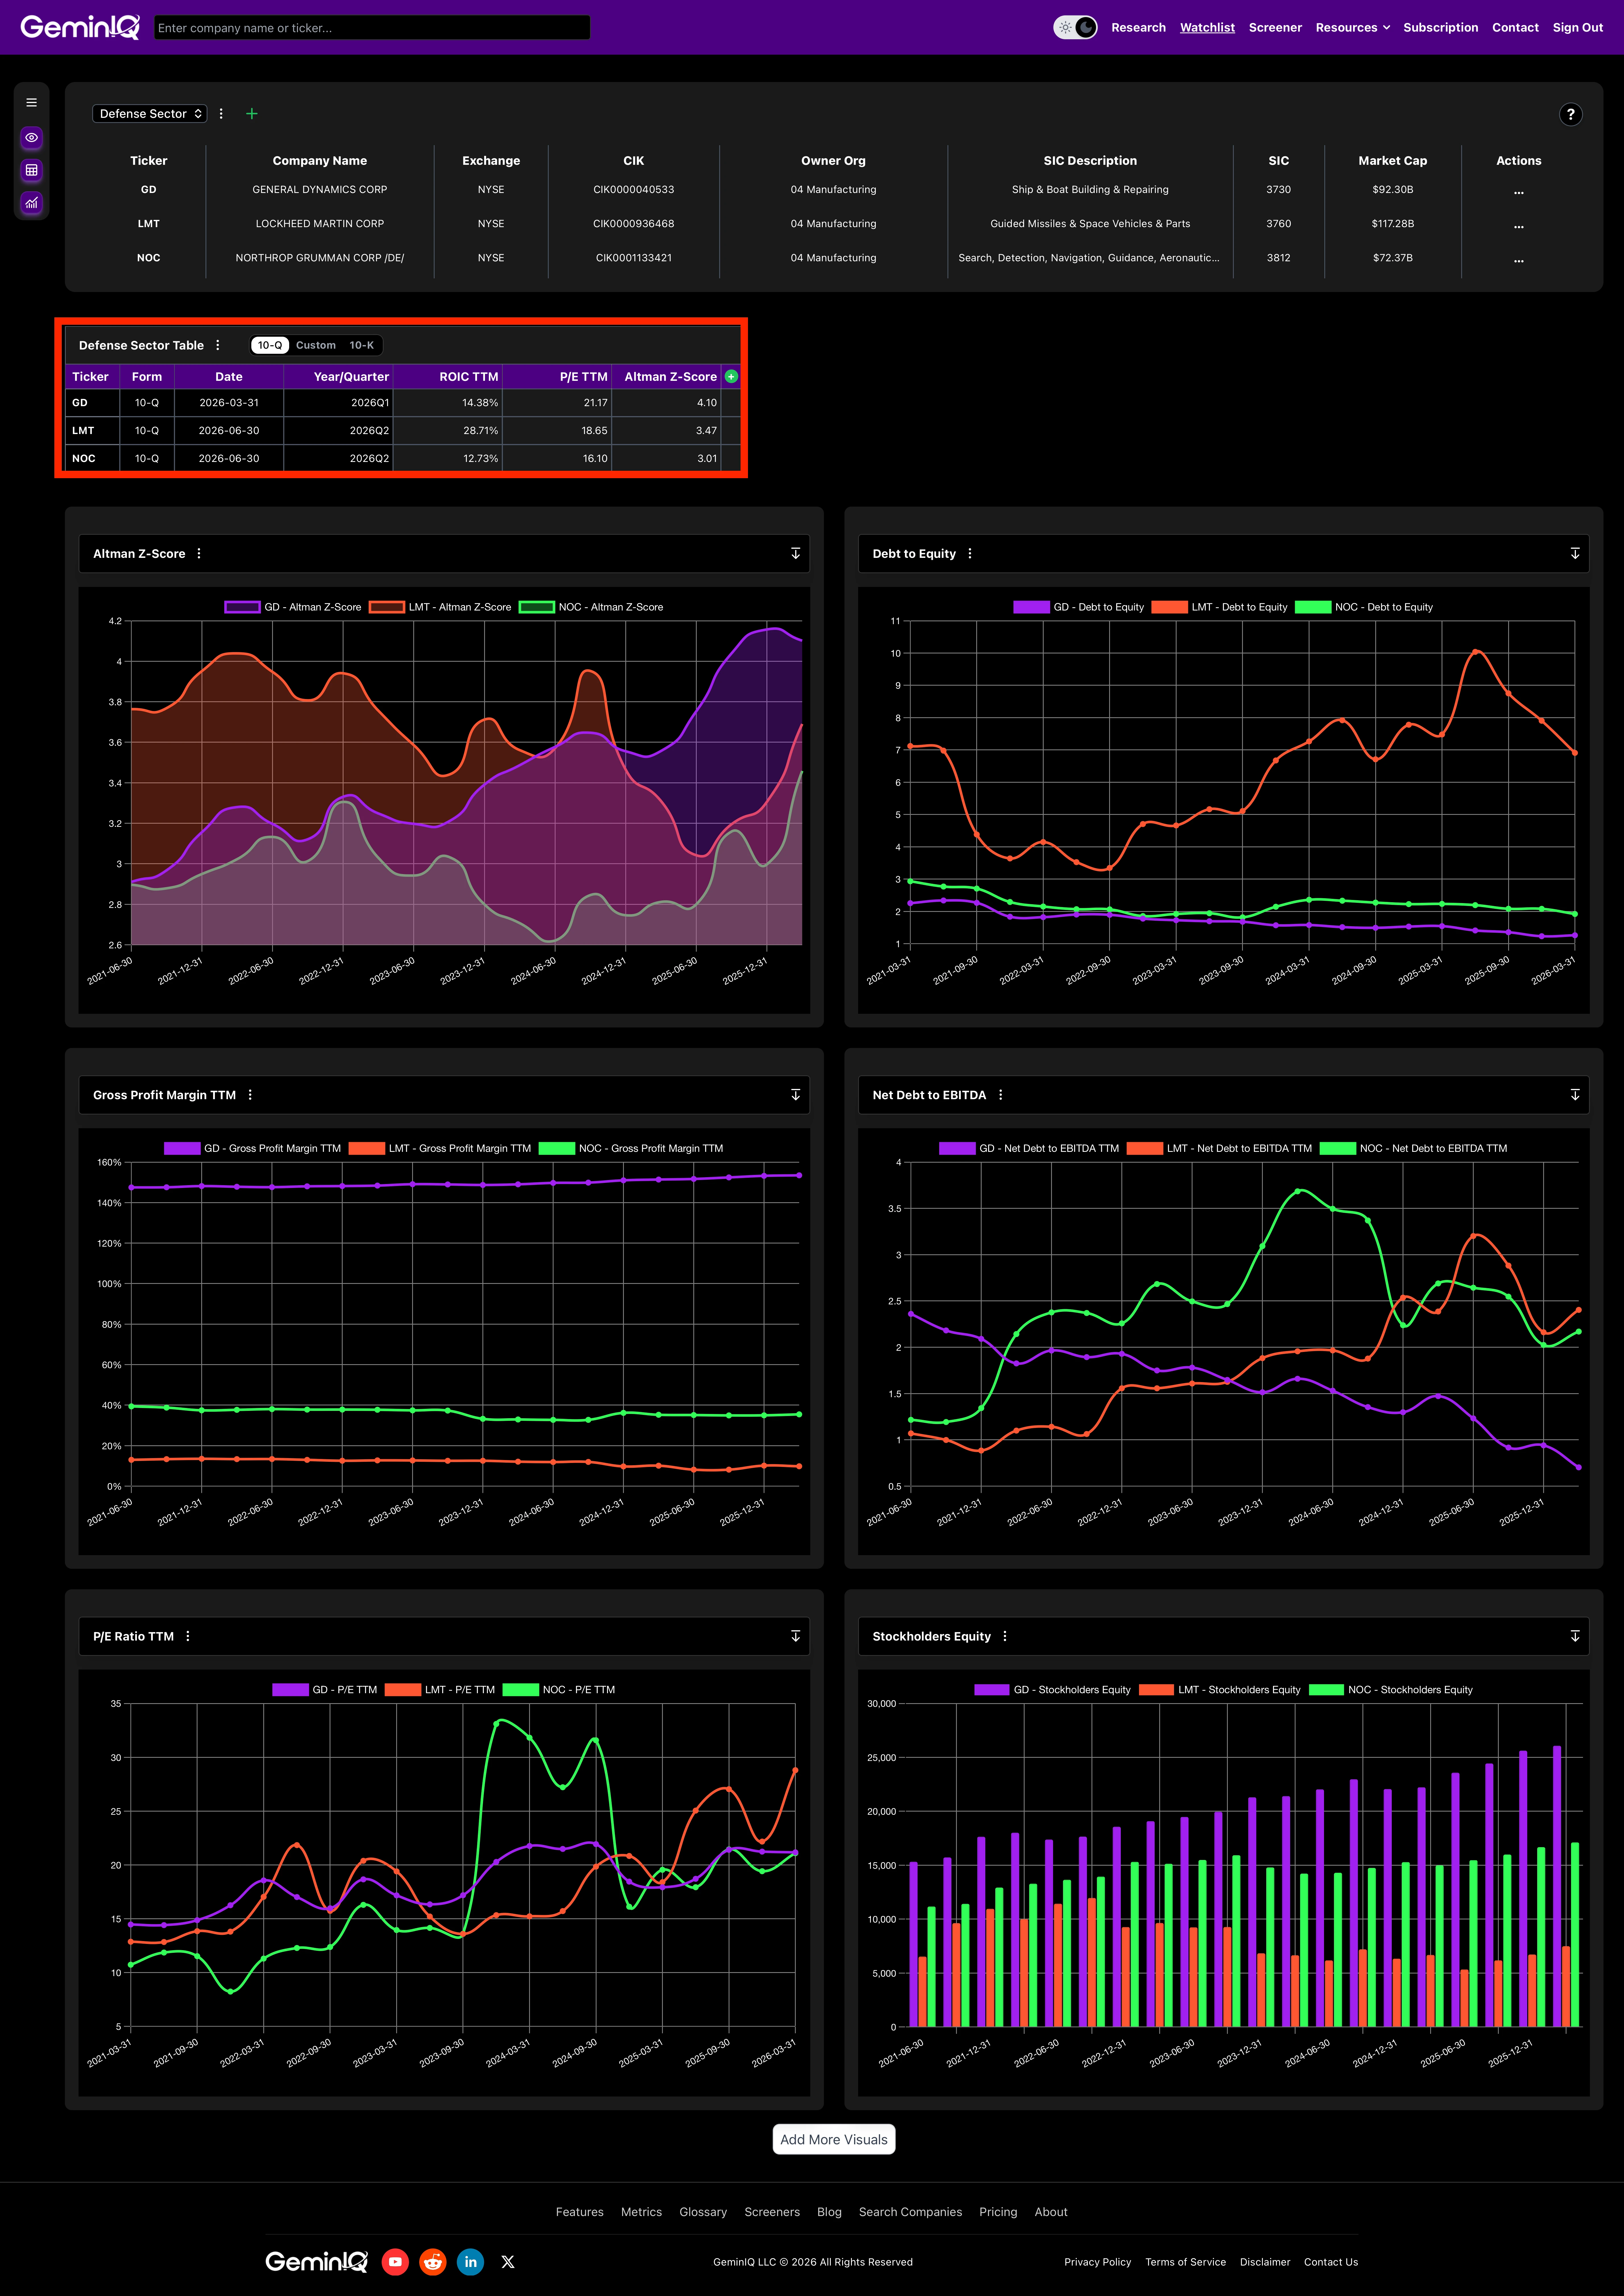 GeminIQ Calculated Metrics comparison showing Return on Invested Capital, Price-to-Earnings Ratio, and Altman Z-Score for Lockheed Martin, Northrop Grumman, and General Dynamics as of the quarter ended March 2026.
Phase 2: The Multiple That Isn't Falling With It
If Lockheed's return on capital has been shrinking for five years, its valuation multiple should reflect that. It hasn't.
Lockheed's Price-to-Earnings Ratio has moved from 13.81x in 2021 to 20.38x, 15.34x, 20.83x, 22.17x, and 28.80x now, more than double where it started, over the same five years its ROIC nearly halved. General Dynamics' multiple expanded too, but far more modestly: 16.26x to 21.17x. Northrop Grumman's P/E tells a different kind of story entirely: it spiked to 33.09x in 2023, not because the market bid the stock up, but because earnings that year were depressed by a real, filed charge covered in Phase 4. A P/E built on a temporarily damaged earnings base isn't the same signal as one built on a rising price against a shrinking return, and Lockheed's is the latter.
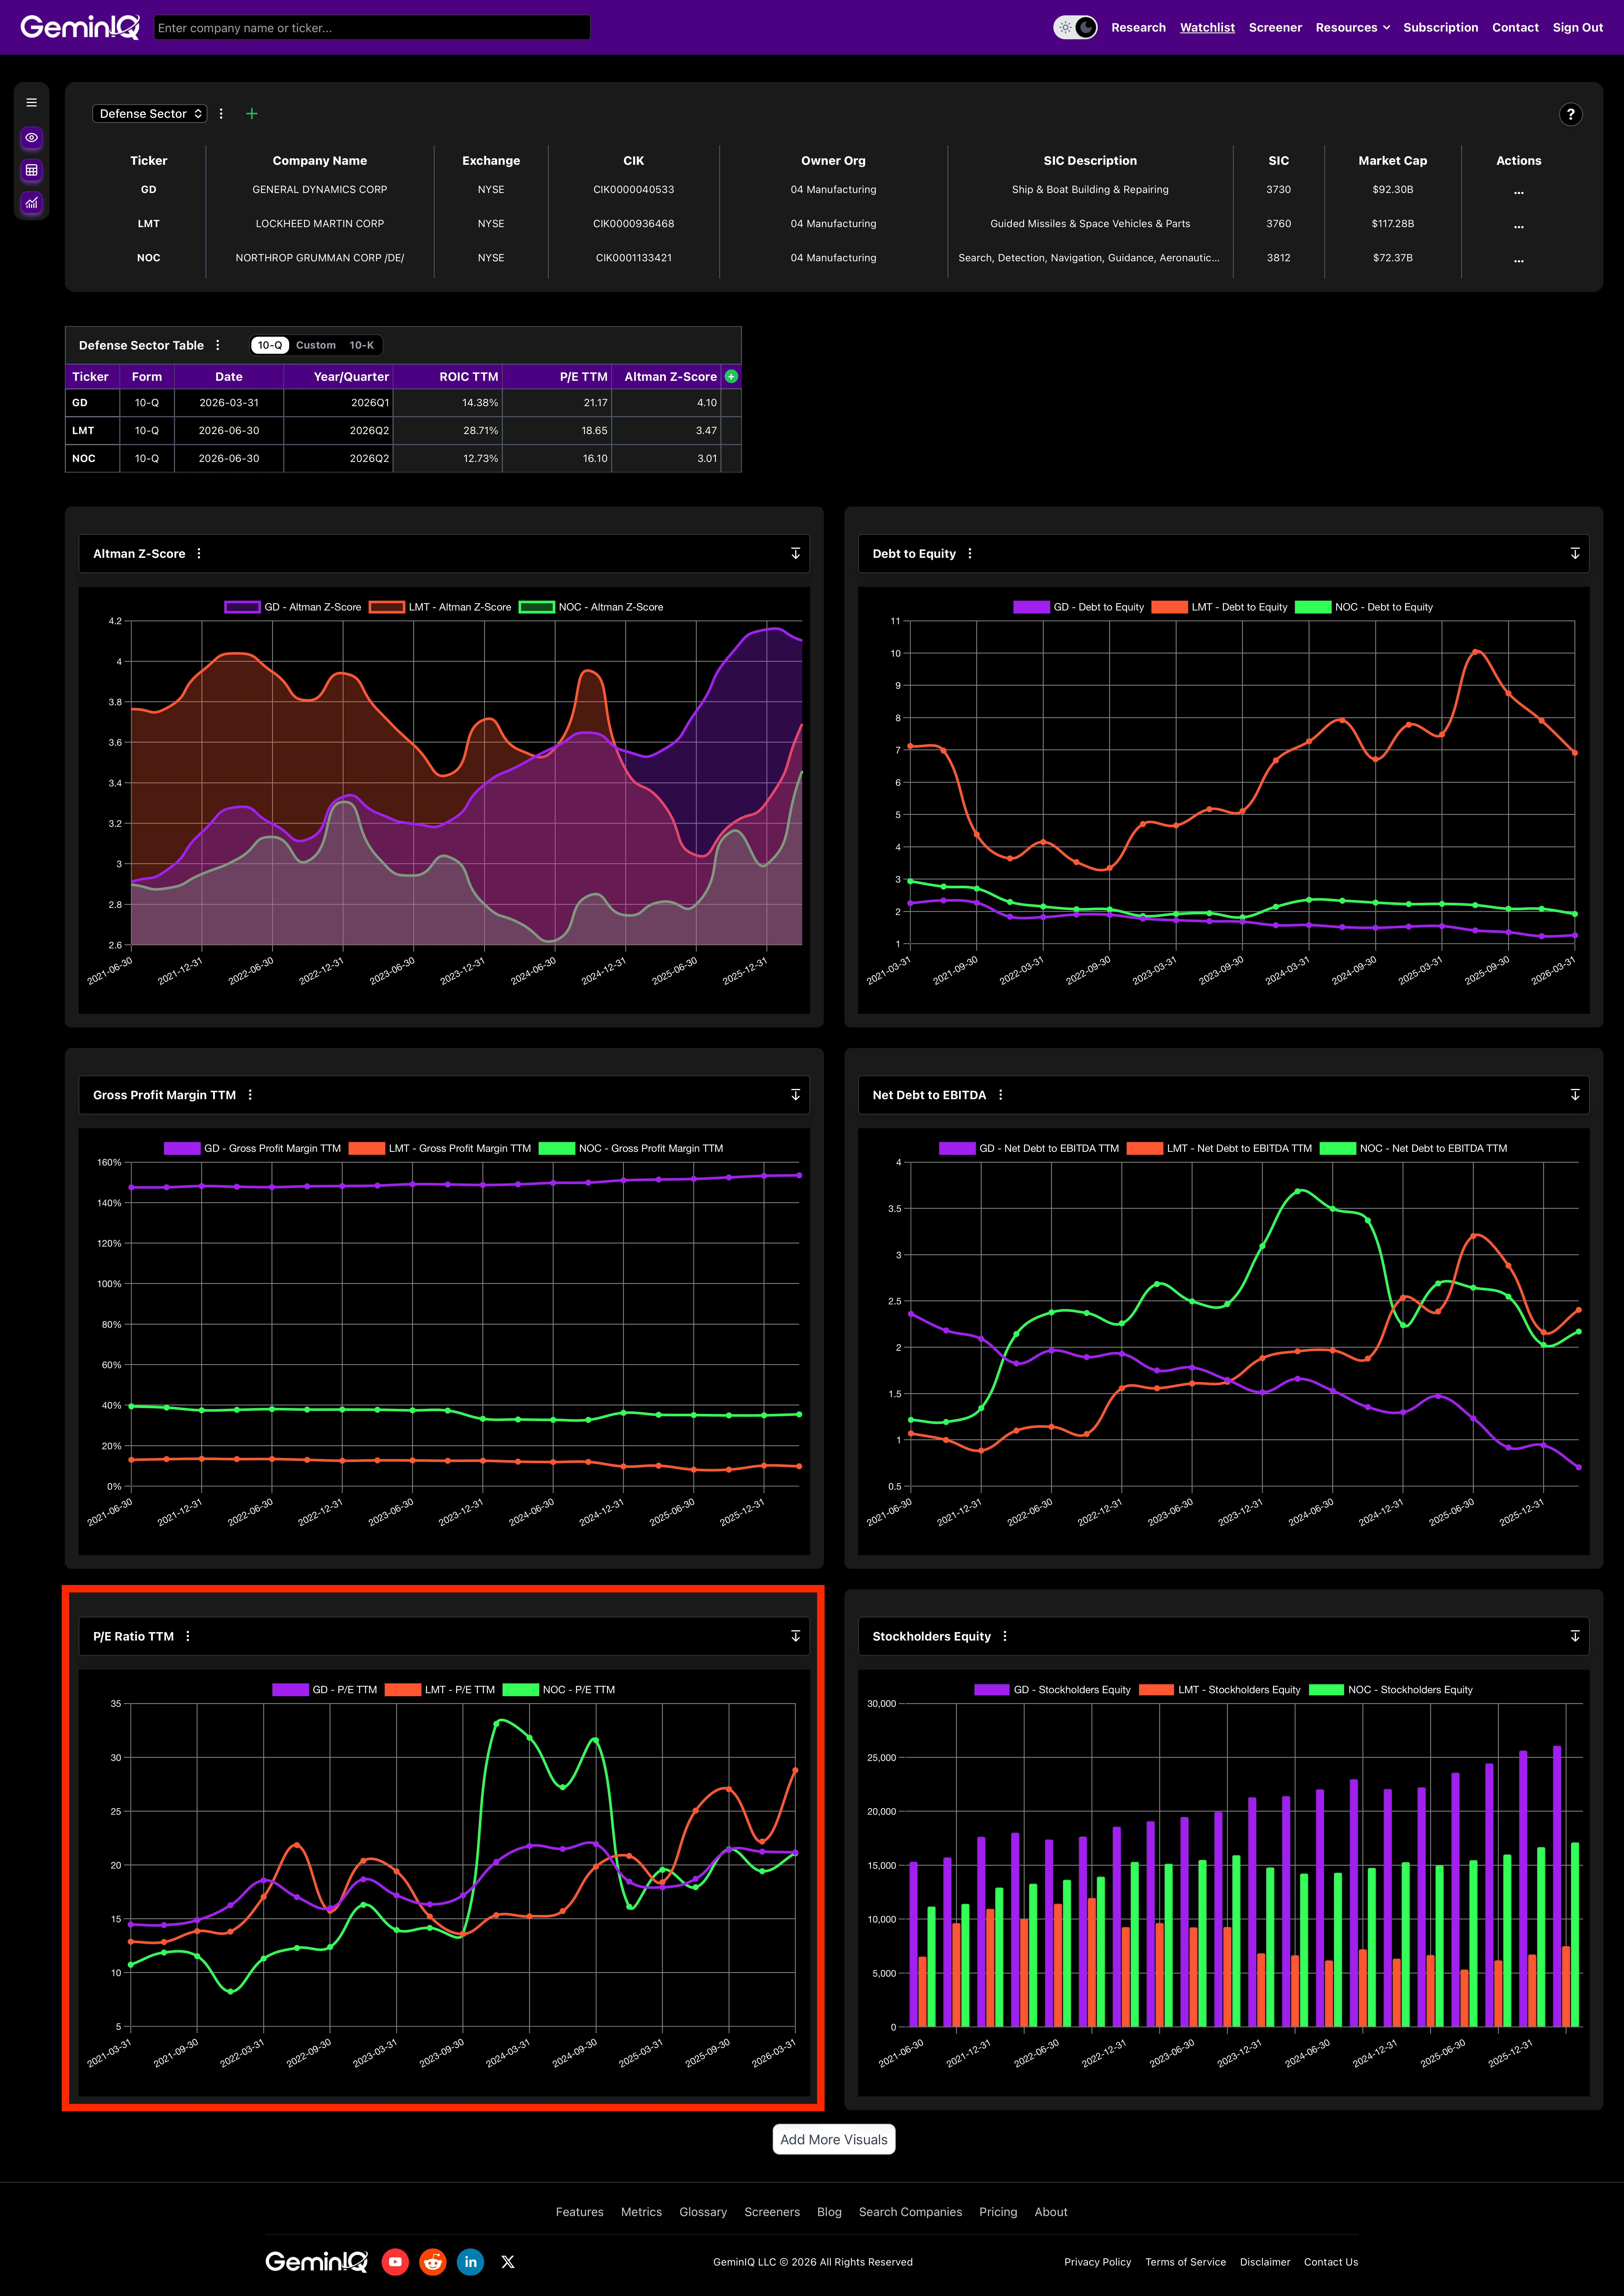 GeminIQ Visualizations chart plotting quarterly Price-to-Earnings Ratio for Lockheed Martin, Northrop Grumman, and General Dynamics from 2021 through Q1 FY2026.
Phase 3: The Balance Sheet Ledger
A shrinking return on capital paired with a rising multiple usually means one of two things: the market expects a turnaround, or the company is borrowing to keep its numbers up. The balance sheet points to the second explanation for Lockheed.
Lockheed's Debt-to-Equity Ratio climbed from 3.64 in 2021 to 4.71, 6.67, 7.78, 7.90, and 6.91 now, nearly double where it started. Its Net Debt-to-EBITDA followed the same path, from 0.88x to 2.40x. General Dynamics moved in the opposite direction on both counts: Debt-to-Equity fell from 1.84 to 1.26, and Net Debt-to-EBITDA from 2.09x to 0.70x, a genuine, uninterrupted deleveraging run. Northrop Grumman's leverage was choppier but ended lower than it started: Debt-to-Equity from 2.29 to 1.92, Net Debt-to-EBITDA peaking near 3.09x in 2023 before settling at 2.17x now. Of the three, only Lockheed's balance sheet is carrying more risk today than it was five years ago.
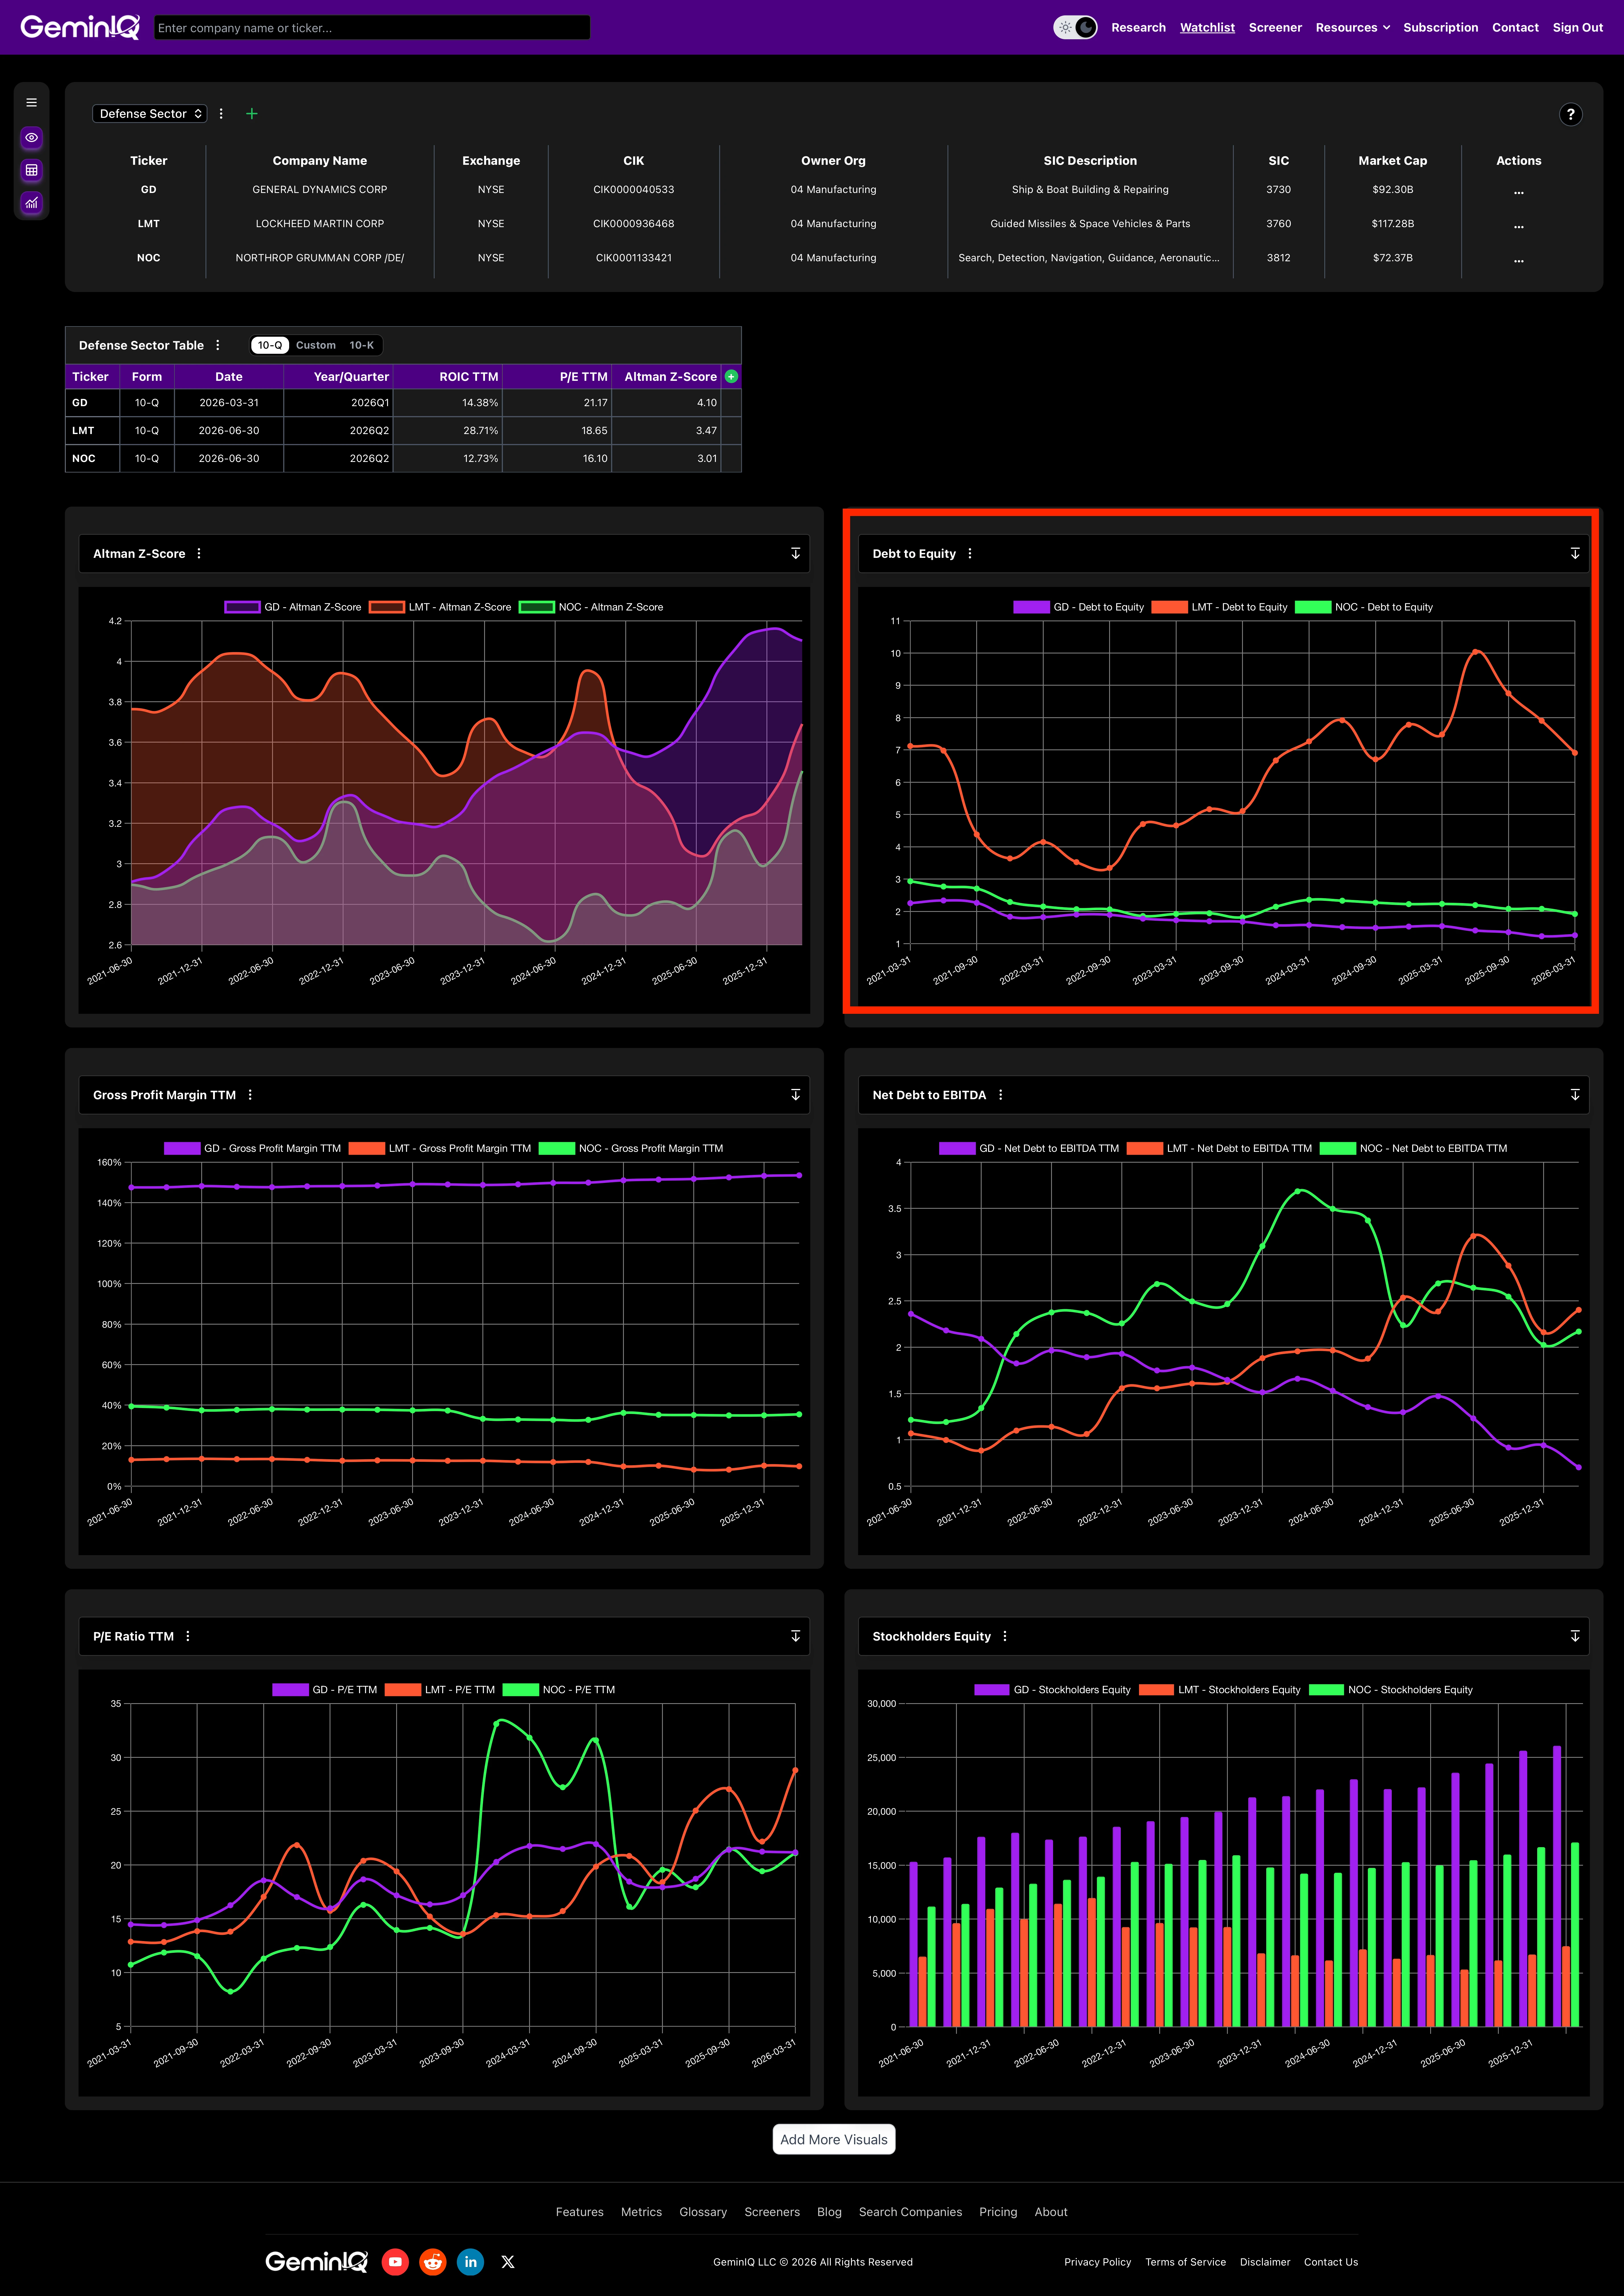 GeminIQ Visualizations chart plotting quarterly Debt-to-Equity Ratio for Lockheed Martin, Northrop Grumman, and General Dynamics from 2021 through Q1 FY2026.
Phase 4: The Altman Z-Score and the B-21 Scar
None of these three is a distress case. All three have spent most of the last five years in the Altman Z-Score's "safe zone" above 2.99. But the trend inside that zone tells you who's getting safer and who isn't.
General Dynamics climbed from 3.16 in 2021 to a peak of 4.16 in 2025, now 4.10, the highest and most consistent improvement of the three. Lockheed drifted down from 3.95 to a 2025 low of 3.31, recovering slightly to 3.69 now, still comfortably safe but well off its own high. Northrop Grumman actually left the safe zone for two years: its score fell to 2.75 in 2024, into the "gray zone" below the 2.99 threshold. The cause is on the record in its own filings: a $1.56 Billion B-21 program charge booked in the fourth quarter of 2023 (labeled "B-21 Charge" on Northrop's cash flow statement) drove the company to a $535 Million net loss that single quarter, dragging profitability and retained earnings down with it. Northrop's score has since climbed back to 3.46, the sharpest single recovery of the three, but it's the only one of the three with an actual excursion below the safe-zone line in this window.
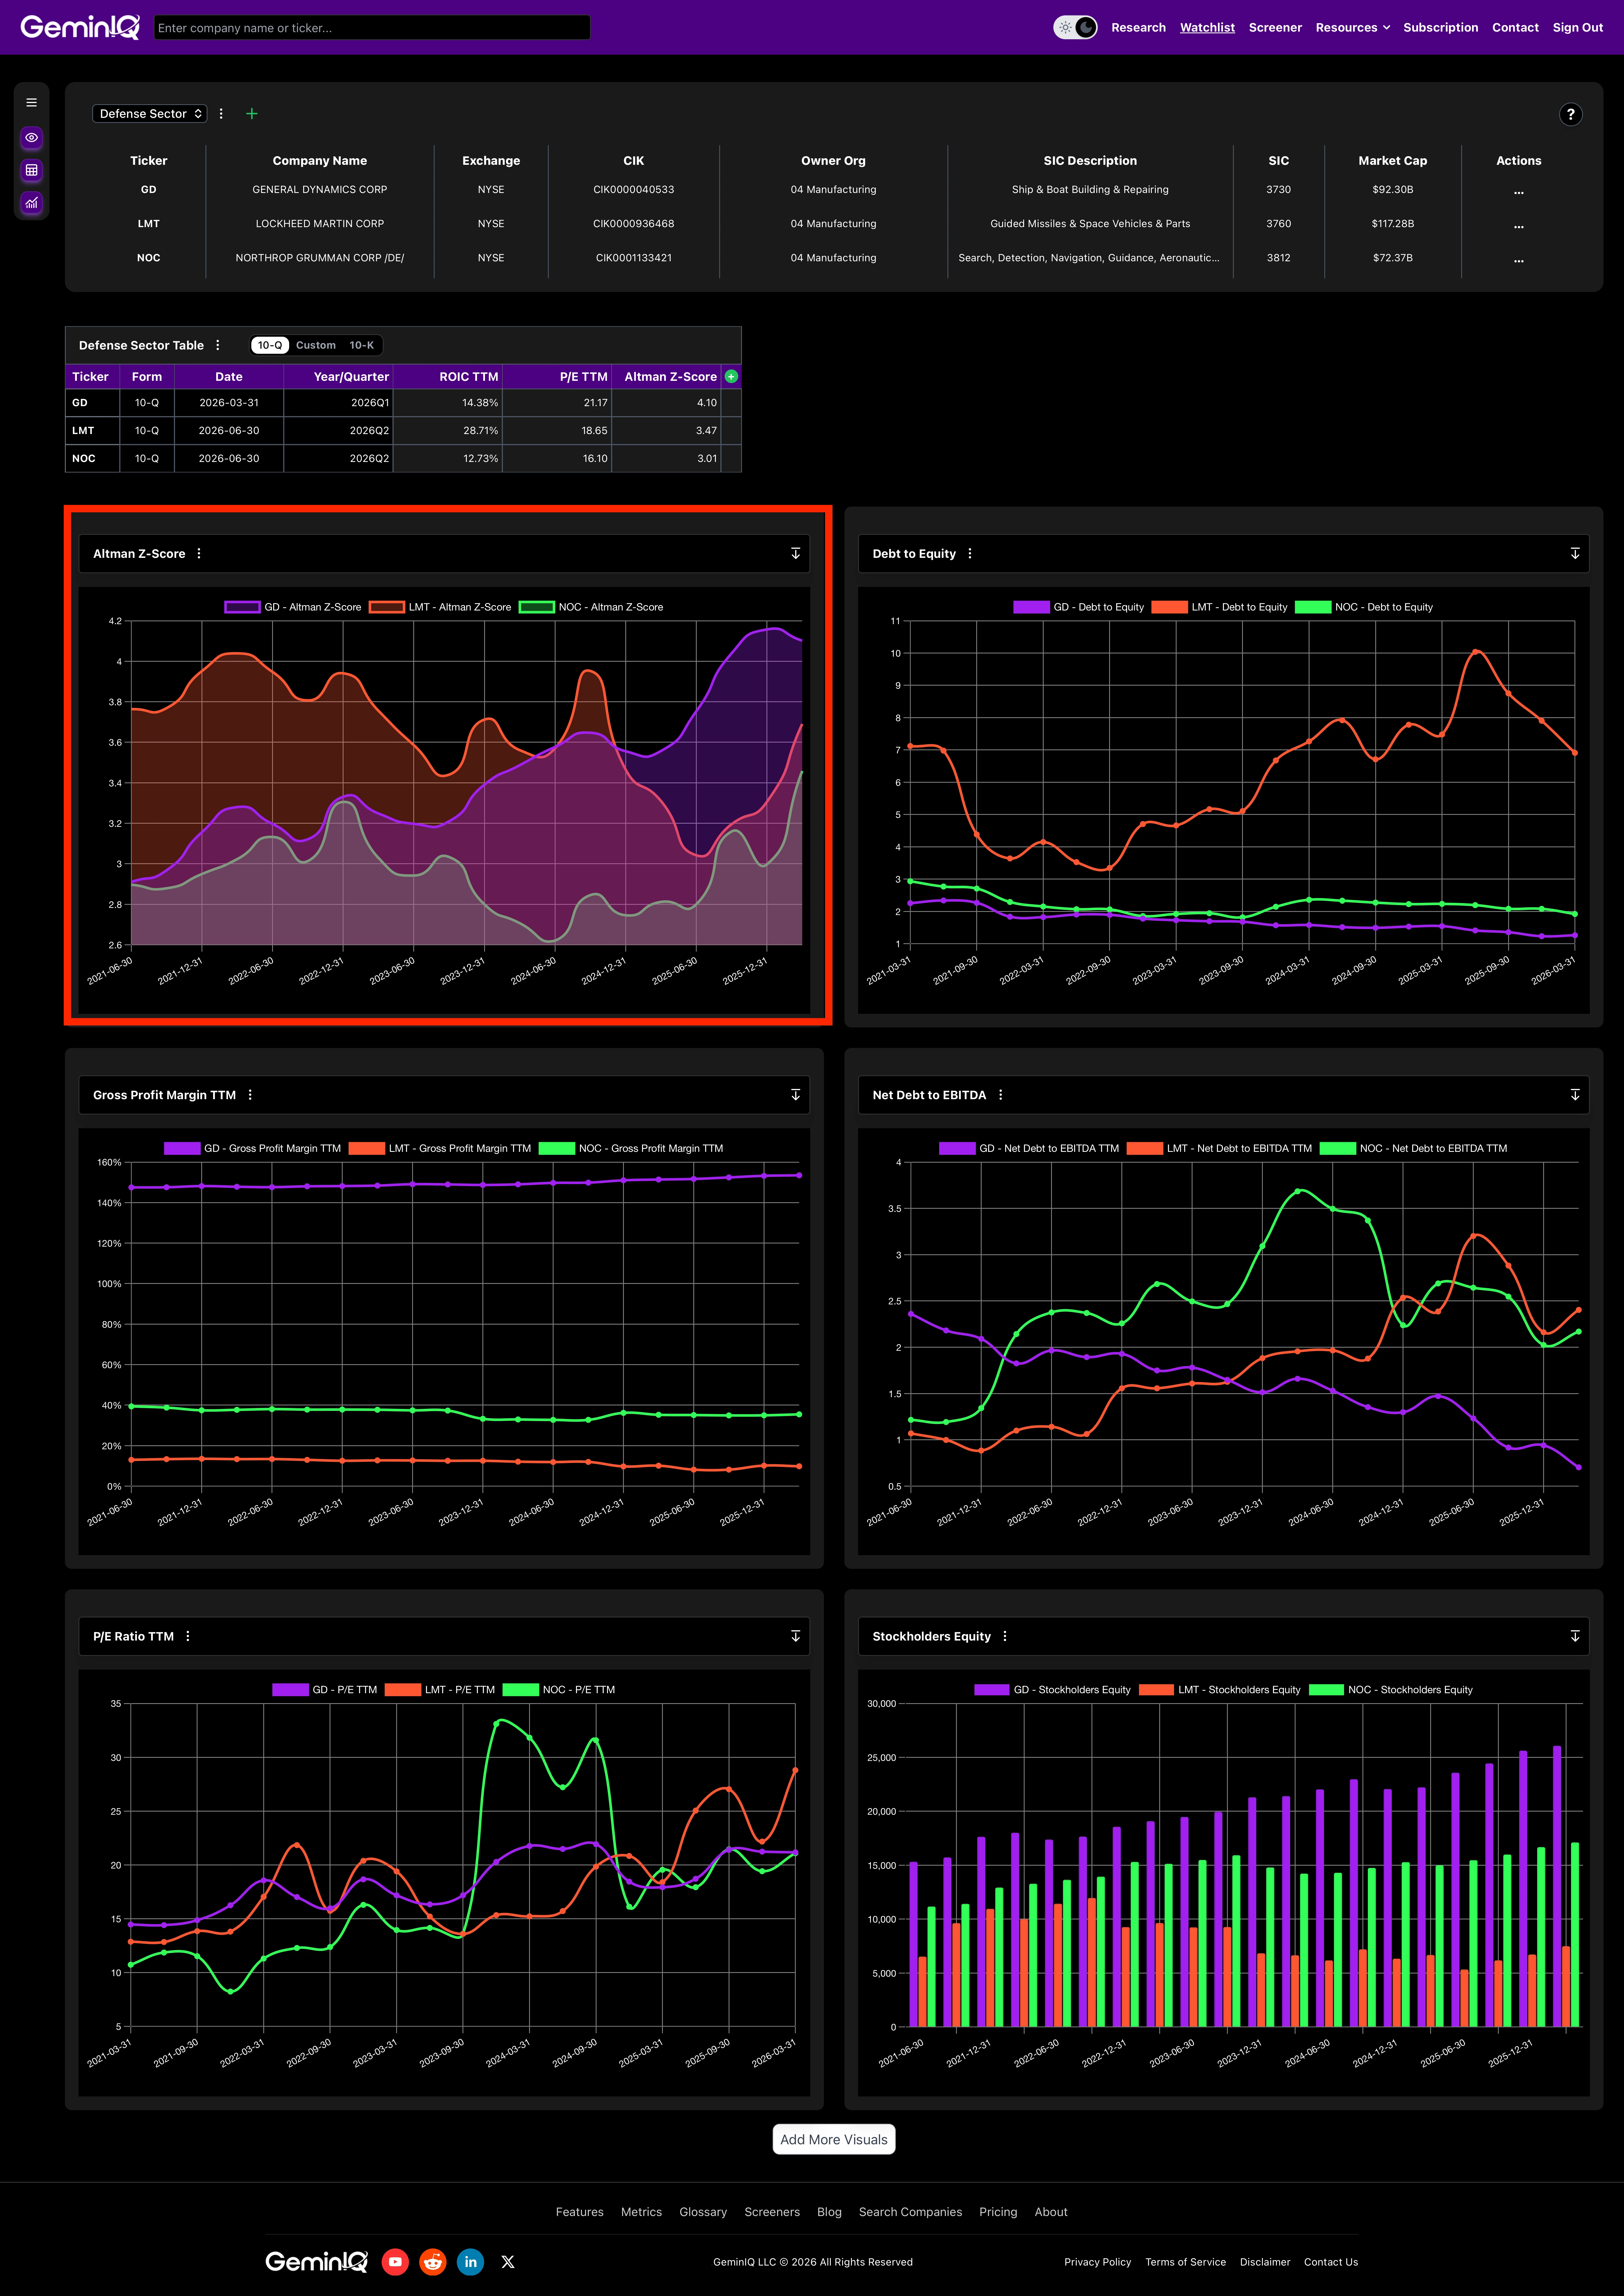 GeminIQ Visualizations chart plotting quarterly Altman Z-Score for Lockheed Martin, Northrop Grumman, and General Dynamics from 2021 through Q1 FY2026, showing Northrop's 2023-2024 dip below the 2.99 safe-zone threshold.
Phase 5: What Institutional and Insider Data Confirm
GeminIQ's Institutional Ownership data shows a gap that lines up with the balance sheet trend, even if it's a modest one: institutions hold 72.92% of Lockheed Martin, 78.66% of Northrop Grumman, and 82.68% of General Dynamics, as of the most recent 13F-reported quarter. The GeminIQ Insider Transactions feed shows nothing but Sale filings across all three companies over the past year, a routine post-vesting pattern at this size of company rather than a distinguishing signal on its own. The more useful signal is the one that's held steady all year: the same company with the cleanest balance sheet trend also carries the deepest institutional bench.
The Analyst's Verdict
Revenue growth is the one number all three primes share right now, and it's the number that makes the sector look uniform from a distance. It isn't. Lockheed Martin's Return on Invested Capital has fallen in nearly every year since 2021 while its Price-to-Earnings Ratio has more than doubled and its leverage has climbed to match, a combination the current-quarter snapshot alone won't show you. General Dynamics has done the opposite on every measure that matters here: steadier returns, a shrinking Debt-to-Equity Ratio, and the highest Altman Z-Score of the three. Northrop Grumman is the one name with a real, filed scar, the 2023 B-21 charge, and a genuine recovery from it since. Same sector, same demand environment, three different trend lines underneath.
Frequently Asked Questions
Why did Northrop Grumman's Altman Z-Score fall below the safe zone in 2023?
A $1.56 Billion B-21 program charge, booked in the fourth quarter of 2023, drove Northrop Grumman to a $535 Million net loss that quarter, pulling its Altman Z-Score down to 2.75 by 2024, below the model's 2.99 safe-zone threshold. It has since recovered to 3.46.
Has Lockheed Martin's Return on Invested Capital improved or worsened since 2021?
It has worsened in nearly every year since 2021, falling from 41.55% to 23.10% as of the quarter ended March 29, 2026, even as its Price-to-Earnings Ratio rose from 13.81x to 28.80x over the same window.
Which defense prime carries the lowest leverage by Net Debt-to-EBITDA?
General Dynamics carries the lowest Net Debt-to-EBITDA ratio of the three at 0.70x, the result of a steady decline from 2.09x in 2021.
When did Lockheed Martin, Northrop Grumman, and General Dynamics last file their 10-Q?
Lockheed Martin filed its Q1 FY2026 10-Q on April 23, 2026 (period ending March 29, 2026); Northrop Grumman filed on April 21, 2026 (period ending March 31, 2026); General Dynamics filed on April 29, 2026 (period ending April 5, 2026).
Wall Street's data. Main Street's price.
Institutional terminals charge thousands a year for as-filed accuracy. GeminIQ gives you the same thing for a fraction of the cost: financials built directly from raw SEC EDGAR filings, not third-party APIs, with full XBRL traceability back to the original 10-K or 10-Q. No normalized guesswork, just calculated metrics, charts, screeners, and watchlists built on numbers exactly as the company reported them. Start researching now at GeminIQ.com.
All financial figures cited in this article reference Lockheed Martin Corporation's Q1 FY2026 10-Q (filed April 23, 2026, period ending March 29, 2026). All SEC filings are publicly available at SEC EDGAR.
All financial figures cited in this article reference Northrop Grumman Corporation's Q1 FY2026 10-Q (filed April 21, 2026, period ending March 31, 2026). All SEC filings are publicly available at SEC EDGAR.
All financial figures cited in this article reference General Dynamics Corporation's Q1 FY2026 10-Q (filed April 29, 2026, period ending April 5, 2026). All SEC filings are publicly available at SEC EDGAR.
Disclaimer: The content in this blog is for educational and entertainment purposes only and does not constitute financial, legal, or tax advice. Investing involves risk, including the loss of principal. The views expressed are my own and not intended as financial advice or a guarantee of future performance.