
Deferred Revenue Growth Falling Behind Revenue

By Chad Hartman
Published · Last updated
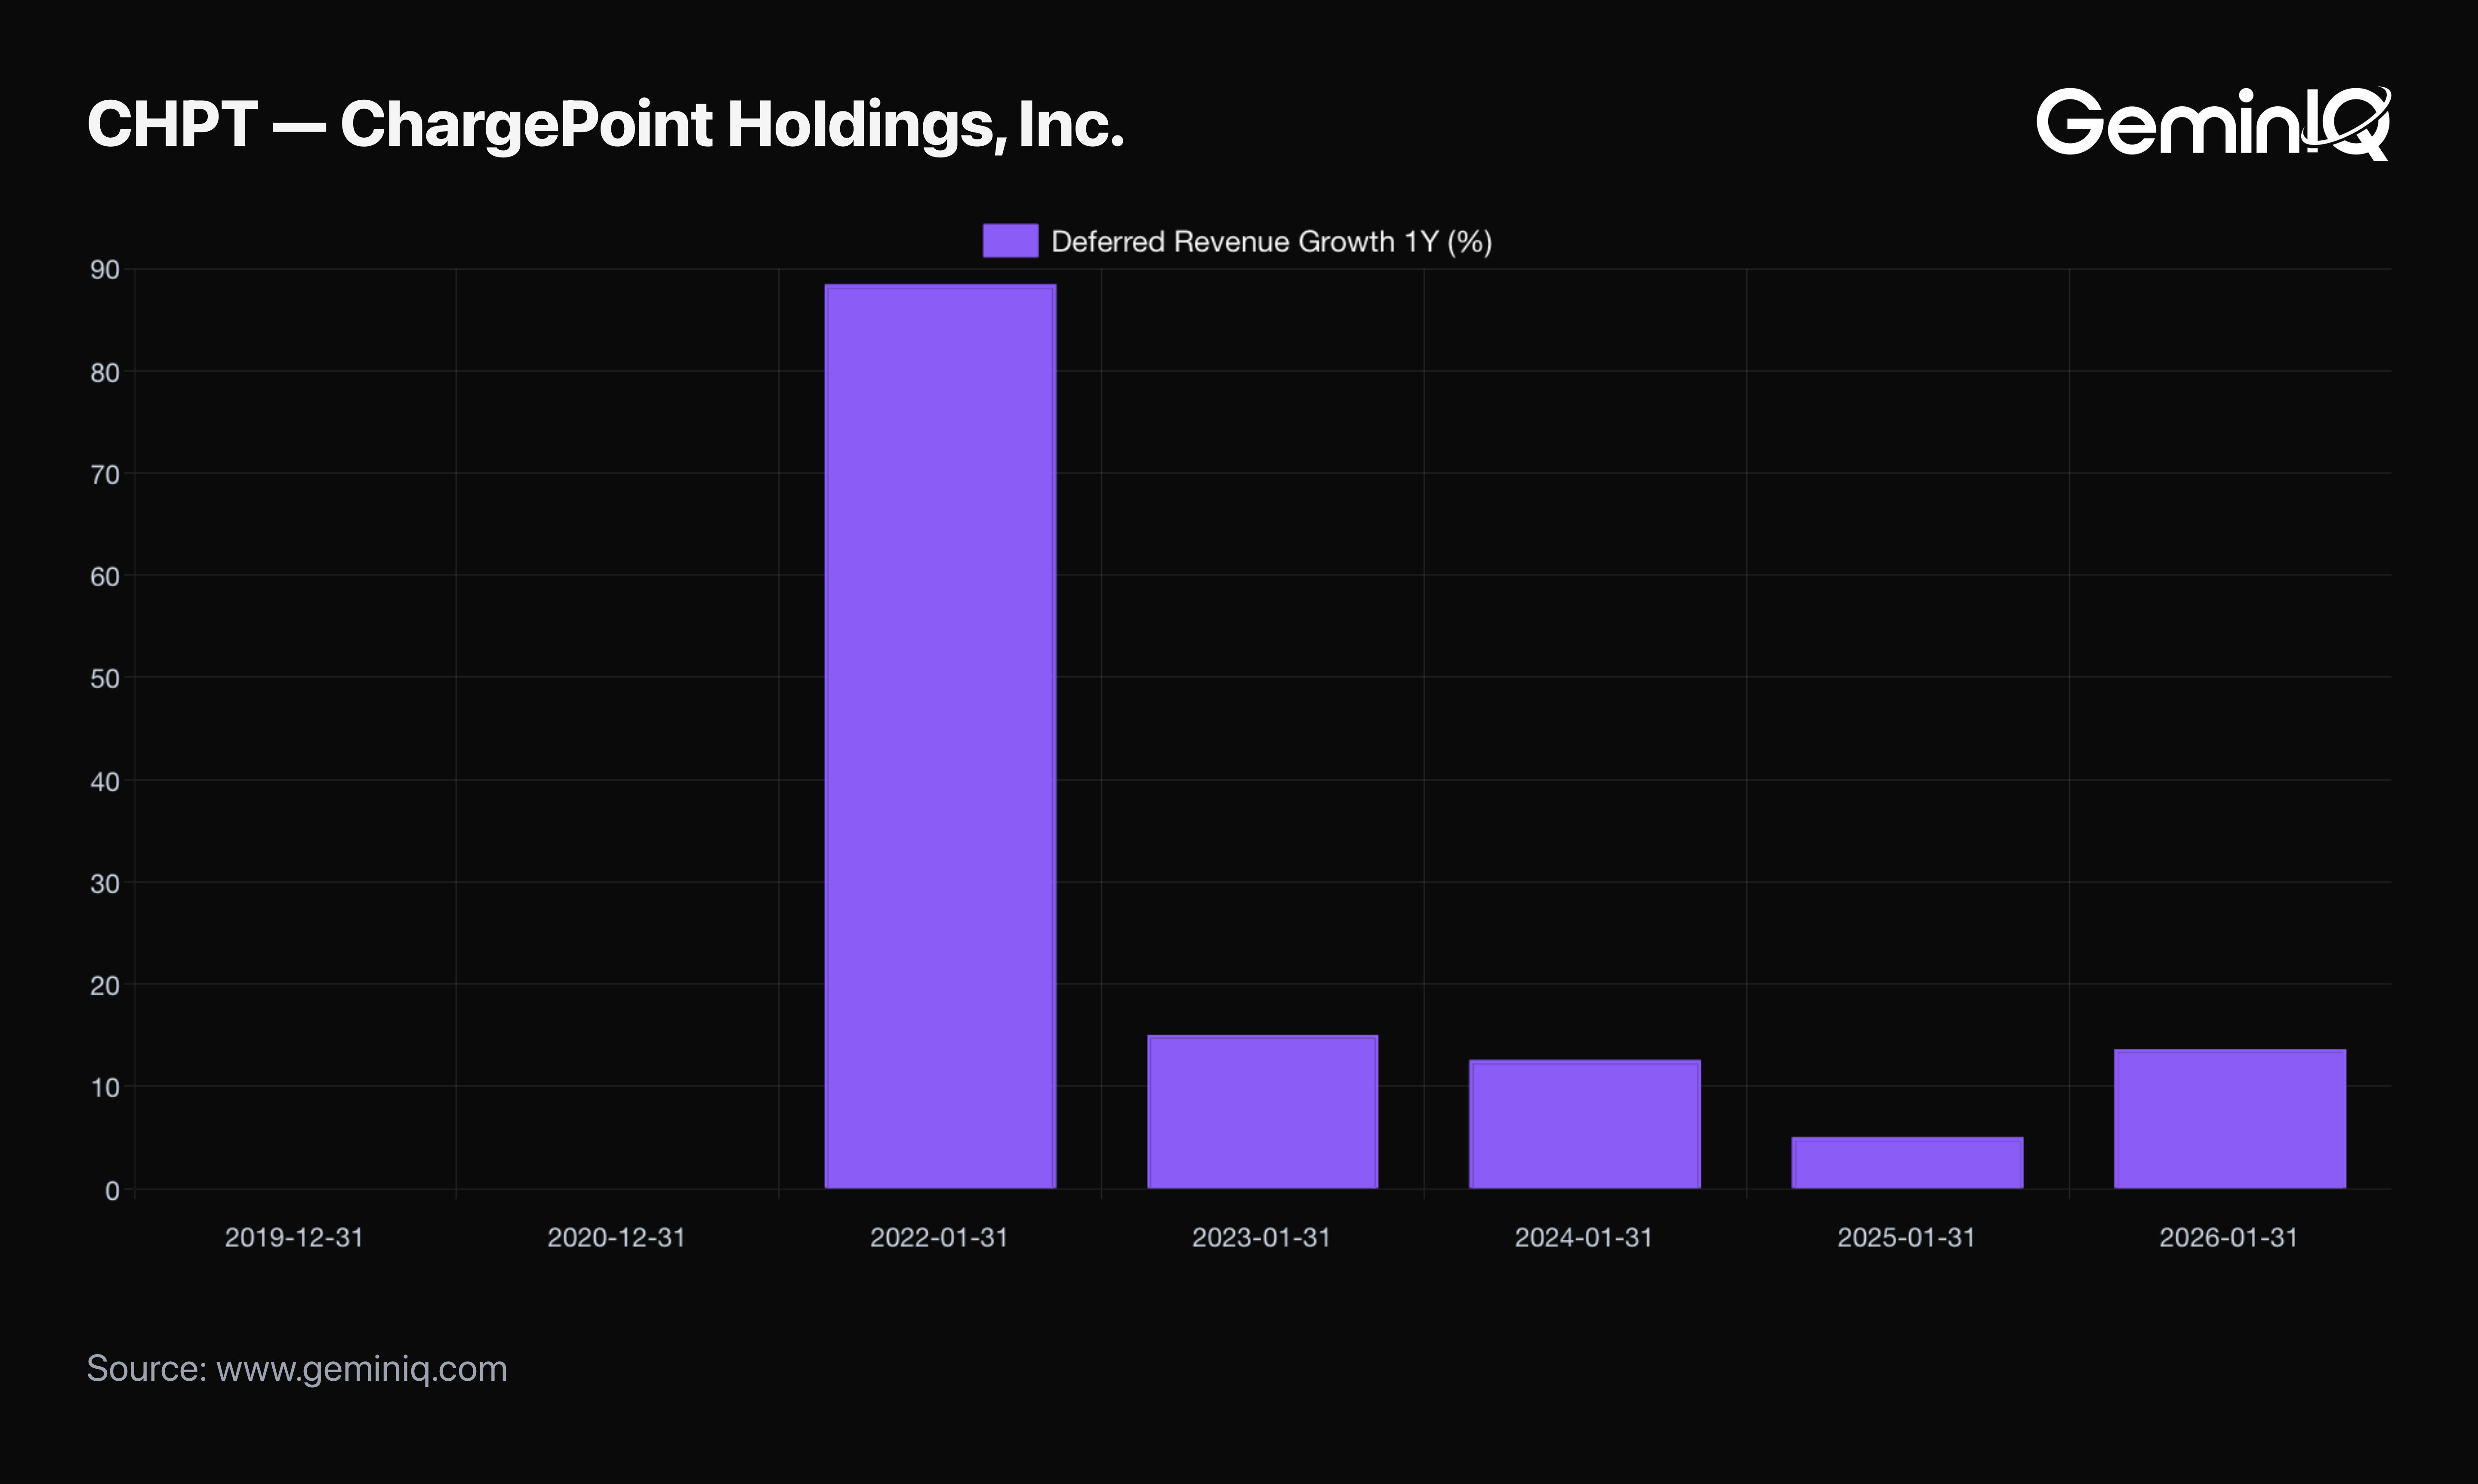
ChargePoint Holdings grew revenue 94.2% in the fiscal year ended January 2023, a headline figure that looked like accelerating demand. Deferred Revenue grew only 15.1% over the same period — a leading indicator for future revenue lagging far behind the revenue already booked. The twelve months that followed produced a cumulative return of -79.83%. Deferred revenue represents cash customers have already paid for services not yet delivered; when it stops keeping pace with reported revenue, growth is running ahead of the pipeline that is supposed to sustain it.
This study reads GeminIQ's as-filed universe of quarterly and annual filings for companies carrying a deferred revenue balance, comparing GeminIQ's pre-calculated Deferred Revenue Growth to Net Revenue TTM Growth 1Y for each filing, joined to GeminIQ's post-filing market reaction data. 35,575 filing-periods across 1,697 companies have both growth figures computed with at least $10 Million in deferred revenue and $50 Million in trailing revenue; 25,021 of those filings also have post-filing return data available. The comparison window runs from each filing's own filed date out to twelve months, and every figure below is measured against the broader universe base rate, not against zero. This is a historical association measured over the sample window — not a forecast for any individual company.
The Pattern
Deferred revenue is normally framed as a positive signal — a subscription or prepaid-service business collecting cash ahead of delivering the product, which is exactly why GeminIQ's own metric documentation calls Deferred Revenue Growth a leading indicator of future recognized revenue. This study tests the flip side of that framing directly: when deferred revenue growth falls behind revenue growth, the pipeline funding tomorrow's reported revenue is expanding more slowly than the revenue already being booked today. That is the kind of gap that shows up in the filing itself before it shows up in a guidance cut.
The Data
Filings were sorted by the spread between deferred revenue growth and revenue growth over the same period. The bottom decile — filings where deferred revenue growth fell furthest behind revenue growth — is compared against the top decile and the rest of the universe at four post-filing checkpoints.
| Checkpoint | Bottom-Decile Gap Cohort (median) | Top-Decile Gap Cohort (median) | Rest of Universe (median) |
|---|---|---|---|
| 1 month | 0.16% | 0.97% | 0.83% |
| 3 months | 0.76% | 2.84% | 2.49% |
| 6 months | -2.02% | 2.66% | 3.49% |
| 12 months | -1.41% | 6.78% | 8.59% |
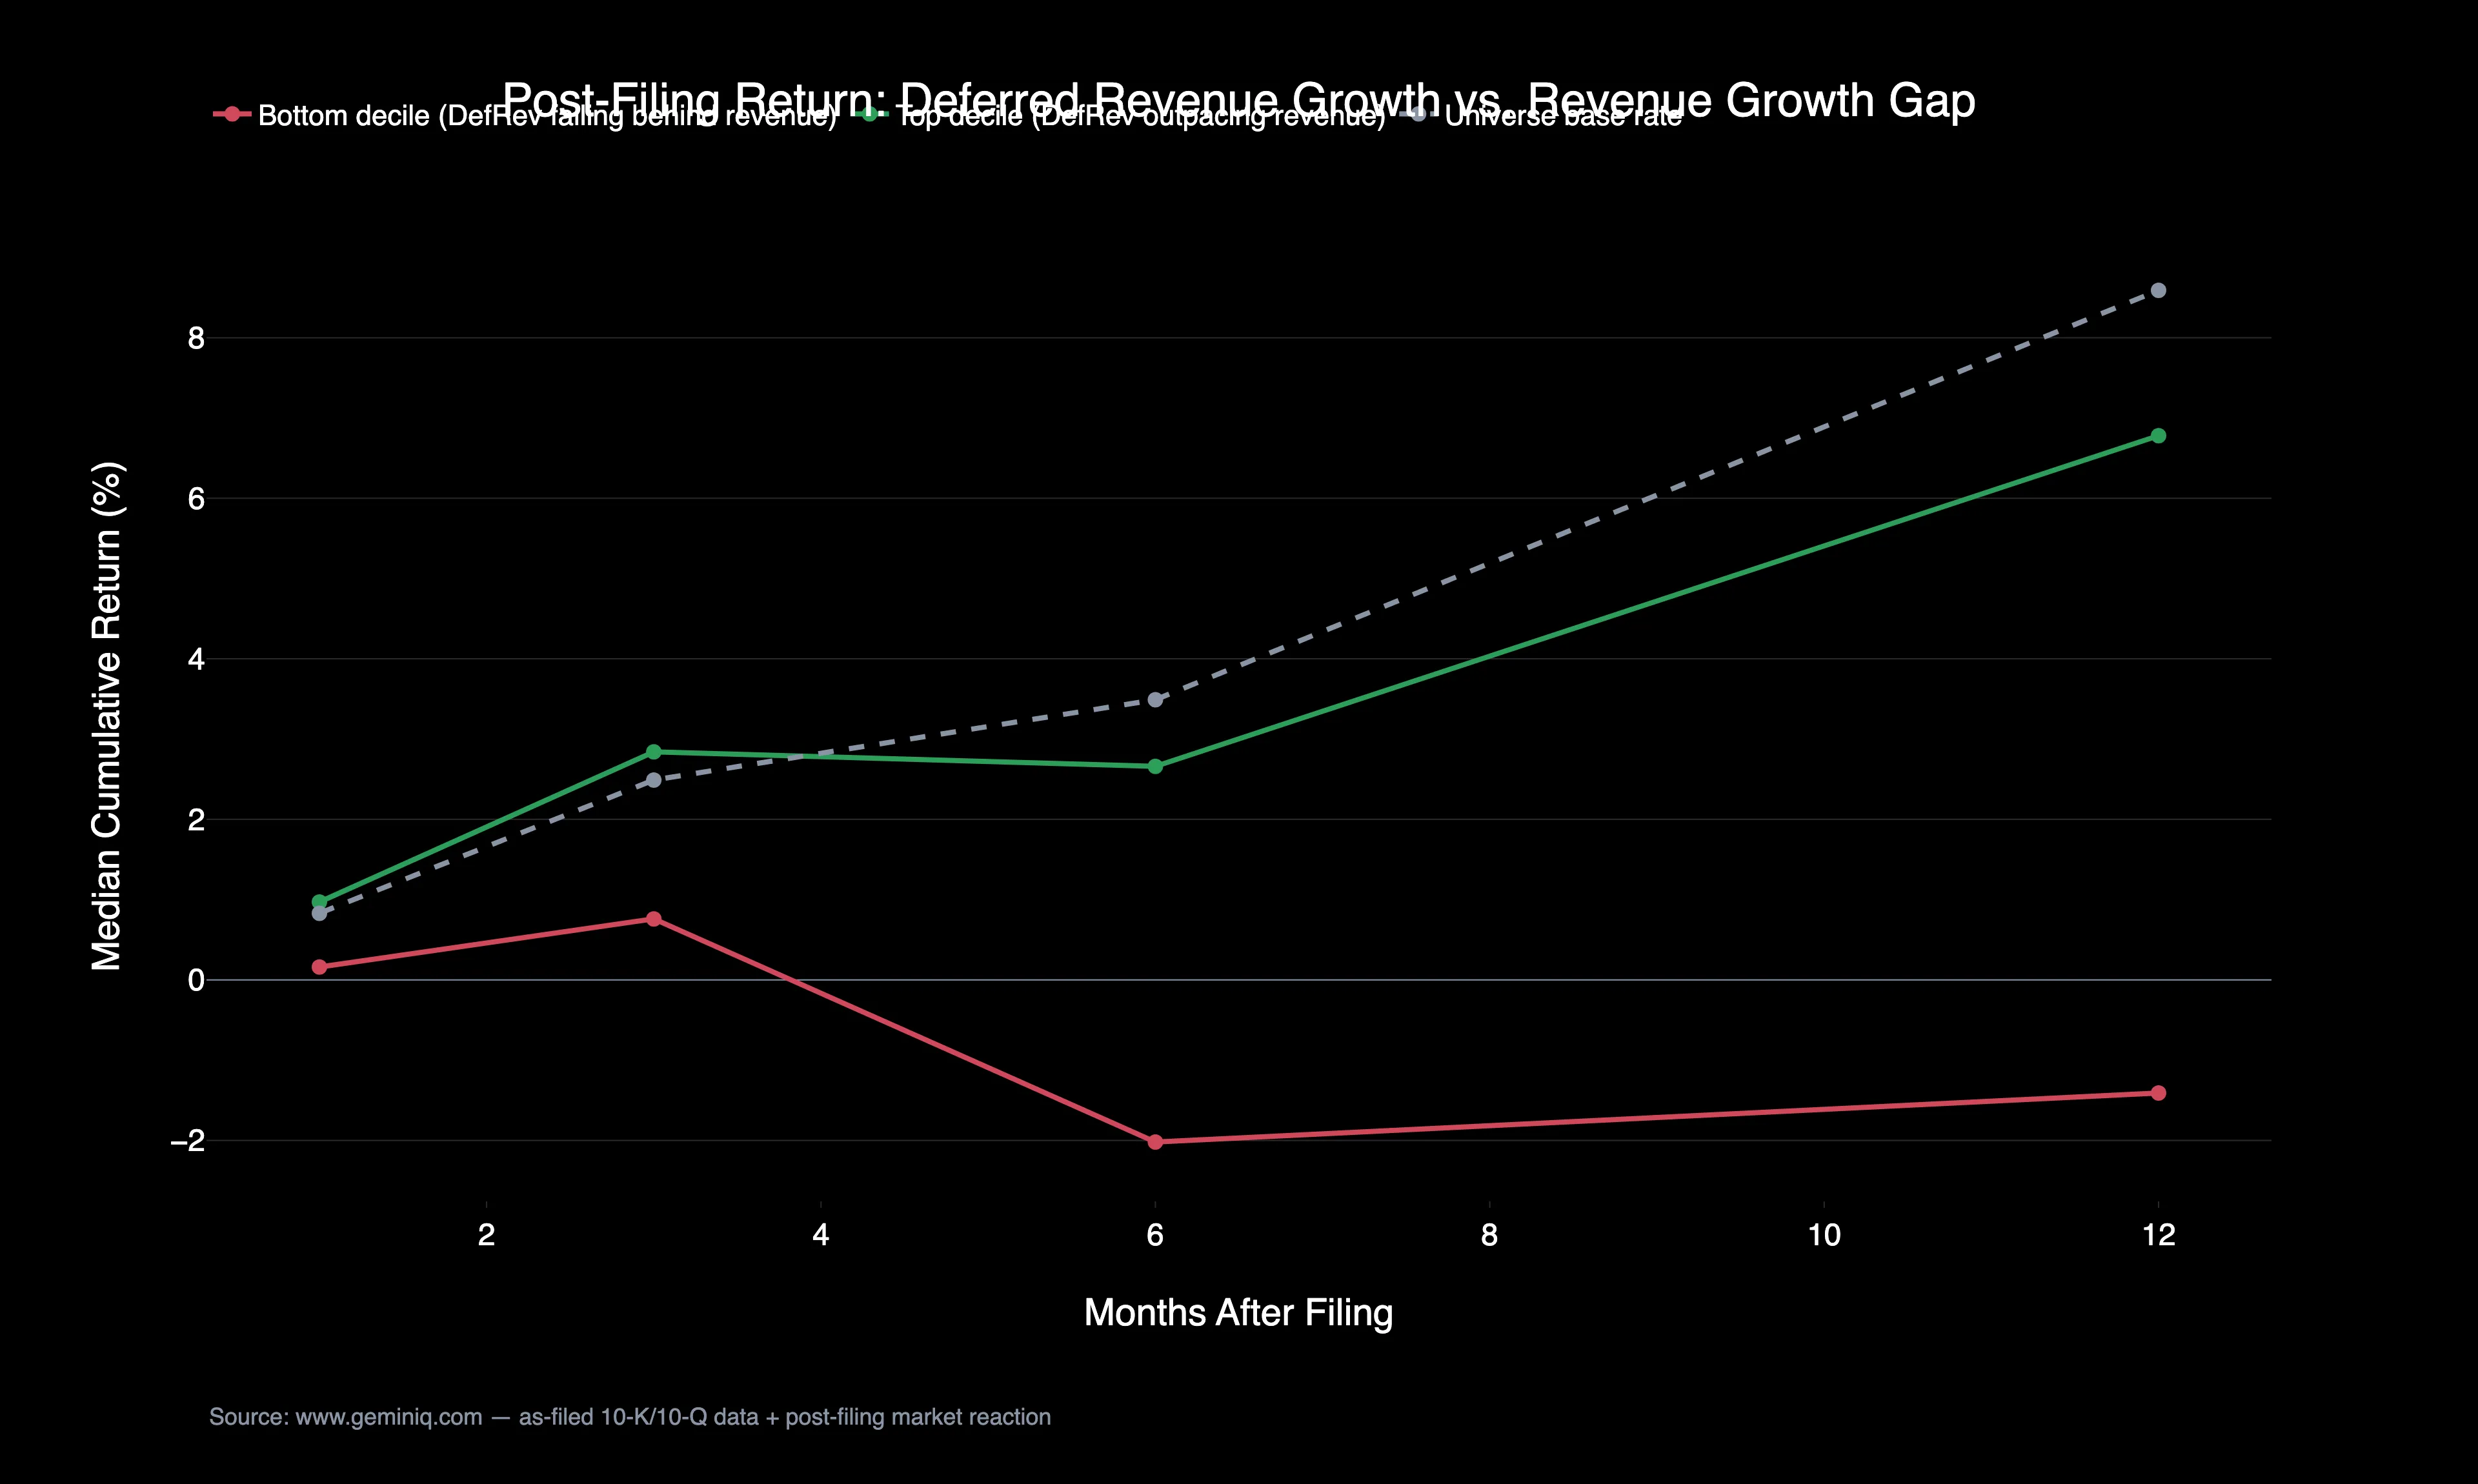
The bottom-decile cohort trails the base rate at every checkpoint, and the gap widens sharply after the first quarter: from roughly 1.7 percentage points behind the base rate at three months to 10 percentage points behind at twelve months. The cohort's own median return turns negative at both the six- and twelve-month marks, while the broader universe stayed positive. The top-decile cohort — deferred revenue growth running well ahead of revenue growth — tells a more mixed story: it modestly outperforms the base rate at one and three months, consistent with the leading-indicator framing, but falls behind the base rate at six and twelve months. Deferred revenue growth outpacing revenue looks like a short-term positive signal in this data. Deferred revenue growth falling behind revenue looks like a more persistent negative one. The top-decile cohort is defined identically — the top ten percent of filings by the same spread — so it carries the same order of sample size as the bottom-decile cohort at every checkpoint, from roughly 2,460 filings at one month down to 274 at twelve months; the remaining rest-of-universe cohort spans the other 80% of filings and is several times larger again at each checkpoint. All three cohorts clear this study's roughly 200-filing floor at every checkpoint shown.
The Extremes
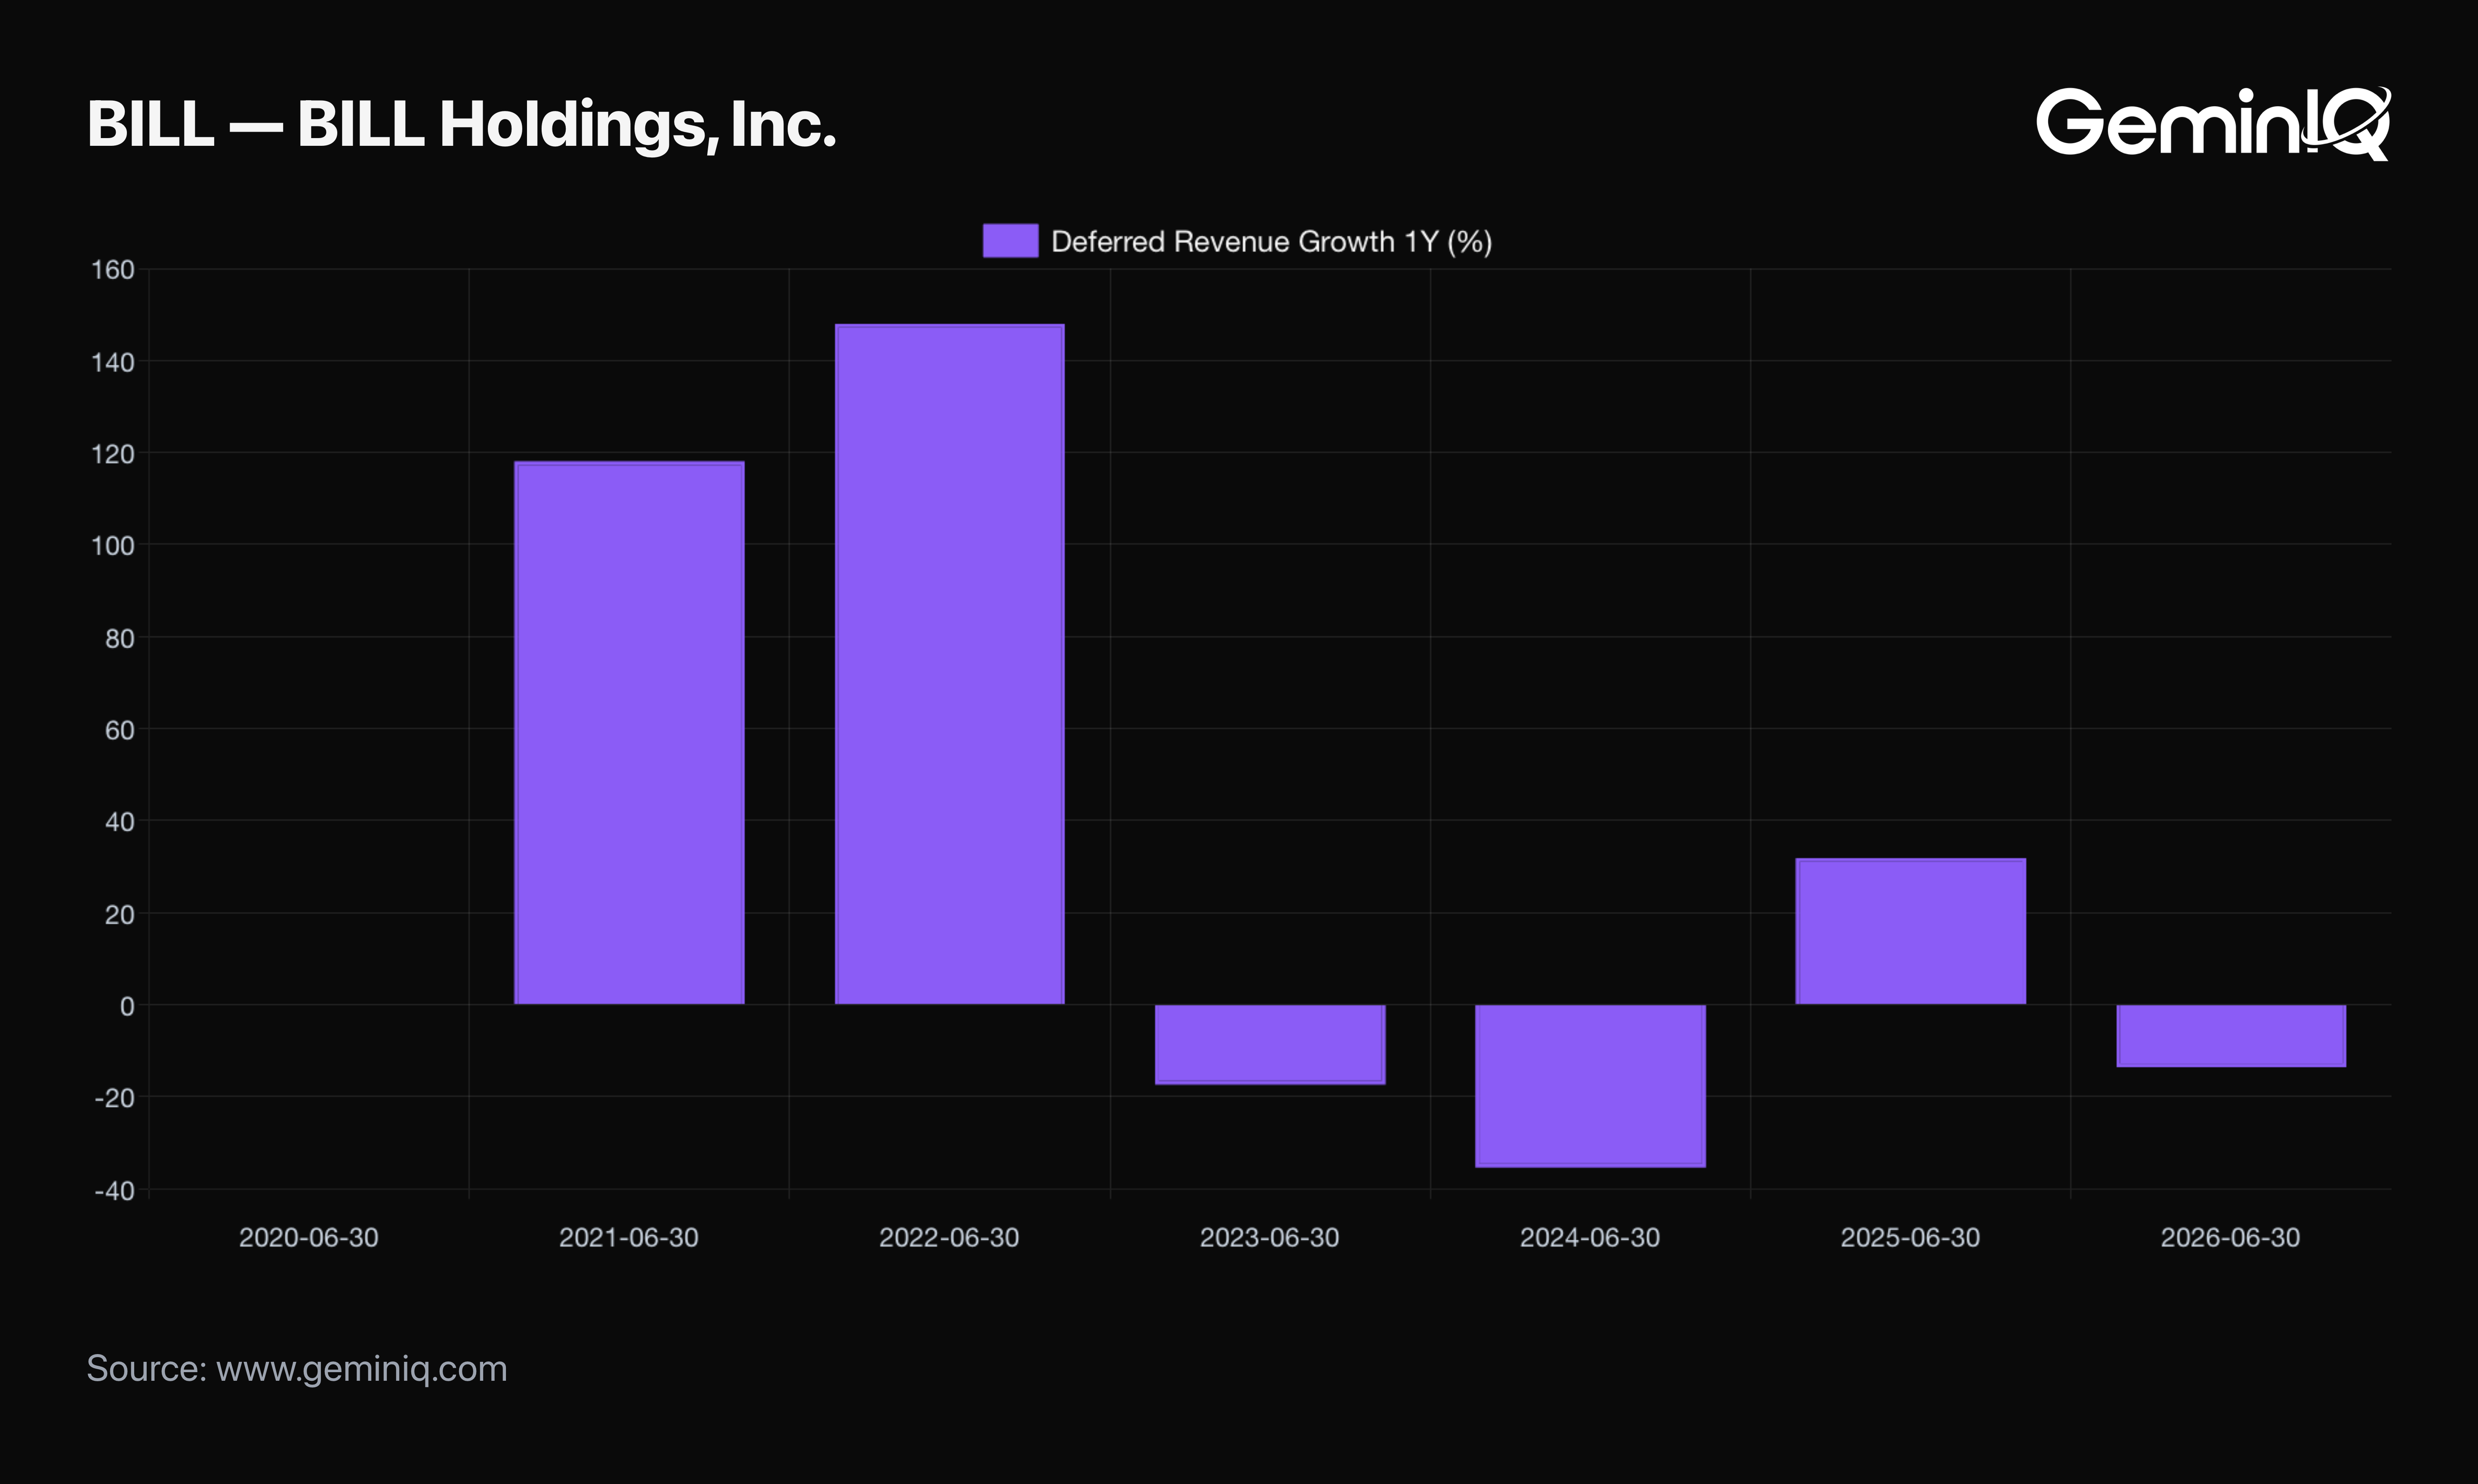
ChargePoint, cited in the opening, sits in a well-documented stretch for electric-vehicle charging infrastructure companies working through a slower-than-expected commercial buildout. BILL Holdings shows a sharper version of the same gap: in the fiscal year ended June 2023, revenue grew 64.9% while Deferred Revenue actually declined 17.4% — not merely decelerating, but shrinking outright against still-fast-growing reported revenue. The following twelve months produced a -52.68% return. Both companies were widely covered for slowing growth in the following year; the deferred-revenue gap was visible in the filing arithmetic before either became a headline.
The Method
Deferred Revenue Growth and Net Revenue TTM Growth 1Y are both GeminIQ pre-calculated metrics, built directly from as-filed balance sheet and income statement data. The universe is restricted to companies carrying a deferred revenue balance of at least $10 Million and trailing revenue of at least $50 Million, to exclude small or newly-disclosed positions that can produce misleadingly large percentage swings. The growth-rate spread is winsorized at the top and bottom 1% before bucketing. Post-filing returns are cumulative from each filing's own filed date and are never compounded or added across checkpoints. Full methodology is covered in How GeminIQ Builds Filing Data Studies.
Check Your Holdings
Pull up any subscription or prepaid-service position's Deferred Revenue on GeminIQ's Financial Statements view or its pre-calculated Deferred Revenue Growth figure in Calculated Metrics, and compare it directly to Net Revenue TTM Growth 1Y for the same period. A deferred-revenue growth rate that has fallen meaningfully behind revenue growth isn't a guaranteed warning on its own, but it's a two-line comparison worth running before trusting a headline revenue number at face value.
Frequently Asked Questions
What does it mean when deferred revenue growth falls behind revenue growth?
Deferred revenue represents cash already collected for products or services not yet delivered, and it is widely treated as a leading indicator of future recognized revenue for subscription and prepaid-service businesses. When its growth rate falls behind the growth rate of revenue already being recognized, the forward-looking pipeline is expanding more slowly than the revenue currently being booked — a gap that can show up in filings before it shows up in guidance.
How many filings does this finding cover?
35,575 filing-periods across 1,697 companies have both growth figures computed, restricted to companies with at least $10 Million in deferred revenue and $50 Million in trailing revenue. 25,021 of those filings also have post-filing return data, with the bottom-decile cohort ranging from 2,460 filings at the one-month checkpoint to 274 at twelve months.
Is a high deferred-revenue-growth-to-revenue-growth ratio always a good sign?
Not consistently. Filings where deferred revenue growth ran furthest ahead of revenue growth modestly outperformed the base rate at one and three months, but fell behind it at six and twelve months in this data — a shorter-lived effect than the persistent, widening underperformance seen when deferred revenue growth falls behind revenue.
Wall Street's data. Main Street's price.
Institutional terminals charge thousands a year for as-filed accuracy. GeminIQ gives you the same thing for a fraction of the cost: financials built directly from raw SEC EDGAR filings, not third-party APIs, with full XBRL traceability back to the original 10-K or 10-Q. No normalized guesswork, just calculated metrics, charts, screeners, and watchlists built on numbers exactly as the company reported them. Start researching now at GeminIQ.com.
Data Appendix: Universe of 1,697 companies drawn from GeminIQ's as-filed 10-K and 10-Q database, publicly available on SEC EDGAR. 35,575 filing-periods were screened for the spread between GeminIQ's pre-calculated Deferred Revenue Growth and Net Revenue TTM Growth 1Y, restricted to companies with at least $10 Million in deferred revenue and $50 Million in trailing revenue; 25,021 filings had matching post-filing return data, drawn from GeminIQ's partial price-history coverage. The growth-rate spread is winsorized at the top and bottom 1% before bucketing. Methodology: How GeminIQ Builds Filing Data Studies.
Disclaimer: The content in this blog is for educational and entertainment purposes only and does not constitute financial, legal, or tax advice. Investing involves risk, including the loss of principal. The views expressed are my own and not intended as financial advice or a guarantee of future performance.