
ExxonMobil 10-K Analysis (2026): Earnings Down, Multiple Up

By Chad Hartman
Published · Last updated
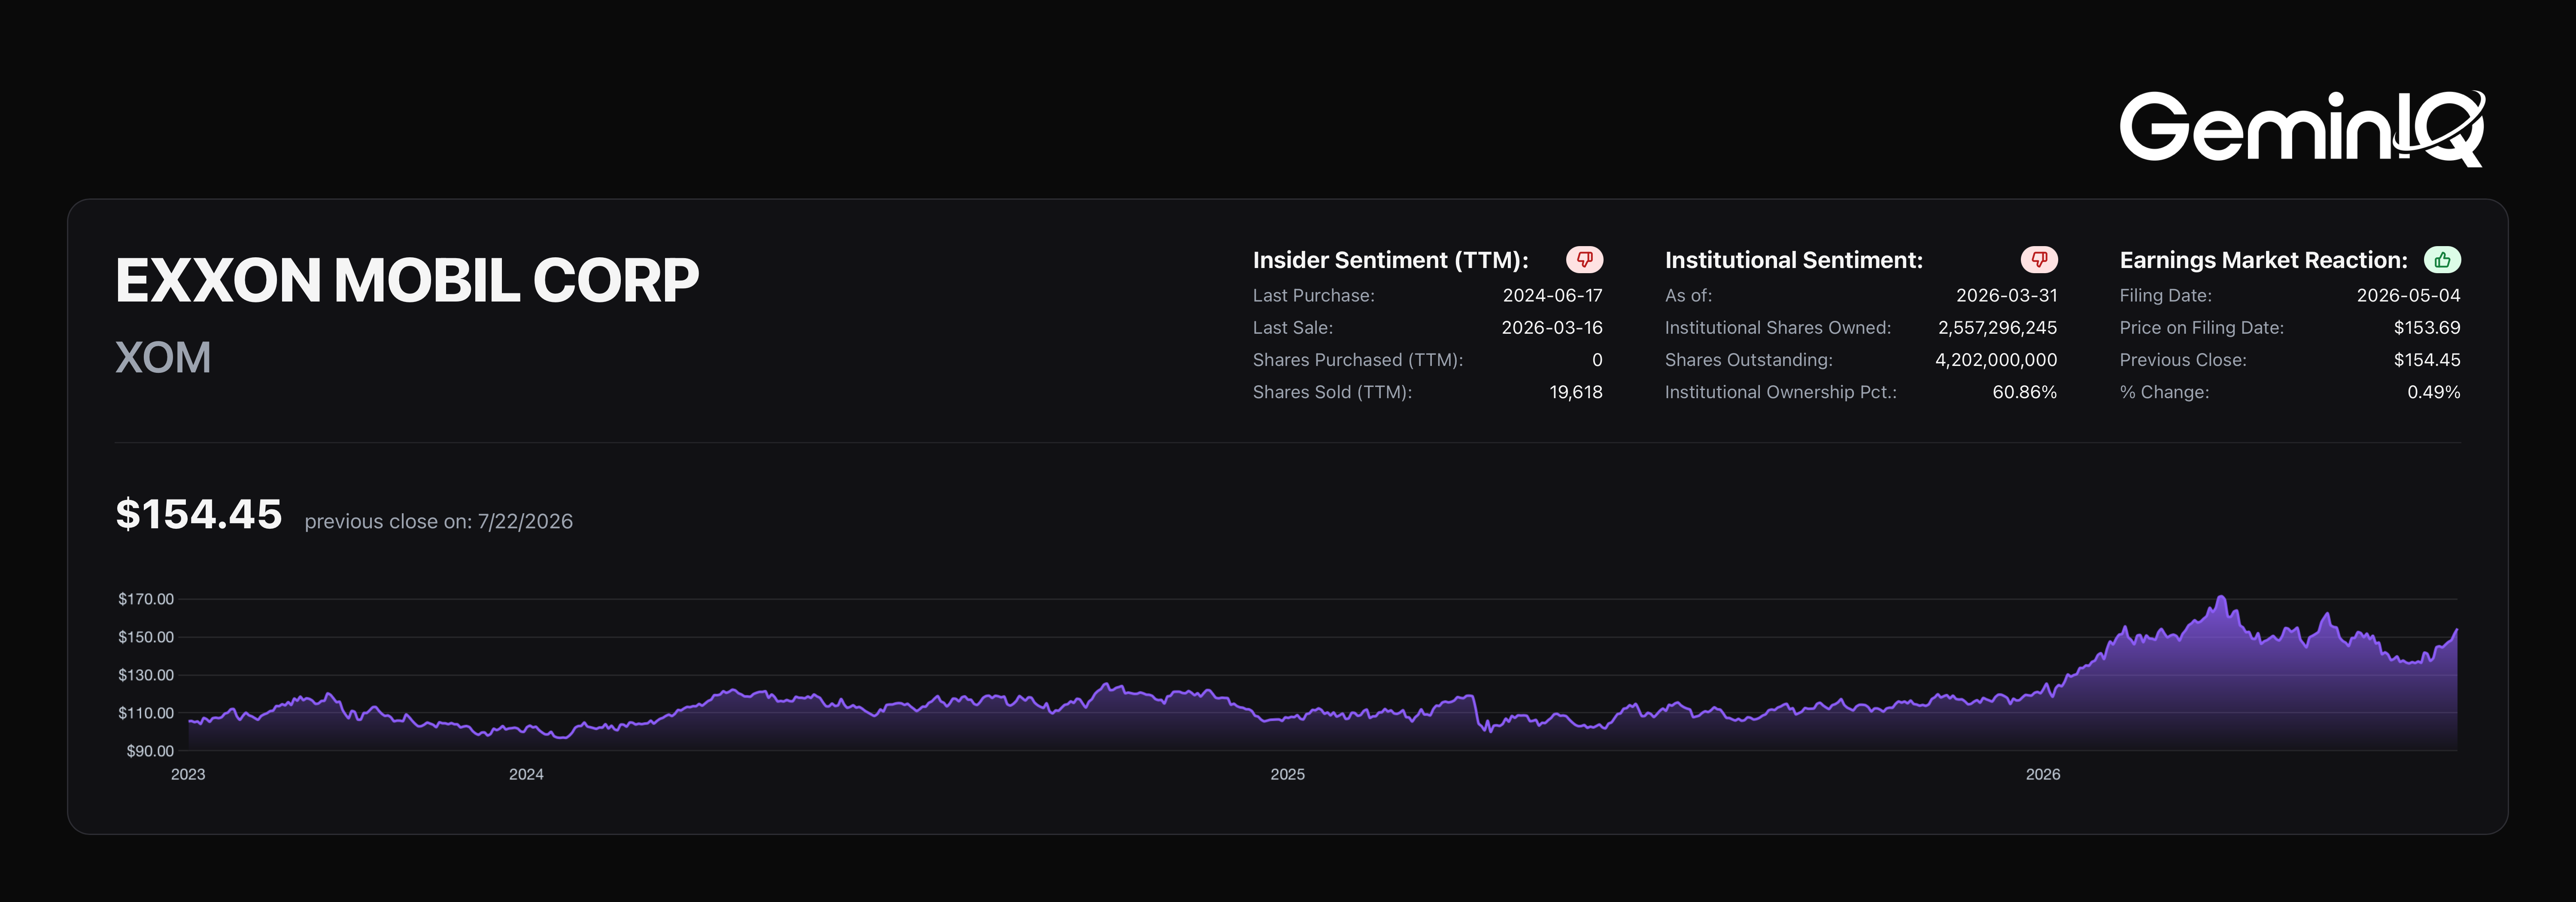
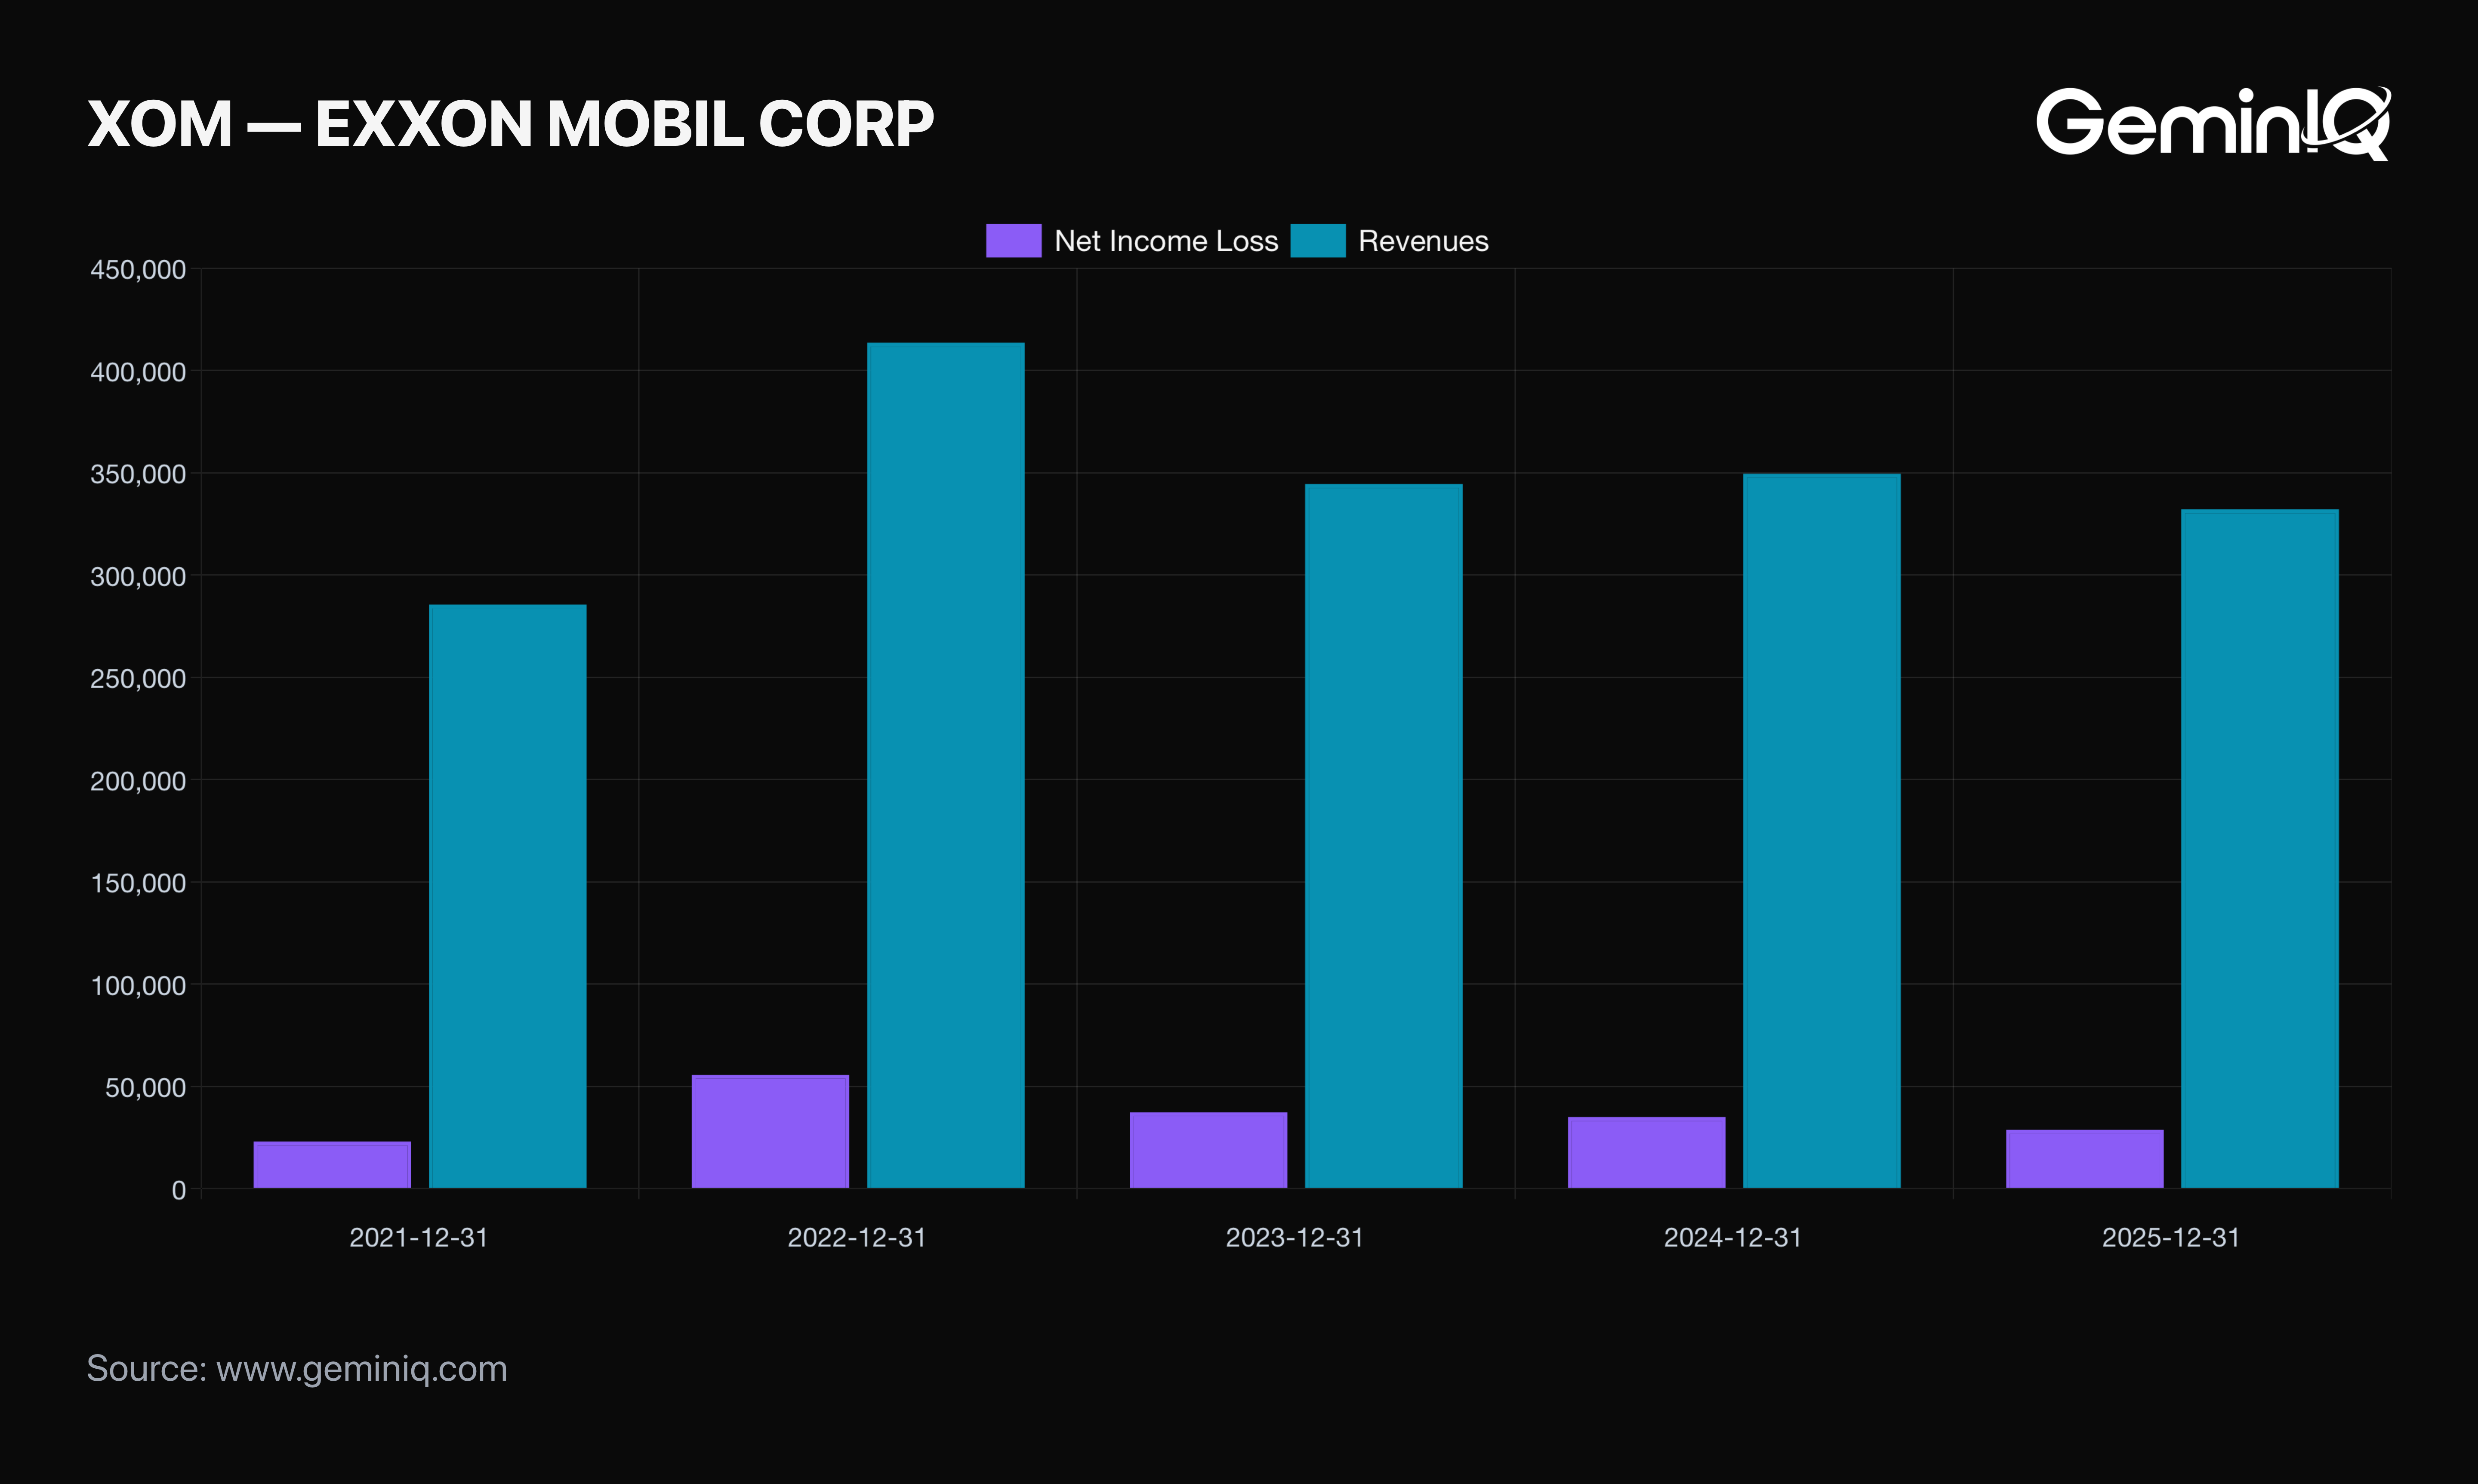
ExxonMobil ($XOM) filed its FY2025 10-K on February 18, 2026. Net income came in at $28.84 Billion, the third consecutive annual decline and 48.3% below the $55.74 Billion the company earned in 2022. Over that same three-year stretch the share price rose from $98.16 to $118.70, a gain of 21.0%. Earnings fell by nearly half and the stock went up. The trailing price-to-earnings ratio did the entire job, expanding from 7.41 to 17.72.
| Field | Value |
|---|---|
| Ticker | $XOM |
| Filing | FY2025 10-K |
| Filed | February 18, 2026 |
| Period End | December 31, 2025 |
| Net Income (FY2025) | $28.84 Billion |
| Net Income Change vs 2022 | -48.3% |
| Share Price Change vs 2022 | +21.0% |
| P/E (TTM) | 17.72 |
Three Straight Years of Falling Earnings
The 2022 result was an outlier and everyone knew it at the time. What is less discussed is that nothing has stabilized since.
The Data: ExxonMobil's Net Income (Loss) Attributable To ExxonMobil peaked at $55.74 Billion in FY2022. It fell to $37.35 Billion in FY2023, $35.06 Billion in FY2024, and $28.84 Billion in FY2025. That is three consecutive annual declines totaling 48.3%. Revenues followed the same direction, from $413.7 Billion in FY2022 to $332.24 Billion in FY2025, a decline of 19.7%.
Cash generation fell harder than either. GeminIQ's pre-calculated Free Cash Flow dropped from $58.39 Billion in FY2022 to $23.61 Billion in FY2025, a decline of 59.6%. In the most recent year alone, Net Cash Provided By Operating Activities came to $51.97 Billion against $55.02 Billion the year before, while capital expenditure rose to $28.36 Billion from $24.31 Billion.
The GeminIQ Edge: A single year against a cyclical peak proves nothing. Three consecutive declines with revenue, earnings and free cash flow all pointing the same way is a different observation, and it only becomes visible when the Financial Statements are read as a multi-year series rather than a year-over-year comparison.
The Share Price Went the Other Way
If earnings fell 48.3% and the stock rose 21.0%, the difference has to come from somewhere. It came from what the market was willing to pay per dollar of those earnings.
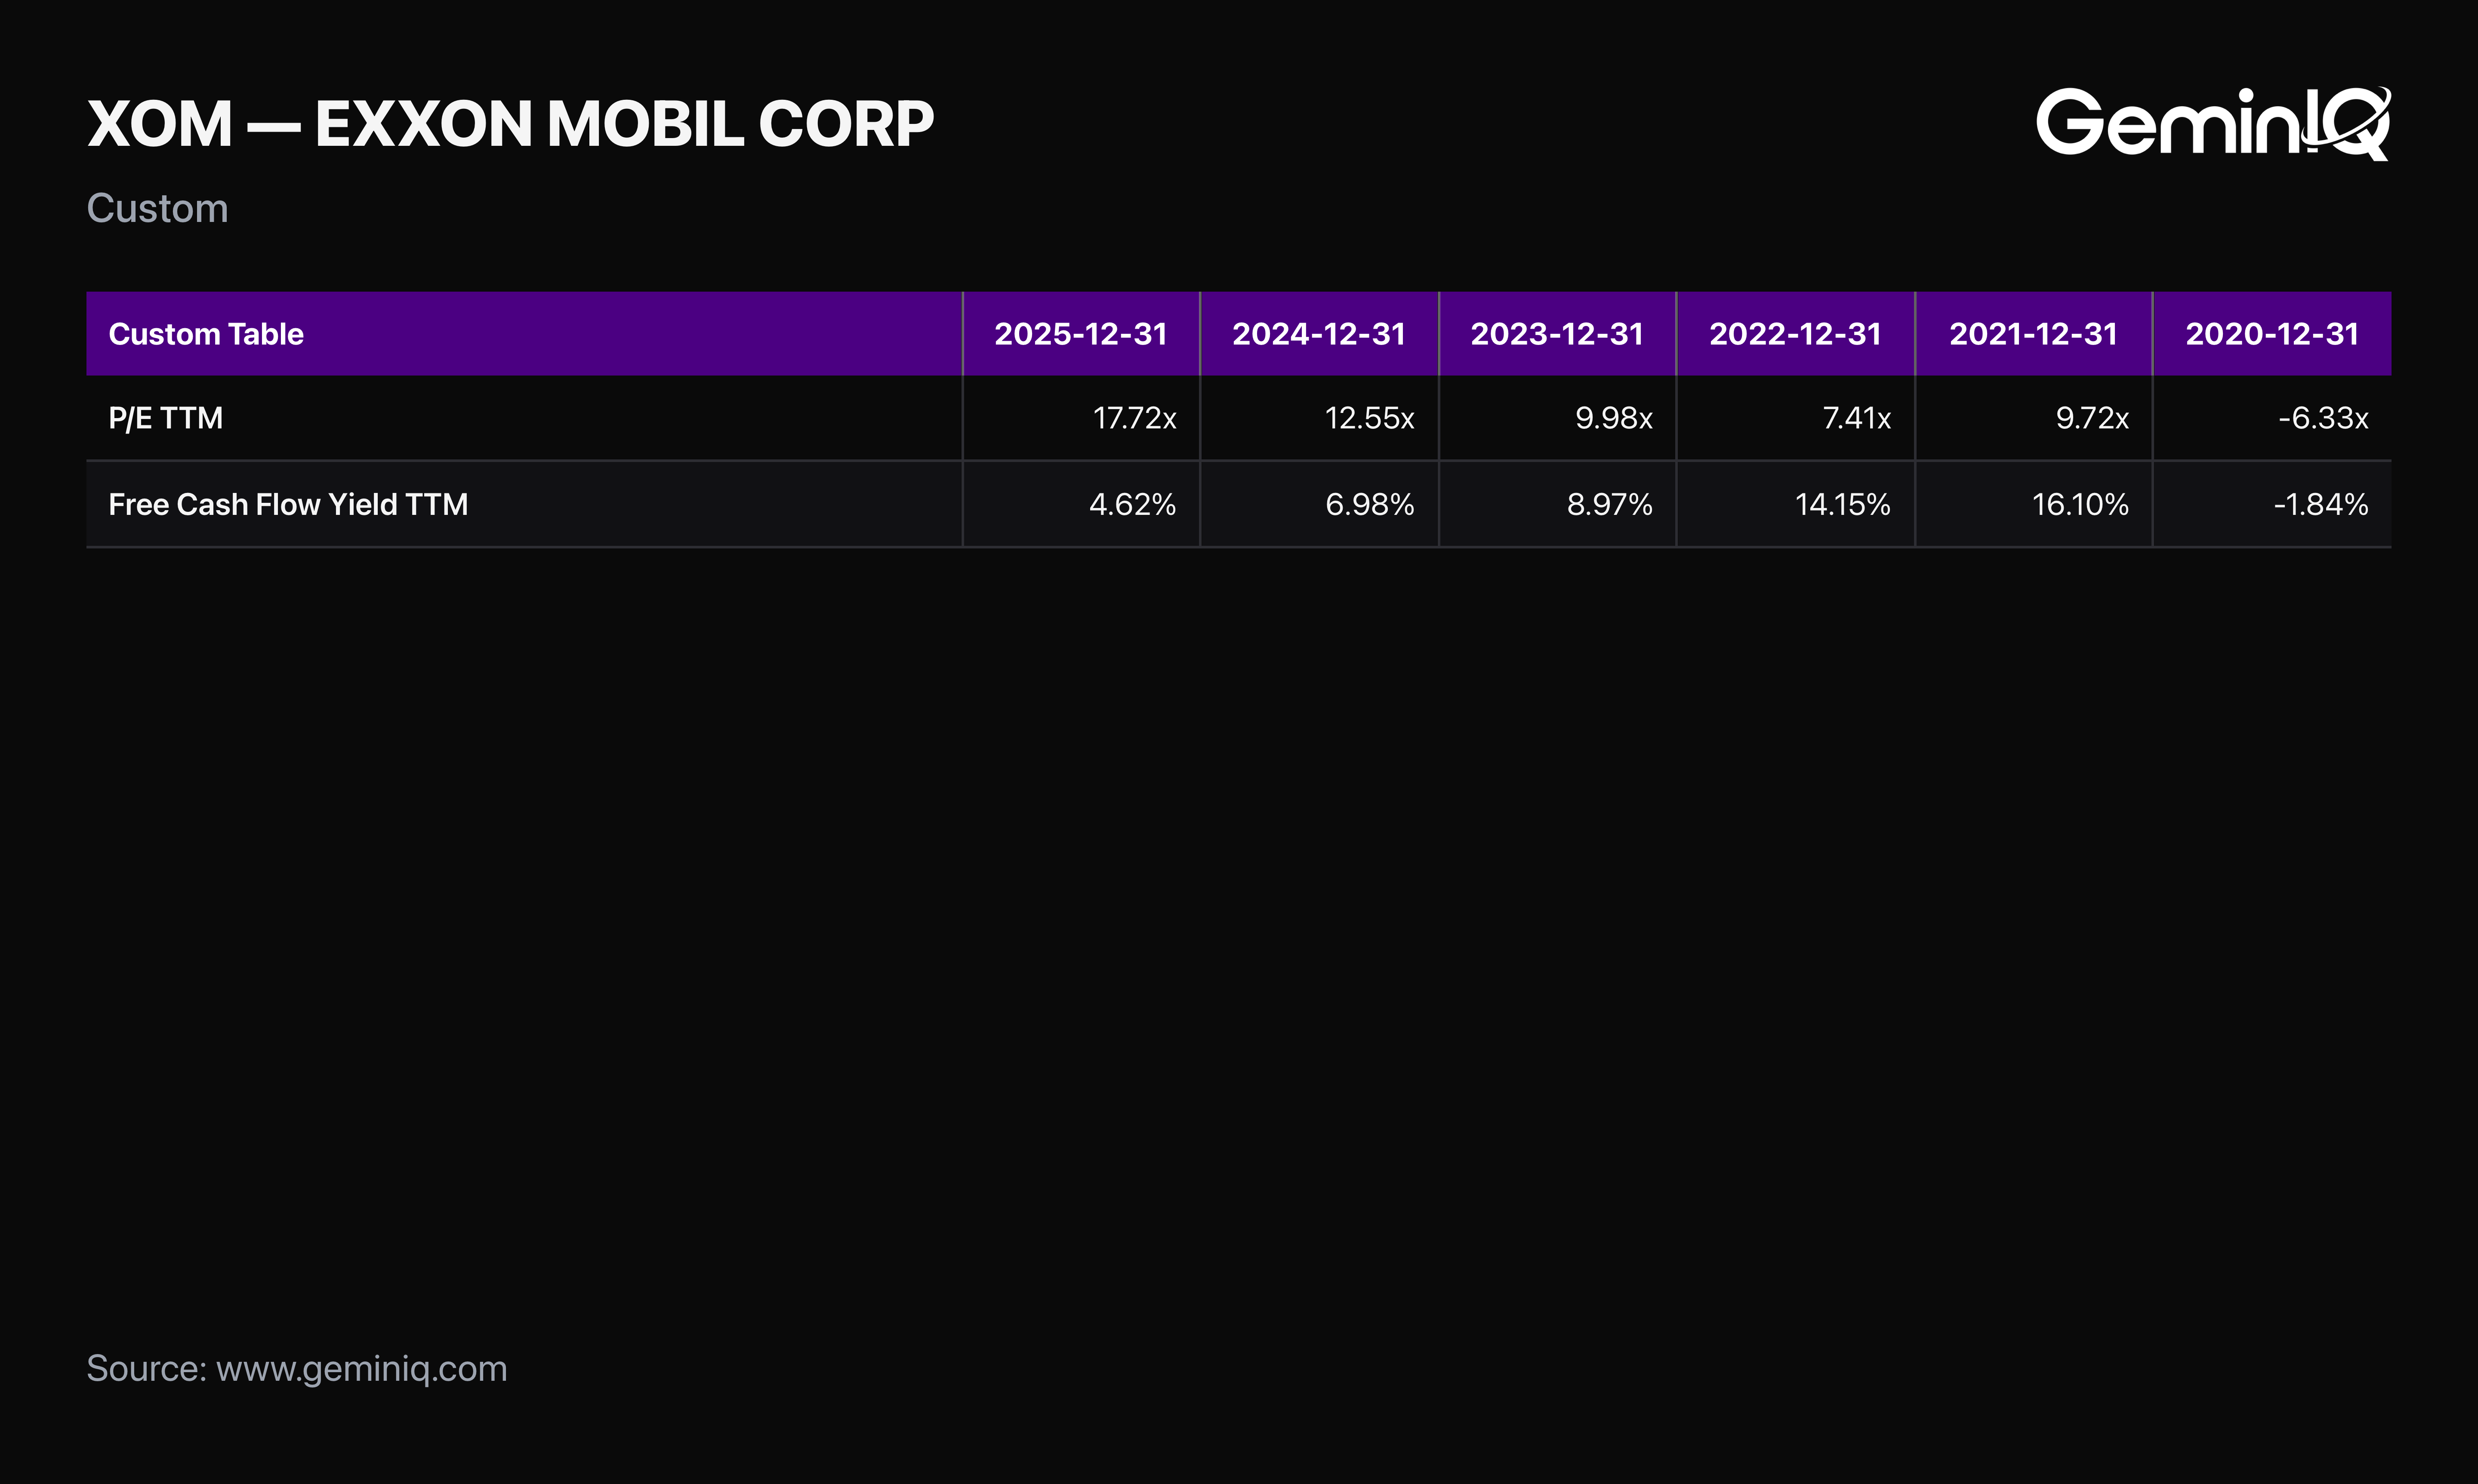
The Data: ExxonMobil's closing price moved from $98.16 at the end of FY2022 to $118.70 at the end of FY2025, and market capitalization from $412.8 Billion to $511.2 Billion, a gain of 23.8%. Over the same window the trailing Price to Earnings Ratio expanded from 7.41 to 17.72, an increase of 139.3%. Price to Book moved from 2.04 to 1.92, so the re-rating shows up against earnings rather than against assets.
The cash-based valuation moved further. GeminIQ's Free Cash Flow Yield fell from 14.15% in FY2022 to 4.62% in FY2025, a decline of 67.3%, reflecting both the smaller cash figure and the larger market capitalization.
The GeminIQ Edge: Multiple expansion is not a criticism. Investors re-rate businesses for reasons that never appear in a filing, and a 7.41 starting multiple was arguably too low. What the filing does establish is the arithmetic: none of the 21.0% price gain since 2022 was funded by earnings growth, because there wasn't any.
Where the Capital Efficiency Went
The profit decline is only half the ratio. The capital base did the other half.
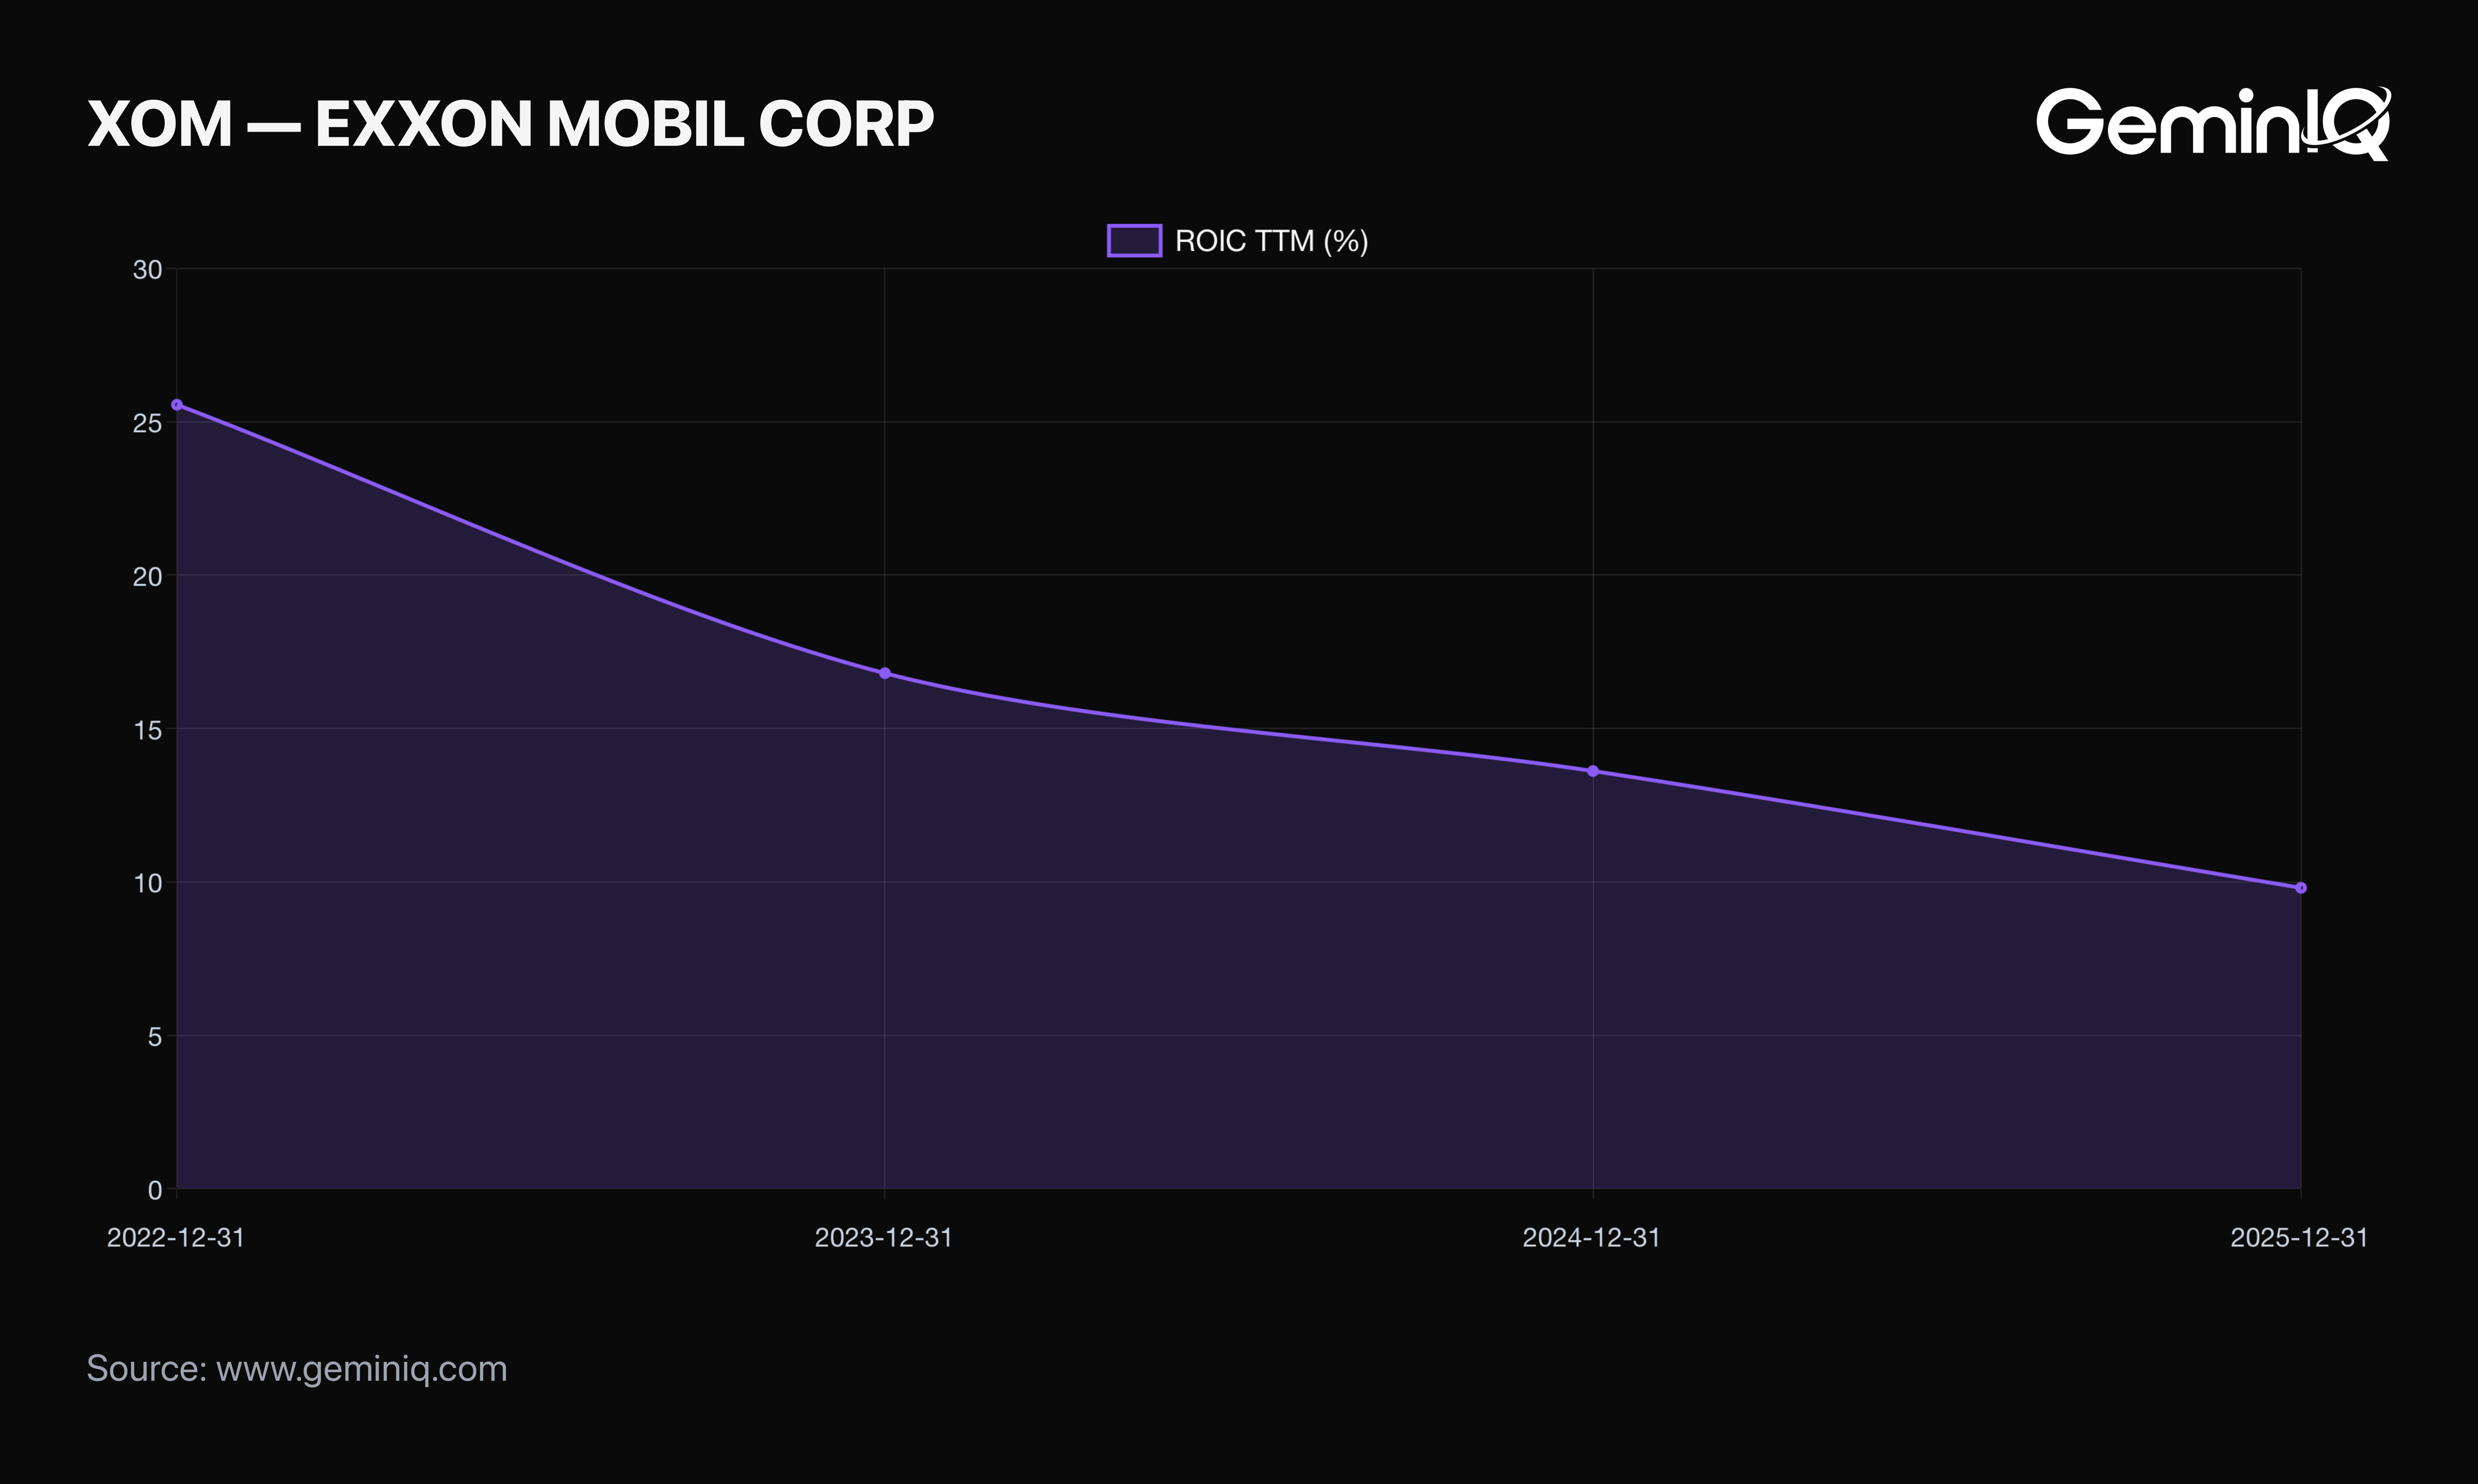
The Data: GeminIQ's Return on Invested Capital for ExxonMobil fell from 25.56% in FY2022 to 9.81% in FY2025, a decline of 61.6%. Net Operating Profit After Tax fell 48.0%, from $56.81 Billion to $29.54 Billion, while Invested Capital rose 37.7%, from $222.3 Billion to $306.1 Billion. Return on Equity followed, from 29.48% to 10.74%.
The balance sheet carried the expansion. Total Assets grew from $369.1 Billion to $449.0 Billion across the period, and GeminIQ's Net Debt rose from $11.53 Billion at the end of FY2022 to $32.86 Billion at the end of FY2025.
The GeminIQ Edge: A 9.81% return on invested capital is not a distress reading for an integrated major, and the FY2022 figure of 25.56% was a cycle peak that was never going to hold. The point of putting them side by side is that the multiple moved in the opposite direction to the return on capital, which is the relationship most valuation frameworks assume runs the other way.
Costs Rose While Revenue Fell
The most recent year has a detail worth isolating, because it separates price-driven decline from cost-driven decline.
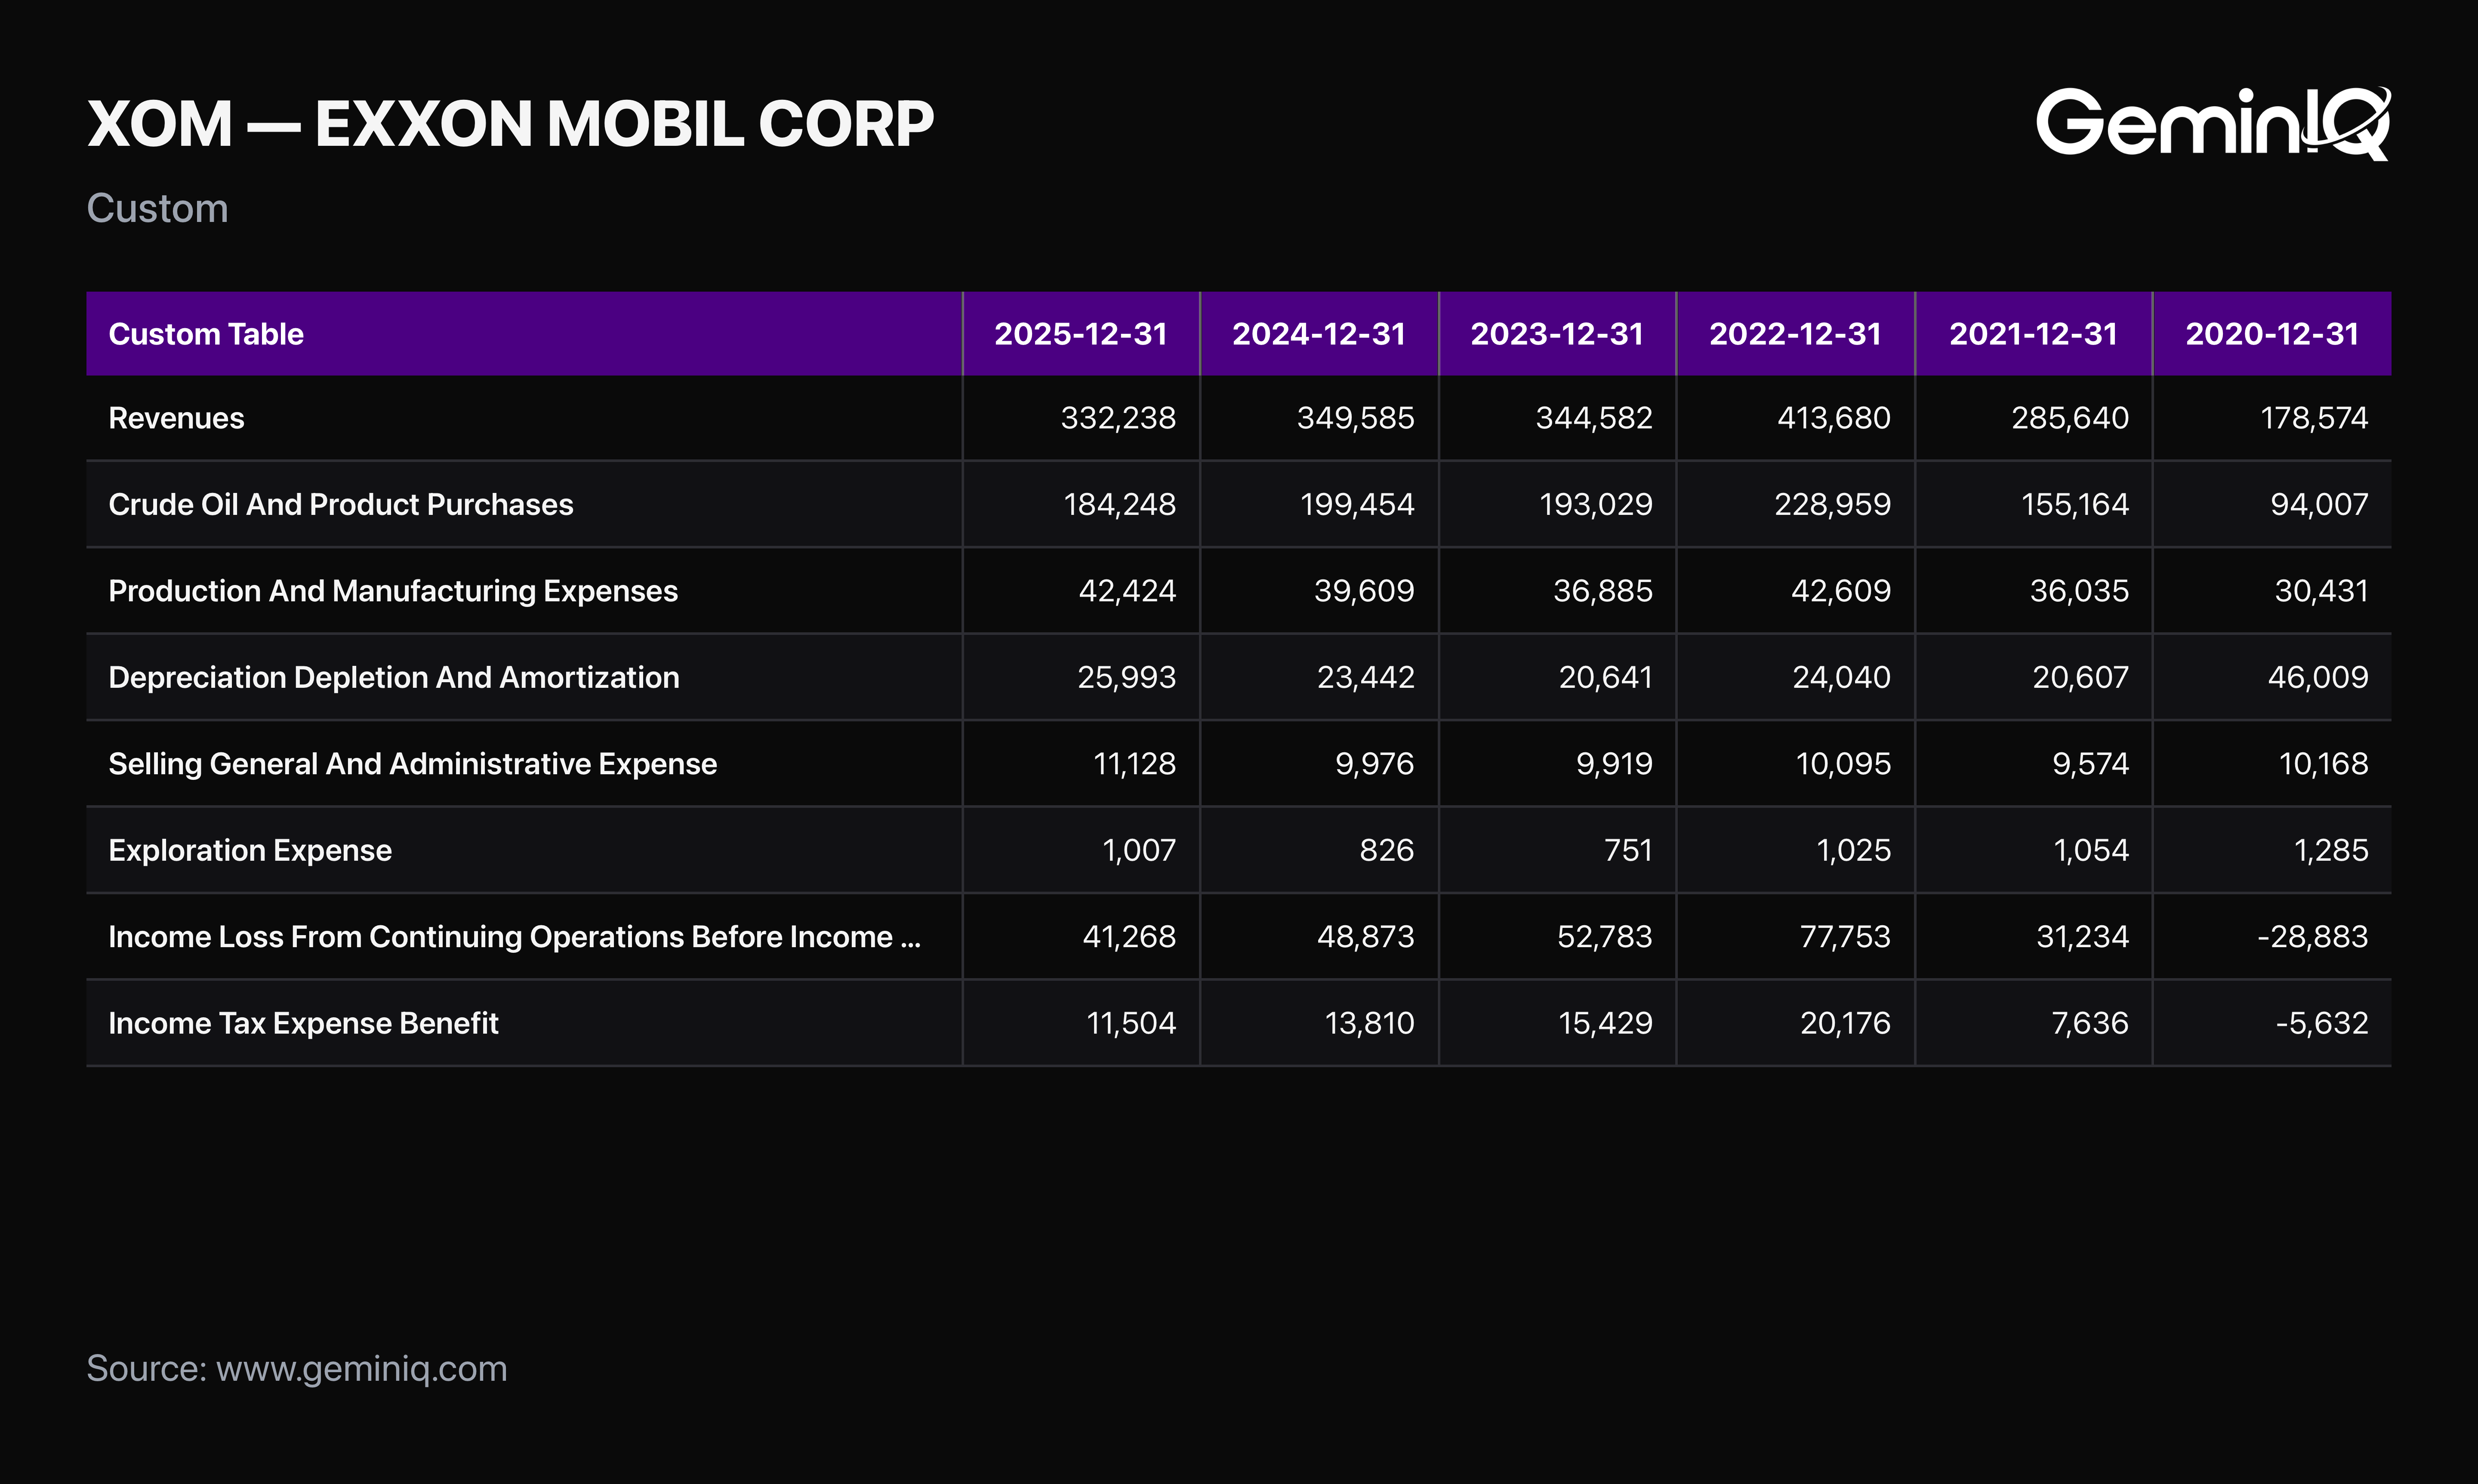
The Data: ExxonMobil's Revenues fell 5.0% in FY2025, from $349.59 Billion to $332.24 Billion. Crude Oil And Product Purchases fell faster, down 7.6% from $199.45 Billion to $184.25 Billion, which is what should happen when input costs track output prices. The controllable cost lines went the other way. Production And Manufacturing Expenses rose 7.1% to $42.42 Billion. Depreciation And Depletion, filed as Depreciation Depletion And Amortization, rose 10.9% to $25.99 Billion. Selling, General And Administrative Expenses rose 11.5% to $11.13 Billion. Exploration Expenses, Including Dry Holes rose 21.9% to $1.01 Billion.
Income Before Income Taxes finished at $41.27 Billion against $48.87 Billion, and the tax charge fell to $11.50 Billion from $13.81 Billion.
The GeminIQ Edge: Falling revenue at an oil major is usually read as a commodity price story and dismissed as outside management's control. The cost lines are the part that is not. Four separate expense categories grew between 7.1% and 21.9% in a year when the top line contracted, and that combination is what turns a price cycle into a margin problem.
Smart Money and the Insider Record
What are the people actually running the company doing with their own money?
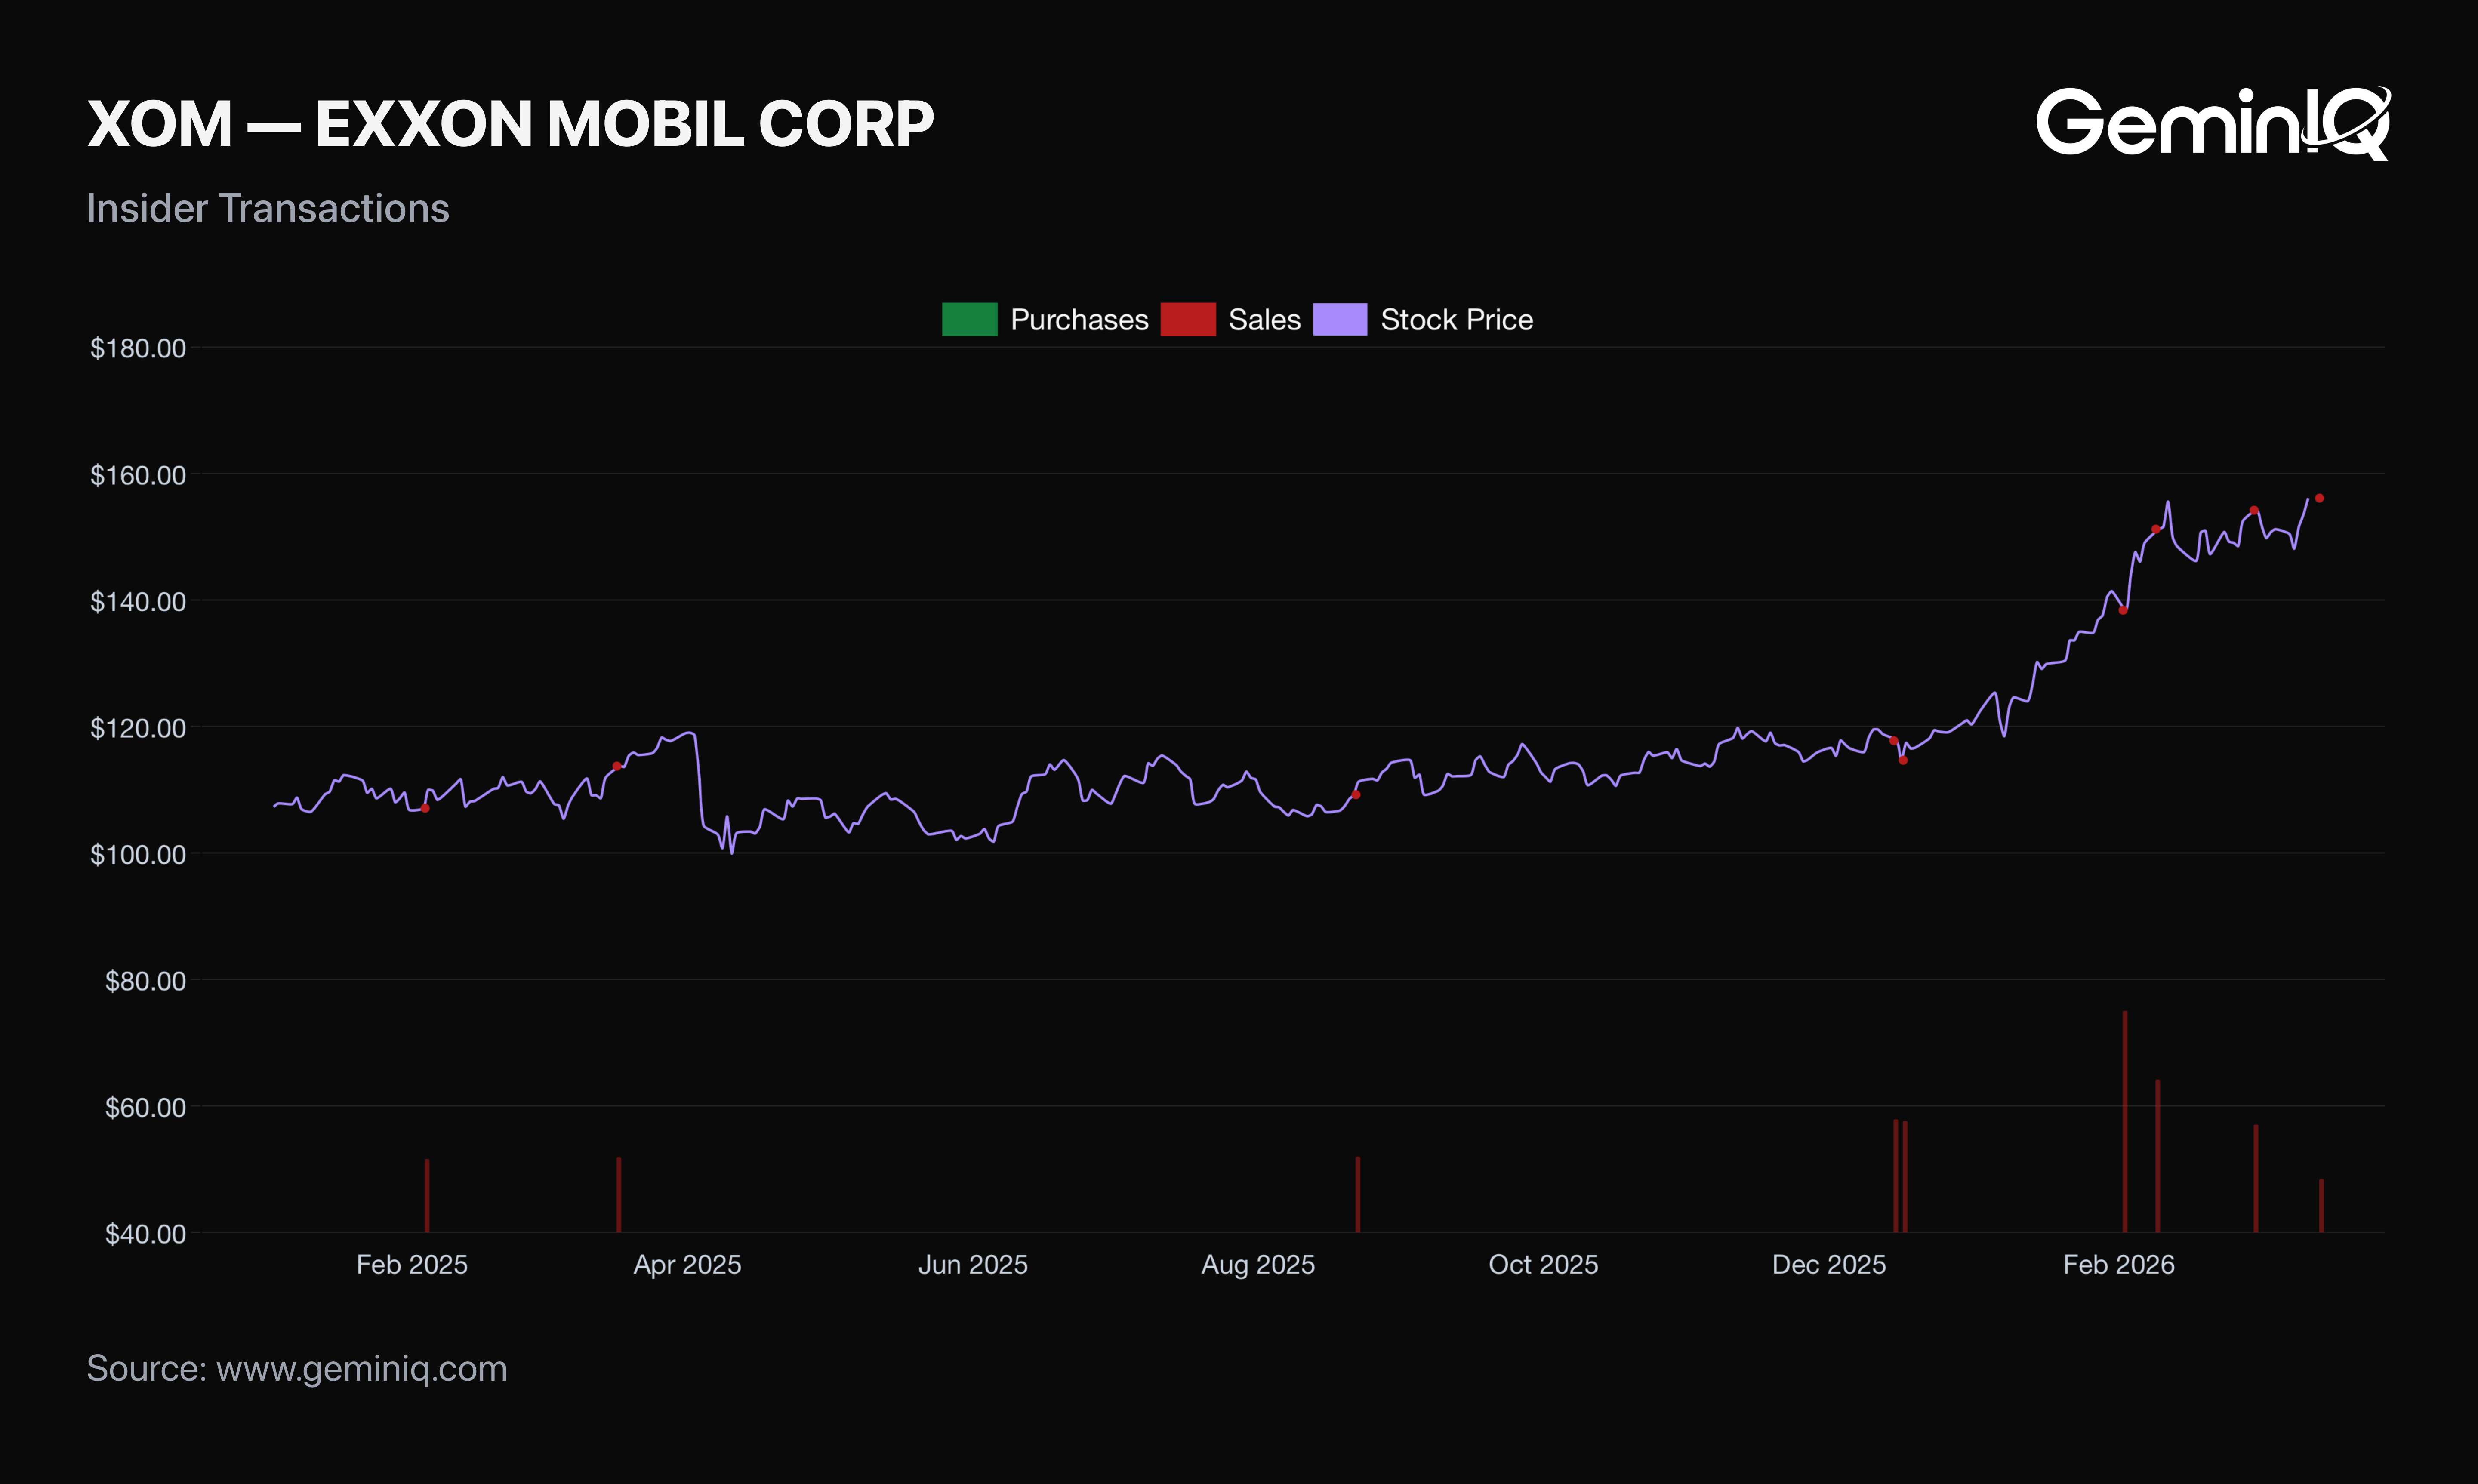
The Data: Since January 1, 2025, GeminIQ's Insider Transactions records only 9 sale filings by ExxonMobil insiders, totaling $3.10 Million, and zero purchases. The largest is 5,000 shares by the VP of Corporate Strategic Planning at $139.76 on February 2, 2026, for $698,800. The volume here is unusually low for a company of this size, which makes the record closer to uninformative than bearish.
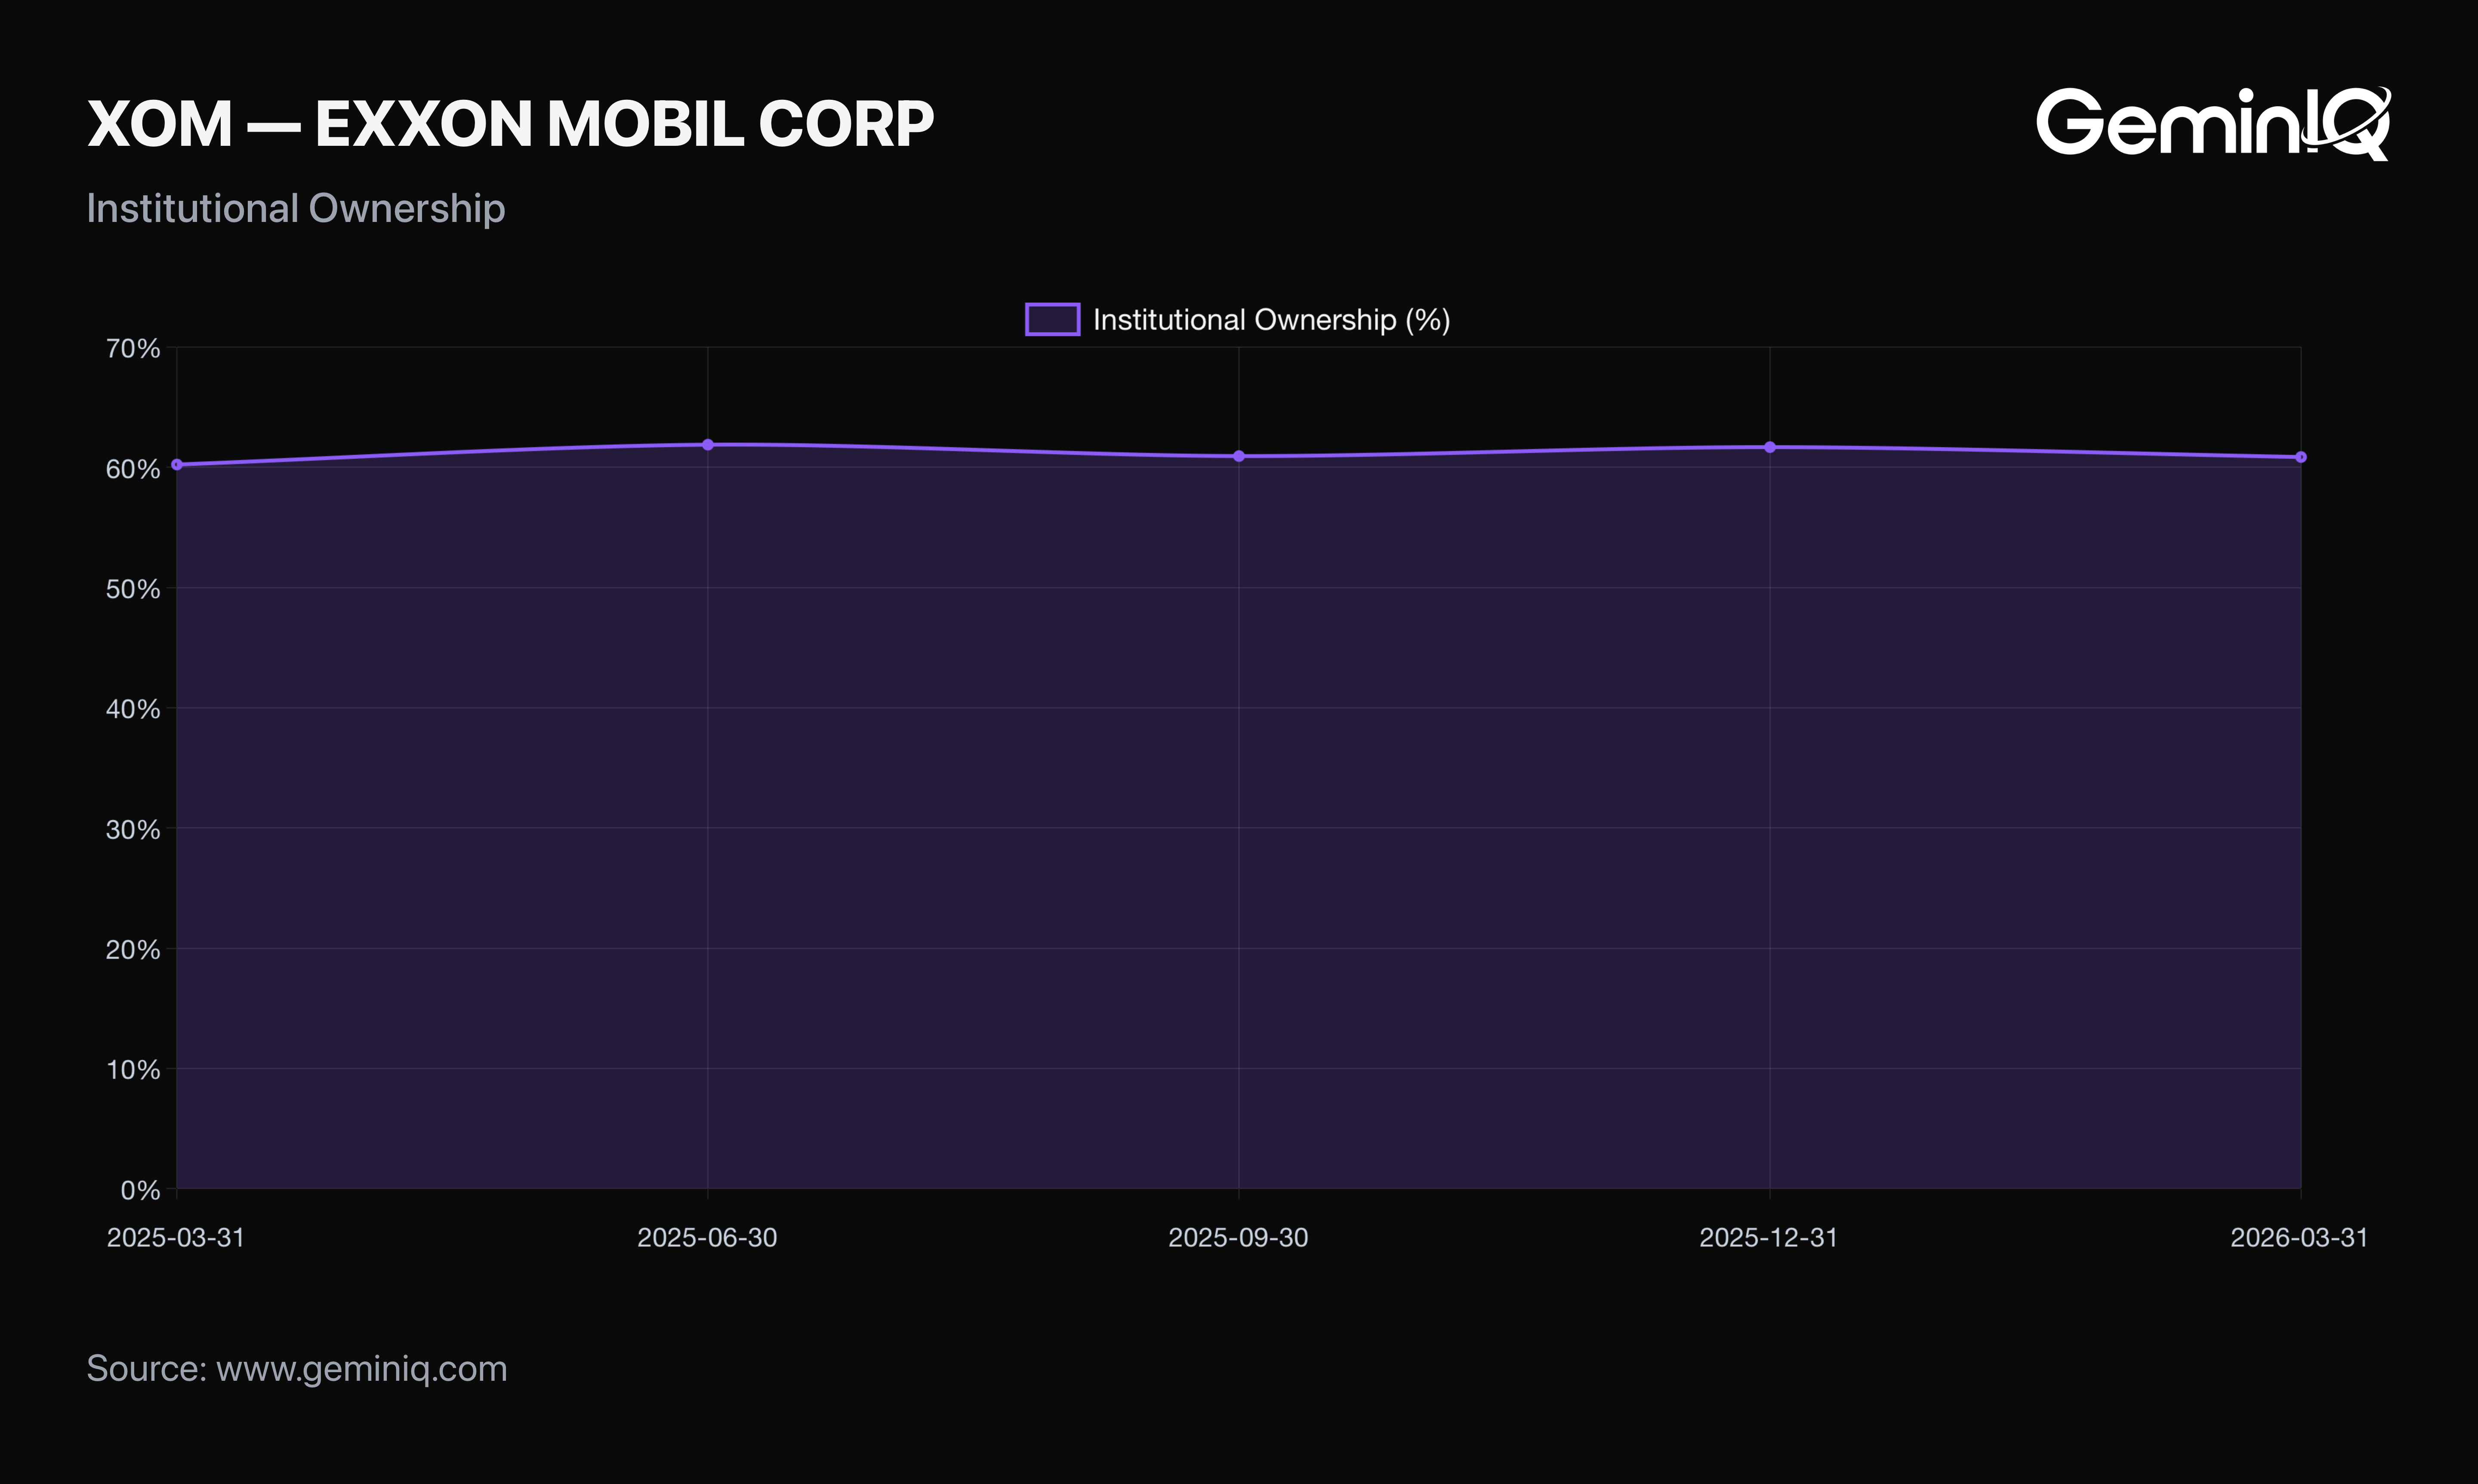
Institutional Ownership stood at 61.68% of shares outstanding as of the quarter ending December 31, 2025, easing to 60.86% as of March 31, 2026. Both come from quarterly 13F filings and describe positioning as of those quarter-ends rather than current holdings.
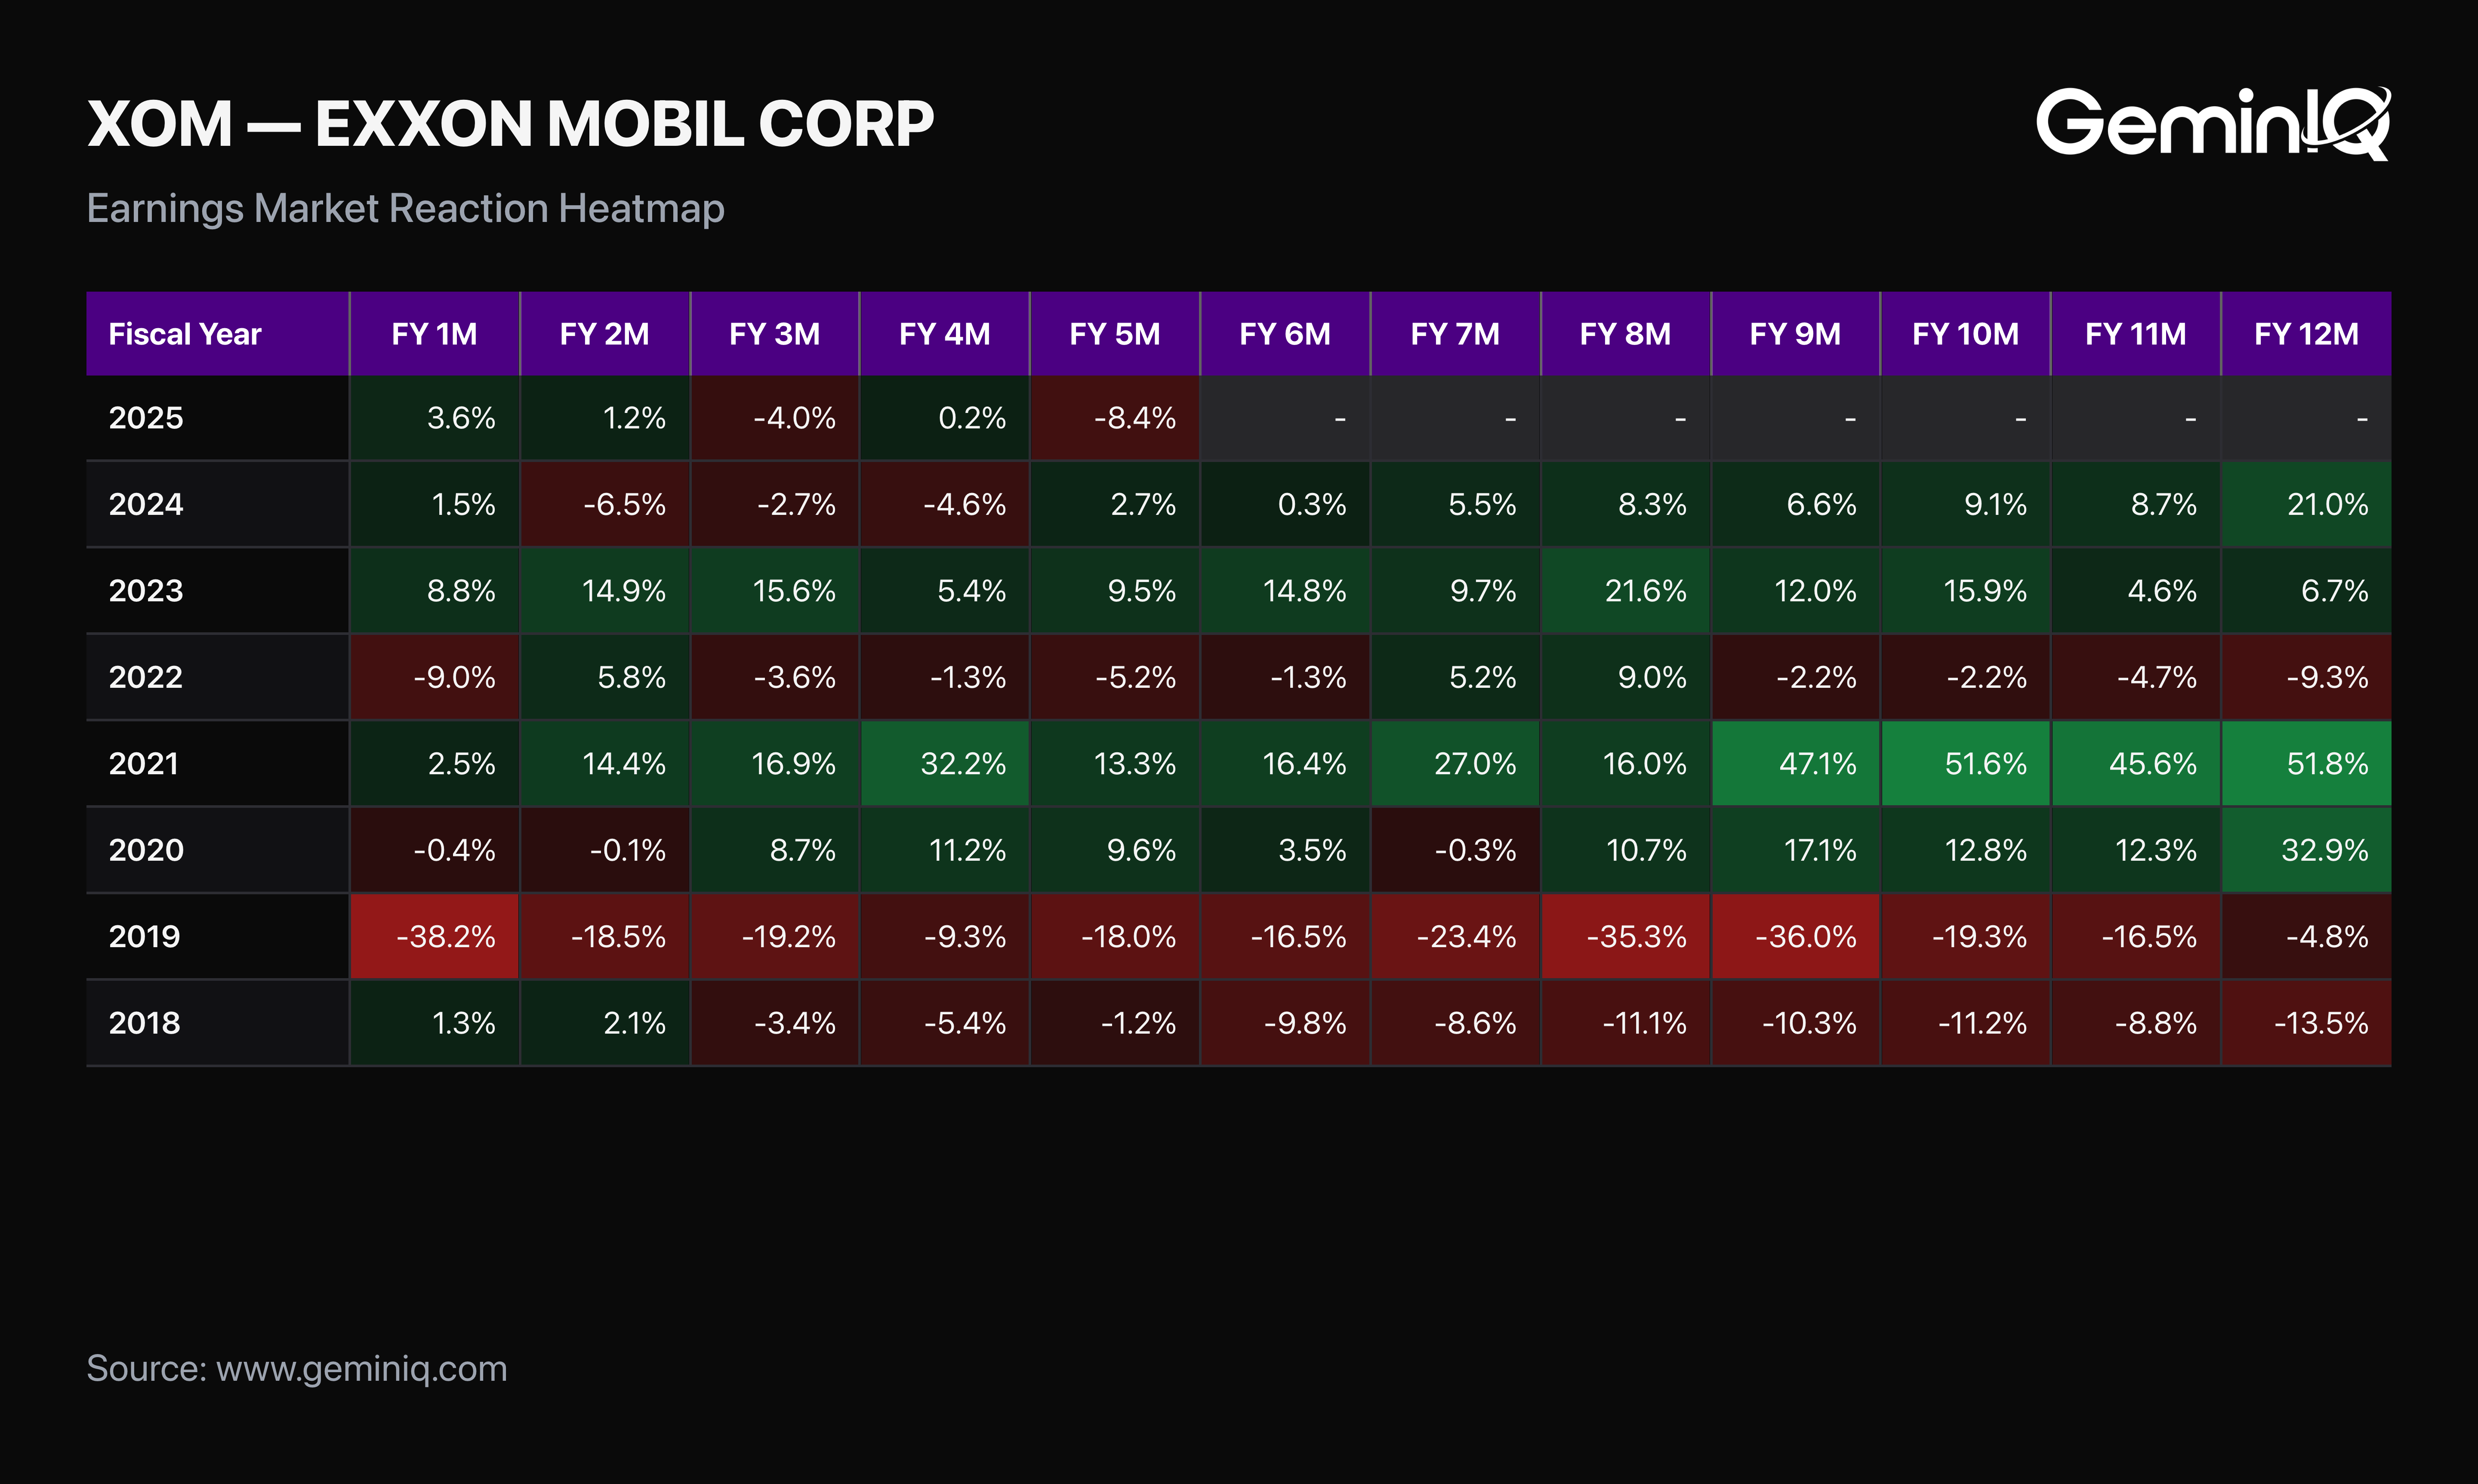
The GeminIQ Edge: Nine insider filings across eighteen months is too thin a sample to read anything into, and saying so is more useful than manufacturing a signal from it. GeminIQ's Earnings Market Reaction Heatmap carries more information here: the stock gained 3.61% one month after this 10-K was filed and 1.21% at two months, then fell 4.05% at three months and 8.40% at five. The full twelve-month window has not yet elapsed.
Frequently Asked Questions
How much have ExxonMobil's earnings fallen since 2022?
Net income fell from $55.74 Billion in FY2022 to $28.84 Billion in FY2025, a decline of 48.3% across three consecutive down years. Revenue fell 19.7% and free cash flow fell 59.6% over the same period.
Why is ExxonMobil's stock up if earnings are down?
The multiple expanded. The trailing price-to-earnings ratio went from 7.41 at the end of FY2022 to 17.72 at the end of FY2025, an increase of 139.3%, while the share price rose 21.0% from $98.16 to $118.70.
What is ExxonMobil's ROIC?
9.81% on a trailing basis as of the FY2025 10-K, down from 25.56% in FY2022. NOPAT fell 48.0% while invested capital rose 37.7%, and both halves of the ratio moved against it.
Did ExxonMobil's costs increase in FY2025?
Yes, several categories did, while revenue fell 5.0%. Production And Manufacturing Expenses rose 7.1%, Depreciation And Depletion rose 10.9%, Selling, General And Administrative Expenses rose 11.5%, and Exploration Expenses rose 21.9%.
How do I check whether a price gain came from earnings or from the multiple?
Pull net income and the trailing price-to-earnings ratio for the same fiscal year ends and compare their percentage changes across the period. Price change is roughly the earnings change compounded with the multiple change, so when earnings fall and price rises, the multiple accounts for all of it and more.
ExxonMobil's most recent annual filing is a Form 10-K filed February 18, 2026, covering the fiscal year ended December 31, 2025 (FY2025).
Wall Street's data. Main Street's price.
Institutional terminals charge thousands a year for as-filed accuracy. GeminIQ gives you the same thing for a fraction of the cost: financials built directly from raw SEC EDGAR filings, not third-party APIs, with full XBRL traceability back to the original 10-K or 10-Q. No normalized guesswork, just calculated metrics, charts, screeners, and watchlists built on numbers exactly as the company reported them. Start researching now at GeminIQ.com.
All financial figures cited in this article reference Exxon Mobil Corporation's FY2025 10-K (filed February 18, 2026, period ending December 31, 2025). All SEC filings are publicly available at SEC EDGAR.
Disclaimer: The content in this blog is for educational and entertainment purposes only and does not constitute financial, legal, or tax advice. Investing involves risk, including the loss of principal. The views expressed are my own and not intended as financial advice or a guarantee of future performance.