
Good Debt-to-EBITDA Ratio: 0.3x to 2.3x, by Sector

By Chad Hartman
Published · Last updated
PG&E Corp carries a net-debt-to-EBITDA ratio of 12.24x. American Electric Power sits at 9.41x. Neither company is in distress by the round-number rule of thumb most often repeated for this ratio — keep it under 3x. But that 3x line was never a sector-neutral rule. It was a rough average smeared across an economy where a regulated utility and a software company have nothing in common on the liabilities side of the balance sheet, and reading the as-filed data by sector shows exactly how far apart they actually sit.
This study reads GeminIQ's as-filed universe as of the most recent trailing-twelve-month filing period for 6,095 companies, restricted to a snapshot dated within the last fifteen months so the comparison reflects the current rate environment rather than a blend of cycles. After excluding financial companies — banks and insurers carry leverage as a structural feature of the business model, not a comparable risk signal — 4,100 companies remain in the net-debt-to-EBITDA distribution below. Every ratio is trailing-twelve-months EBITDA against as-filed net debt, computed directly from GeminIQ's Net Debt to EBITDA metric, with the top and bottom 1% of the distribution trimmed so a handful of near-zero-EBITDA outliers don't distort the sector medians.
The Pattern
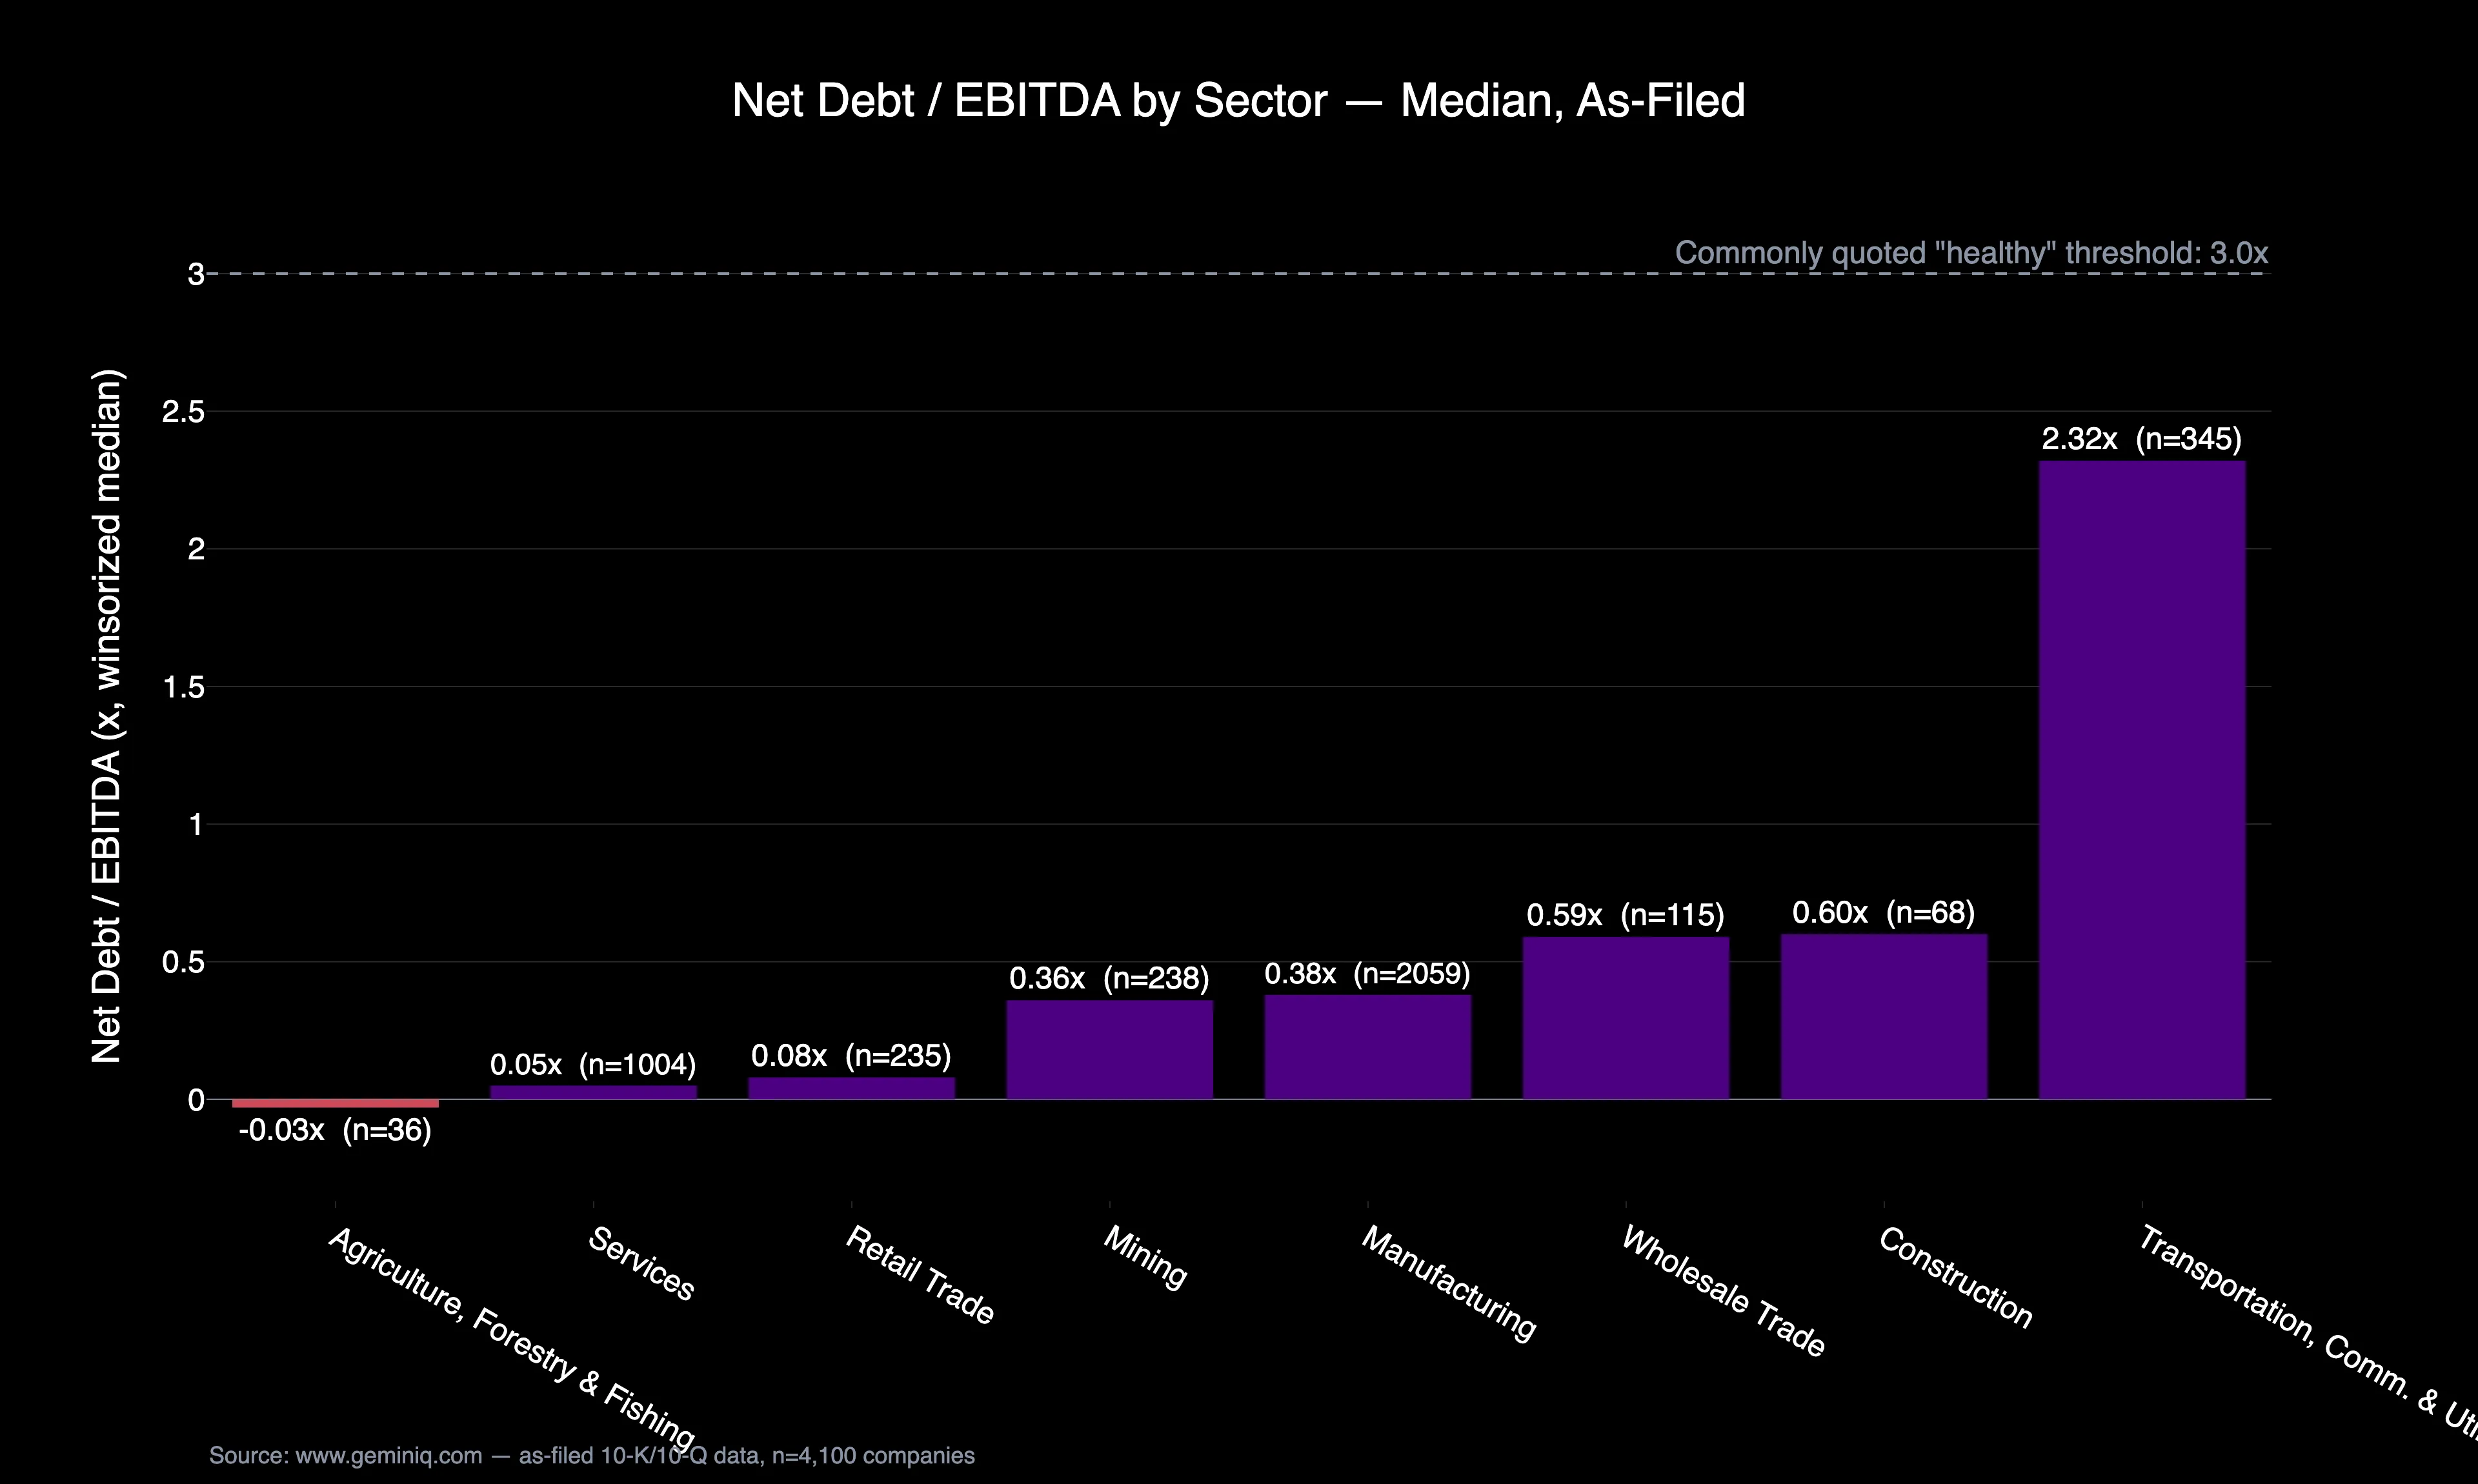
Sort the universe by sector and the round number stops looking like a rule and starts looking like an average of two very different distributions. Companies in Manufacturing, Services, Retail Trade, Mining, and Agriculture run median net leverage between roughly flat and 0.4x EBITDA — a fraction of the commonly quoted threshold. Companies in Transportation, Communications & Utilities run a median of 2.32x, nearly seven times higher than the median industrial company, and still comfortably under the 3x line that gets treated as a warning sign everywhere else. The "good" ratio was never one number. It moves with how predictable the sector's cash flow is, and the filings show that relationship plainly once the sectors are separated instead of pooled.
The Data
The table below reports the winsorized median and interquartile range of net-debt-to-EBITDA and gross debt-to-EBITDA for every sector with a usable sample, computed from GeminIQ's Debt to EBITDA and Net Debt to EBITDA metrics.
| Sector | N | Net Debt/EBITDA (median) | Net Debt/EBITDA (Q1–Q3) | Debt/EBITDA (median) |
|---|---|---|---|---|
| Transportation, Communications & Utilities | 345 | 2.32x | -0.00x to 5.00x | 2.44x |
| Construction | 68 | 0.60x | -0.36x to 3.00x | 0.89x |
| Wholesale Trade | 115 | 0.59x | -0.23x to 2.81x | 0.17x |
| Manufacturing | 2,059 | 0.38x | -0.27x to 1.77x | 0.00x |
| Mining | 238 | 0.36x | -0.32x to 1.81x | 0.00x |
| Retail Trade | 235 | 0.08x | -0.55x to 2.13x | 0.03x |
| Services | 1,004 | 0.05x | -0.85x to 2.14x | 0.00x |
| Agriculture, Forestry & Fishing | 36 | -0.03x | -1.05x to 0.93x | 0.00x |
| Universe (ex-financials) | 4,100 | 0.34x | -0.41x to 2.18x | — |
Construction, Wholesale Trade, and Agriculture carry samples under or near the 200-company floor GeminIQ applies to Filing Data Study buckets; their medians are directional, not settled benchmarks. Every other row clears it. The gap between Manufacturing's median of 0.38x and Utilities' 2.32x is not noise — it holds up across the interquartile range too, where the utility sector's 25th percentile alone sits above the median for every other sector shown. This is a historical distribution measured across the current filing snapshot, not a forecast of where any individual company's leverage is headed.
The Extremes
PG&E Corp is the sharpest illustration of why utilities anchor the high end of the range. The company's 12.24x net-debt-to-EBITDA ratio traces back to the wildfire liabilities and infrastructure financing that followed its 2019 bankruptcy, and the filings show a business still carrying that debt load years later. That is not because the underlying utility is failing — it is because regulated, rate-based revenue lets a company service far more debt per dollar of EBITDA than a cyclical industrial ever could. American Electric Power, at 9.41x, sits in the same structural category without the bankruptcy backstory: a regulated utility running leverage that would be alarming on a manufacturer's balance sheet and unremarkable on its own.
At the other pole, GameStop Corp. and Airbnb, Inc. run net-debt-to-EBITDA ratios of -8.40x and -6.05x — both sitting on net cash positions larger than a full year of EBITDA, the mirror image of the utility case. Neither is a distressed low-margin business; both simply generate enough EBITDA relative to their balance sheets that gross debt has been swamped by cash. The generic "3x is healthy" framing has no room for either end of this range, because it was built as a blended average, not a sector-specific bound.
The Method
Every figure above is trailing-twelve-months EBITDA and as-filed net debt read directly from GeminIQ's Debt to EBITDA and Net Debt to EBITDA metric layer, computed per company as of its most recent filing period within the last fifteen months. Sectors are grouped by SIC division rather than a proprietary taxonomy, so the split is traceable back to each company's own filed SIC code rather than a third-party classification. The top and bottom 1% of each sector's distribution is trimmed before the median and quartiles are computed, so a single near-zero-EBITDA filer cannot swing an entire sector's benchmark. Full methodology is covered in How GeminIQ Builds Filing Data Studies.
Check Your Holdings
Pull up any position on GeminIQ's Stock Screener and look at its Net Debt to EBITDA figure next to its SIC sector, then compare that number to its own row in the table above — not to the generic 3x rule. A manufacturer running 2x is carrying meaningfully more leverage than its peer median; a regulated utility running 2x is running lean. Rebuild that sector-relative comparison for any holding directly from GeminIQ's filed data, and the generic 3x benchmark stops being the standard that matters.
Frequently Asked Questions
What is a good debt-to-EBITDA ratio?
There is no single good ratio — it depends heavily on sector. In GeminIQ's data, the ex-financial universe median net-debt-to-EBITDA sits at 0.34x, but capital-intensive, regulated sectors like Transportation, Communications & Utilities run a structurally higher median of 2.32x without that signaling distress.
Why do utilities carry so much more debt than other sectors?
Regulated, rate-based revenue gives utilities predictable, contracted cash flow, which lets them service far more debt per dollar of EBITDA than a cyclical industrial or retail business could safely carry.
Is the "3x debt-to-EBITDA" rule accurate?
Not as a universal threshold. It functions as a blended average across very different sectors. In GeminIQ's data, most non-financial sectors run well under 1x at the median, while Transportation, Communications & Utilities alone averages 2.32x — both far from a single "3x is healthy" line.
How many companies does this study cover?
4,100 non-financial companies in GeminIQ's current filing snapshot, after excluding banks and insurers and trimming the top and bottom 1% of each sector's distribution.
Wall Street's data. Main Street's price.
Institutional terminals charge thousands a year for as-filed accuracy. GeminIQ gives you the same thing for a fraction of the cost: financials built directly from raw SEC EDGAR filings, not third-party APIs, with full XBRL traceability back to the original 10-K or 10-Q. No normalized guesswork, just calculated metrics, charts, screeners, and watchlists built on numbers exactly as the company reported them. Start researching now at GeminIQ.com.
All figures are drawn from each company's as-filed 10-K and 10-Q filings, publicly available on SEC EDGAR. Sector medians and quartiles are computed from GeminIQ's Net Debt to EBITDA and Debt to EBITDA metric layer across the described universe and snapshot window.
Disclaimer: The content in this blog is for educational and entertainment purposes only and does not constitute financial, legal, or tax advice. Investing involves risk, including the loss of principal. The views expressed are my own and not intended as financial advice or a guarantee of future performance.