
How to Calculate Financial Ratios From a 10-K: Step-by-Step

By Chad Hartman
Published · Last updated
Type "how to calculate financial ratios" into a search engine and most of what comes back is a formula sheet: Current Ratio equals this divided by that, Debt-to-Equity equals this over that. What almost none of those guides show is where those inputs actually live inside a real filing — which line, under which header, reported under which XBRL tag — and that gap is exactly where most self-taught investors get the math wrong. This guide closes it. Using Apple's most recently filed 10-K — FY2025 (filed October 31, 2025, fiscal year ending September 27, 2025) — we will build four ratios directly from the as-filed balance sheet, income statement, and cash flow statement: one liquidity ratio, one leverage ratio, one profitability ratio, and one valuation ratio. Every input traces to a specific filing line. Every formula is built by hand before it gets checked against the platform number.
Table of Contents
- Step 1: Find the Filing and the Exact Line Item
- Step 2: Calculate a Liquidity Ratio — The Current Ratio
- Step 3: Calculate a Leverage Ratio — The Debt-to-Equity Ratio
- Step 4: Calculate a Profitability Ratio — Gross Profit Margin
- Step 5: Calculate a Valuation Ratio — Free Cash Flow Yield
- Step 6: Reconcile Your Number Against the Platform
- Where This Process Breaks Down at Scale
- Frequently Asked Questions
Step 1: Find the Filing and the Exact Line Item
Before any formula gets touched, two decisions determine whether the resulting ratio is accurate or quietly wrong: which filing, and which line within it. A 10-K is the annual report — audited, comprehensive, filed once a year. A 10-Q is the quarterly update — unaudited, narrower in scope, filed three times a year between annual reports. The line items and the math are the same in both; what changes is the reporting period and the level of detail surrounding it. For a full breakdown of what each filing includes, see 10-K vs. 10-Q: What's the Difference?
The reason "which line" matters as much as "which filing" is that companies do not all label the same concept the same way — one company's "Term Debt" is another's "Long-Term Debt, Current Portion." The only way to know you have the right number is to match it to its XBRL tag, the machine-readable identifier every public company attaches to every reported figure under SEC rules. For a primer on how this tagging system works, see What Is XBRL? The on-screen label can shift between filings; the tag does not.
For this walkthrough, every figure comes from Apple's FY2025 10-K, pulled directly from GeminIQ's Financial Statements view rather than a normalized summary. The balance sheet figures below reflect the fiscal year ending September 27, 2025.
Step 2: Calculate a Liquidity Ratio — The Current Ratio
What Is the Current Ratio?
The Current Ratio answers a narrow question: for every dollar a company owes in the next twelve months, how many dollars of short-term assets does it have on hand to cover it? It is the most commonly cited liquidity ratio because it requires only two inputs, both of which sit near the top of every balance sheet.
Current Ratio = Current Assets / Current Liabilities
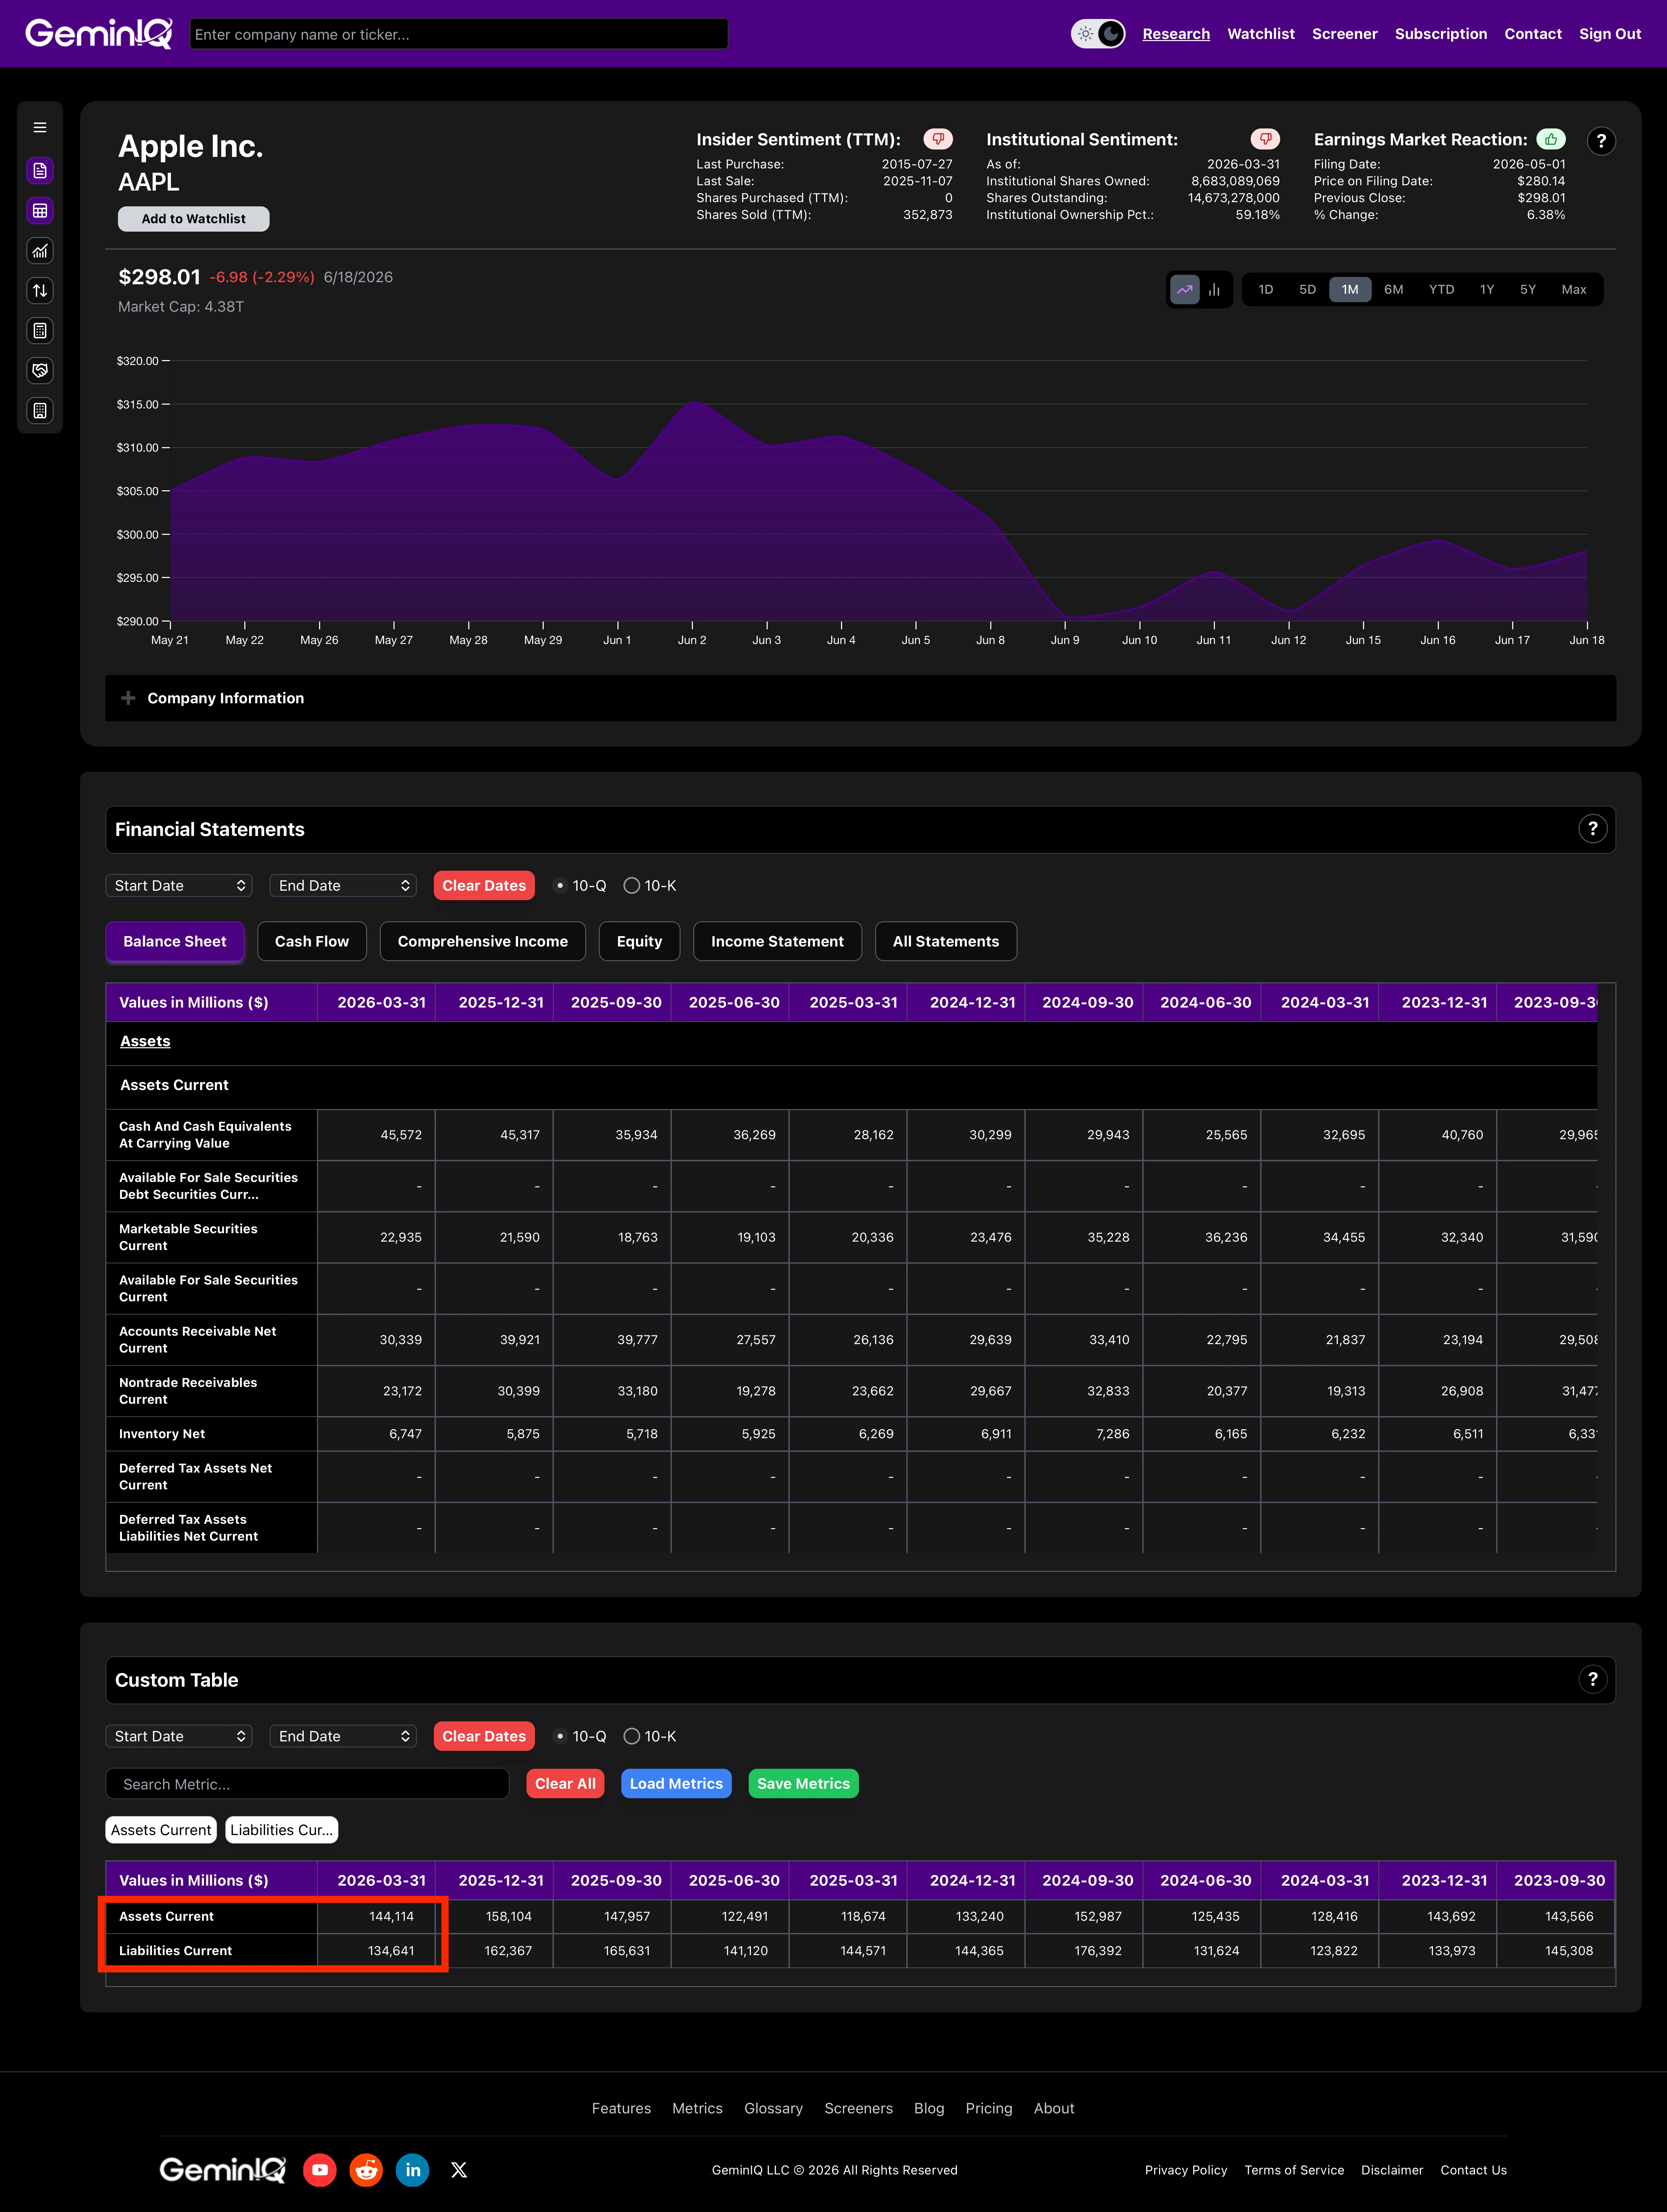
The Data: On Apple's FY2025 balance sheet, Total Current Assets ("Total Current Assets," XBRL tag Assets Current) total $147.96 Billion, and Total Current Liabilities ("Total Current Liabilities," XBRL tag Liabilities Current) total $165.63 Billion. Divide one by the other:
$147.96 Billion / $165.63 Billion = 0.89
A current ratio of 0.89 means Apple holds $0.89 in current assets for every $1.00 of current liabilities due within the year — below the 1.0 line that a textbook would flag as a liquidity concern. For most companies that reading would matter. For Apple it is a feature of the model, explained in "When it breaks" below.
When it breaks: The current ratio treats every current liability as an equally urgent cash obligation, which is not always true. Apple is the clearest possible illustration: its 0.89 ratio sits below 1.0 not because it is short of cash, but because it collects from customers and holds vendor payables in ways that keep current liabilities high without threatening liquidity. A subscription or hardware-and-services business with large deferred revenue on the balance sheet can show a current ratio that looks weaker than its actual liquidity, because deferred revenue represents cash the company has already collected — not cash it still owes. The ratio is also not comparable across industries without context. A grocery chain operating with a current ratio below 1.0 is often showing operating efficiency, not distress — it collects cash from customers before it has to pay suppliers.
Step 3: Calculate a Leverage Ratio — The Debt-to-Equity Ratio
What Is the Debt-to-Equity Ratio?
The Debt-to-Equity Ratio measures how much of a company's asset base is financed by liabilities versus by shareholders' own capital. A ratio above 1.0 means liabilities exceed equity; below 1.0, equity exceeds liabilities.
Debt-to-Equity Ratio = Total Liabilities / Total Shareholders' Equity
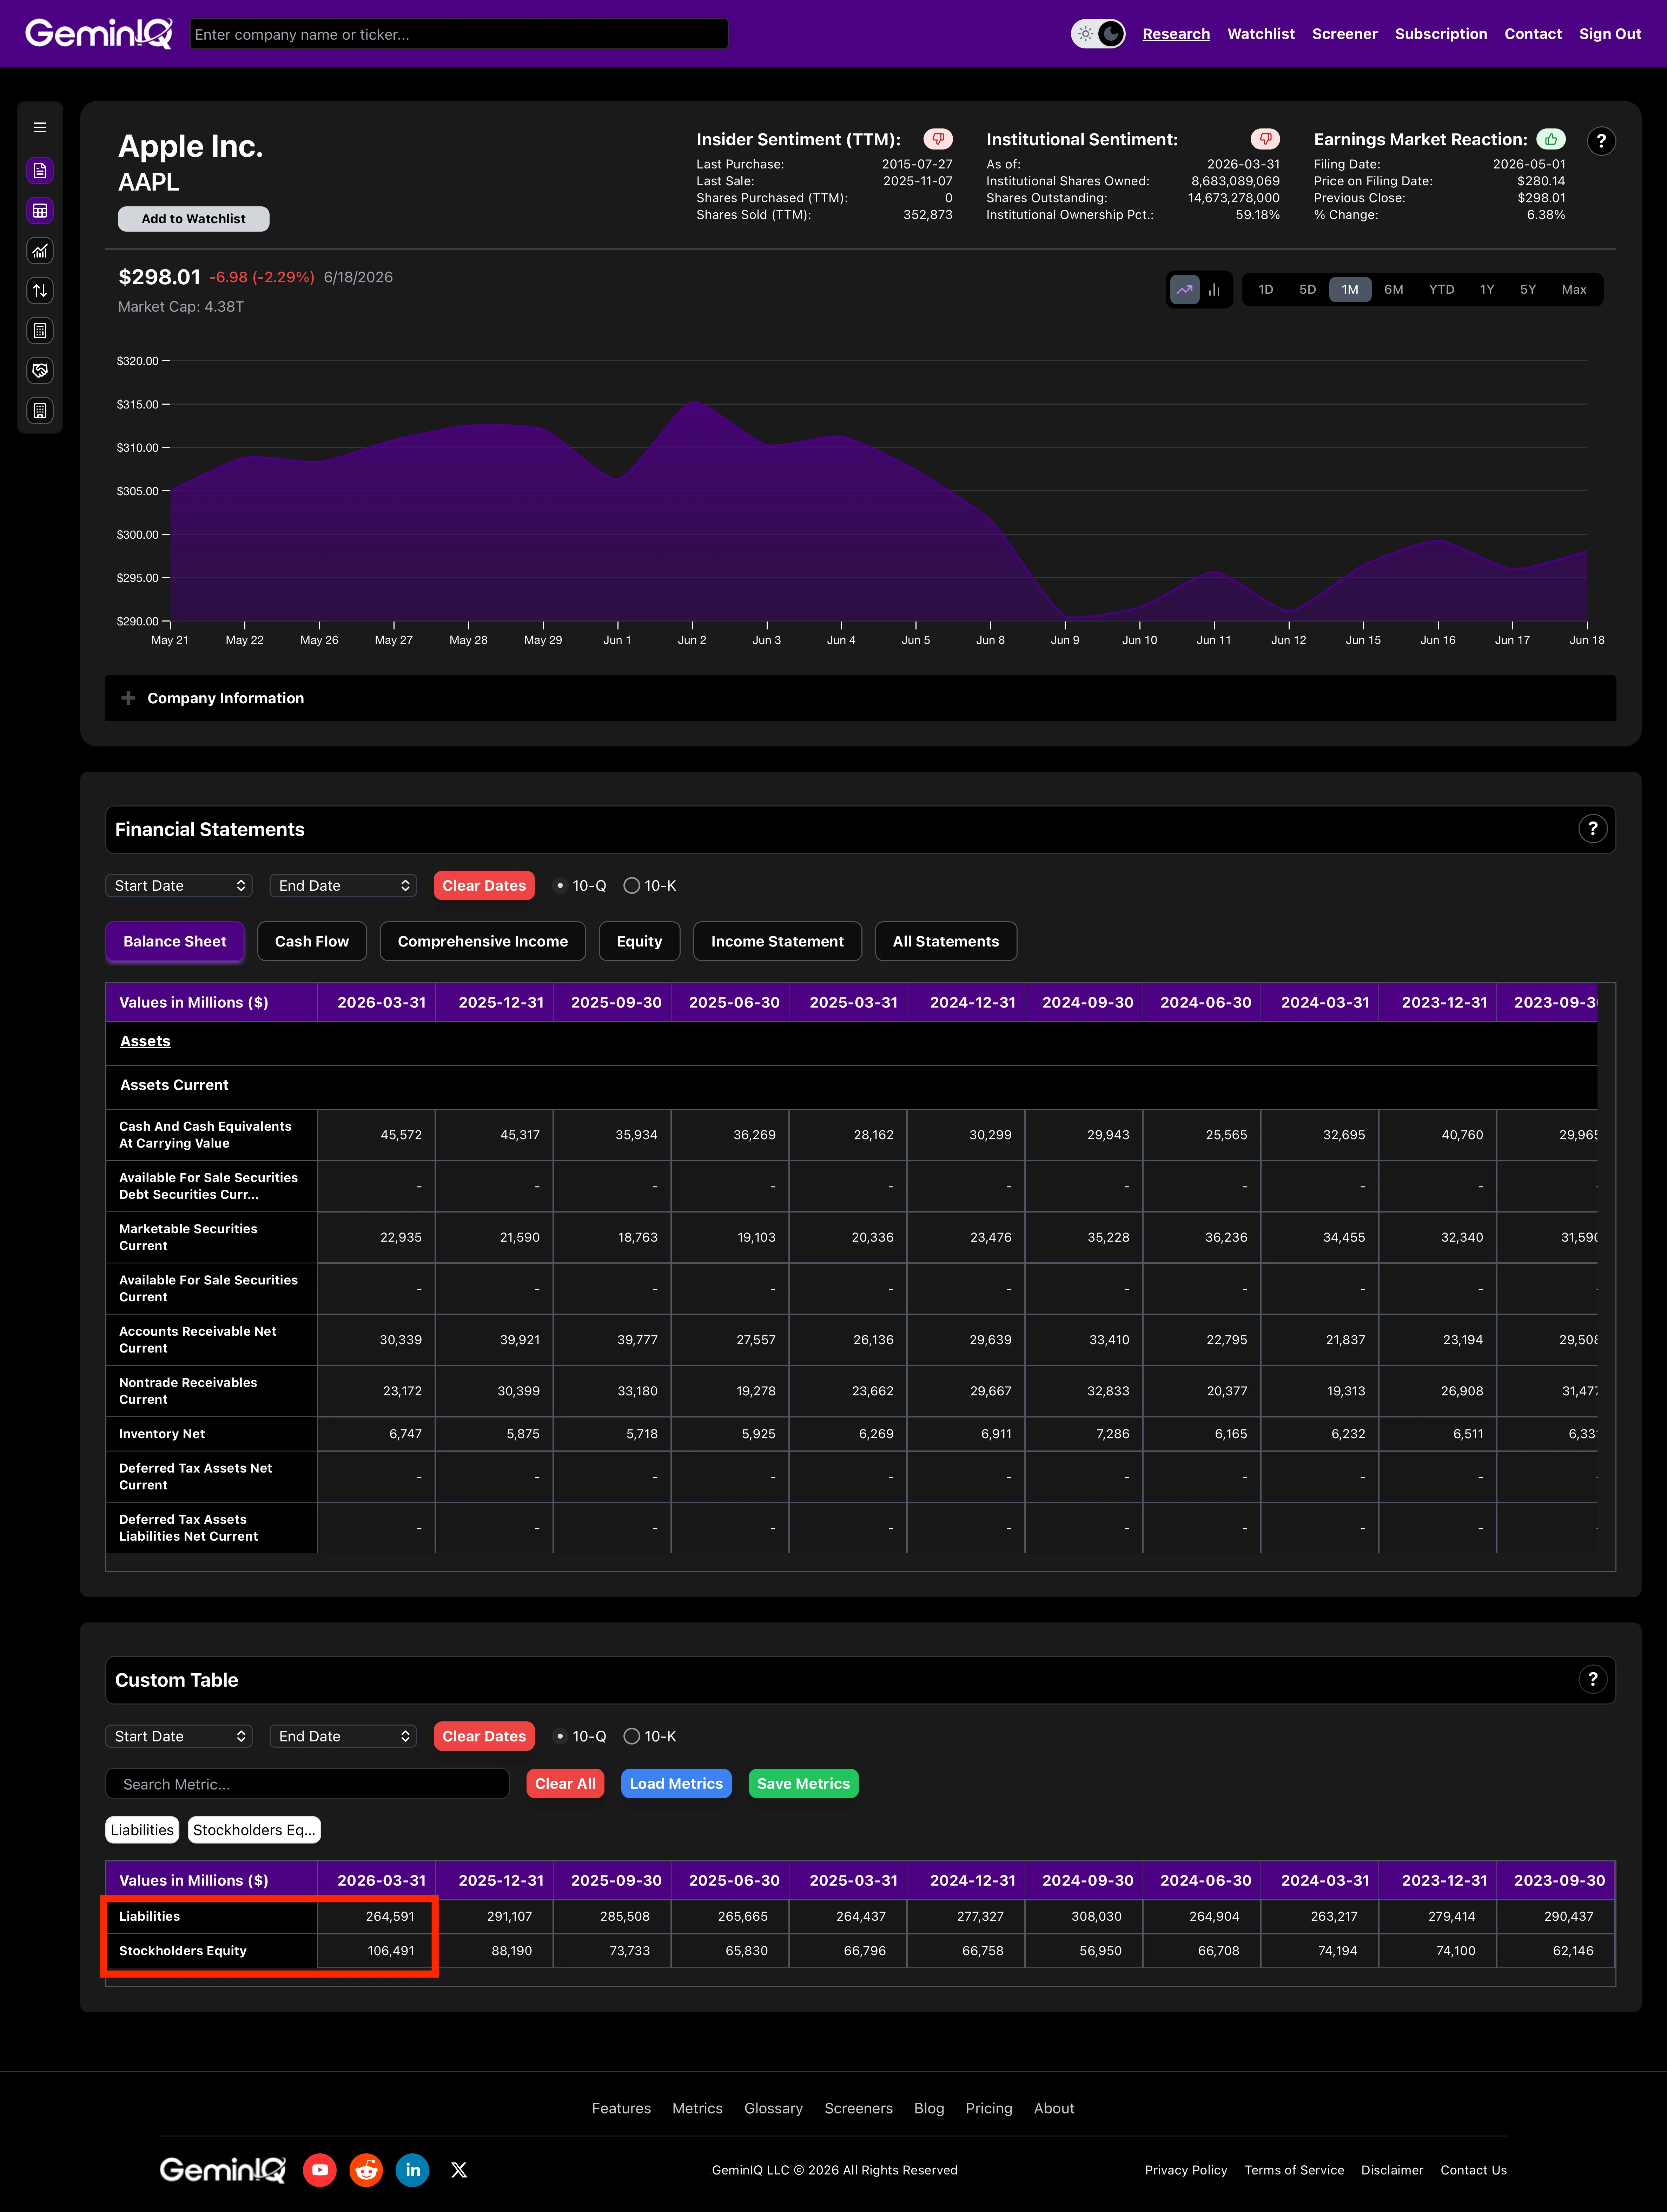
The Data: Apple's balance sheet reports Total Liabilities ("Total Liabilities," XBRL tag Liabilities) of $285.51 Billion and Total Shareholders Equity ("Total Shareholders Equity," XBRL tag Stockholders Equity) of $73.73 Billion.
$285.51 Billion / $73.73 Billion = 3.87
Apple's debt-to-equity ratio of 3.87 means total liabilities run nearly four times shareholders' equity.
When it breaks: Debt-to-equity lumps every liability together, but most line items inside Total Liabilities have nothing to do with financial leverage in the way the ratio's name implies. Of Apple's $285.51 Billion in Total Liabilities, only about $98.66 Billion — Commercial Paper (Commercial Paper: $7.98 Billion) plus Term Debt, current and non-current (Long Term Debt Current and Long Term Debt Noncurrent: $12.35 Billion and $78.33 Billion) — is actual interest-bearing debt. The remaining roughly $186.85 Billion is operating liabilities: Accounts Payable (Accounts Payable Current: $69.86 Billion), Deferred Revenue (Contract With Customer Liability Current: $9.06 Billion), and other current and non-current obligations that carry no interest rate at all. A standard screener flags a high debt-to-equity ratio as financial risk, but pulling the raw balance sheet shows a company can carry a high ratio almost entirely through operating liabilities rather than borrowed money. The ratio is also undefined for companies with negative equity — a position several large, profitable companies have reached through aggressive buyback programs — at which point it loses its interpretive value entirely.
Step 4: Calculate a Profitability Ratio — Gross Profit Margin
What Is Gross Profit Margin?
Gross Profit Margin measures what share of revenue survives after the direct cost of producing the goods or services sold. GeminIQ's Gross Profit Margin is a trailing-twelve-month calculated metric. In a 10-K, where the income statement already covers a full fiscal year, the annual figure and the trailing-twelve-month figure converge — one of the practical advantages of building this ratio from an annual filing rather than a single quarter.
Gross Profit Margin = Gross Profit / Revenue
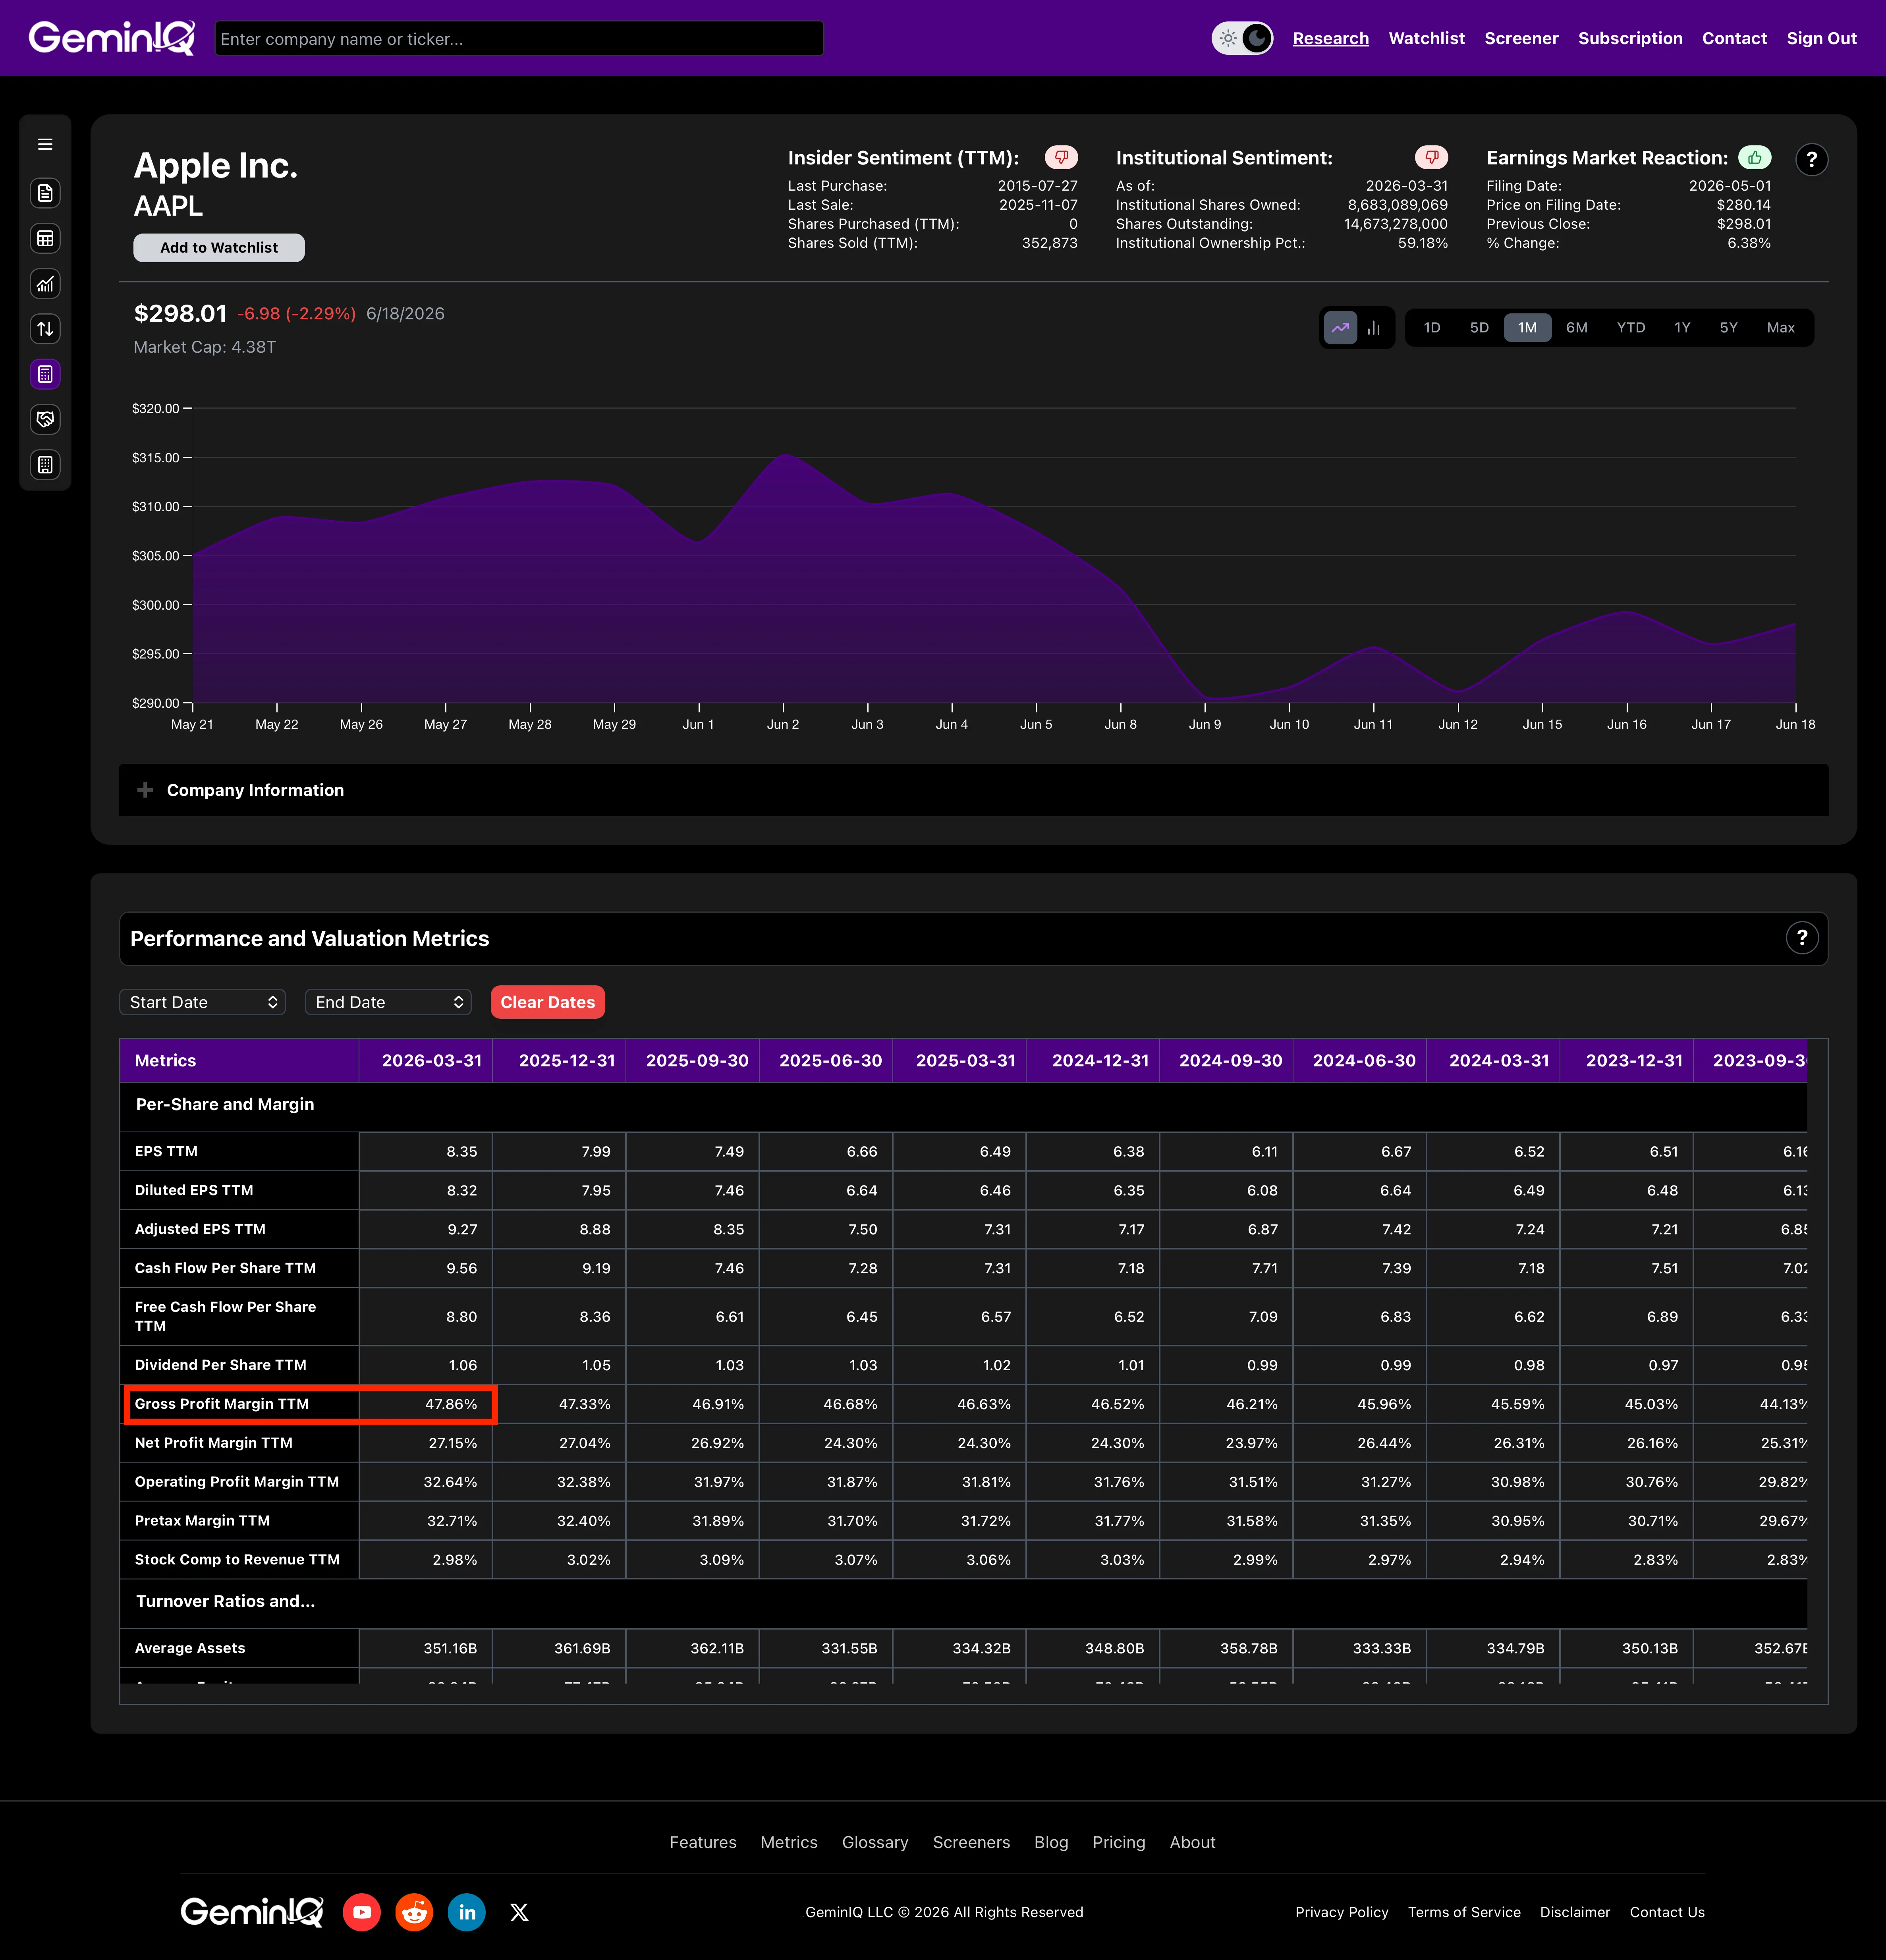
The Data: Apple's FY2025 income statement reports a "Gross Margin" line (XBRL tag Gross Profit) of $195.20 Billion against Total Revenues (Revenues) of $416.16 Billion. Because this is an annual filing, these are already full-year figures — no trailing-four-quarter summation is required. Divide the two:
$195.20 Billion / $416.16 Billion = 46.91%
The 46.91% figure reflects a complete operating cycle by construction. This is the specific reason a 10-K is the cleaner starting point for a margin calculation than a 10-Q: a single quarter can be distorted by whatever seasonal mix happened to land in a thirteen-week window, and the annual figure removes that distortion without any manual aggregation.
When it breaks: Gross margin comparisons break down across companies that classify costs differently. Some fold depreciation and amortization into Cost of Goods Sold; others report it separately below the gross profit line. Two businesses with identical underlying economics can show different gross margins purely because of where a non-cash charge gets classified — a distinction the ratio itself never reveals.
For a deeper look at what gross margin reveals about business model strength across industries, see Gross Profit Margin: What It Reveals About Business Model Strength.
Step 5: Calculate a Valuation Ratio — Free Cash Flow Yield
What Is Free Cash Flow Yield?
Free Cash Flow Yield expresses a company's free cash flow as a percentage of its market capitalization — effectively, how much cash the business generates for every dollar of its current price tag. It requires building one calculated metric, Free Cash Flow, before dividing it by Market Capitalization.
Free Cash Flow = Operating Cash Flow − Capital Expenditures Free Cash Flow Yield = Free Cash Flow / Market Capitalization
The Data: Apple's cash flow statement reports Cash Generated By Operating Activities (XBRL tag Net Cash Provided By Used In Operating Activities) and Payments For Acquisition Of Property, Plant And Equipment (XBRL tag Payments To Acquire Property Plant And Equipment). For FY2025 these are full-year figures: Operating Cash Flow totals $111.48 Billion and Capital Expenditures totals $12.72 Billion:
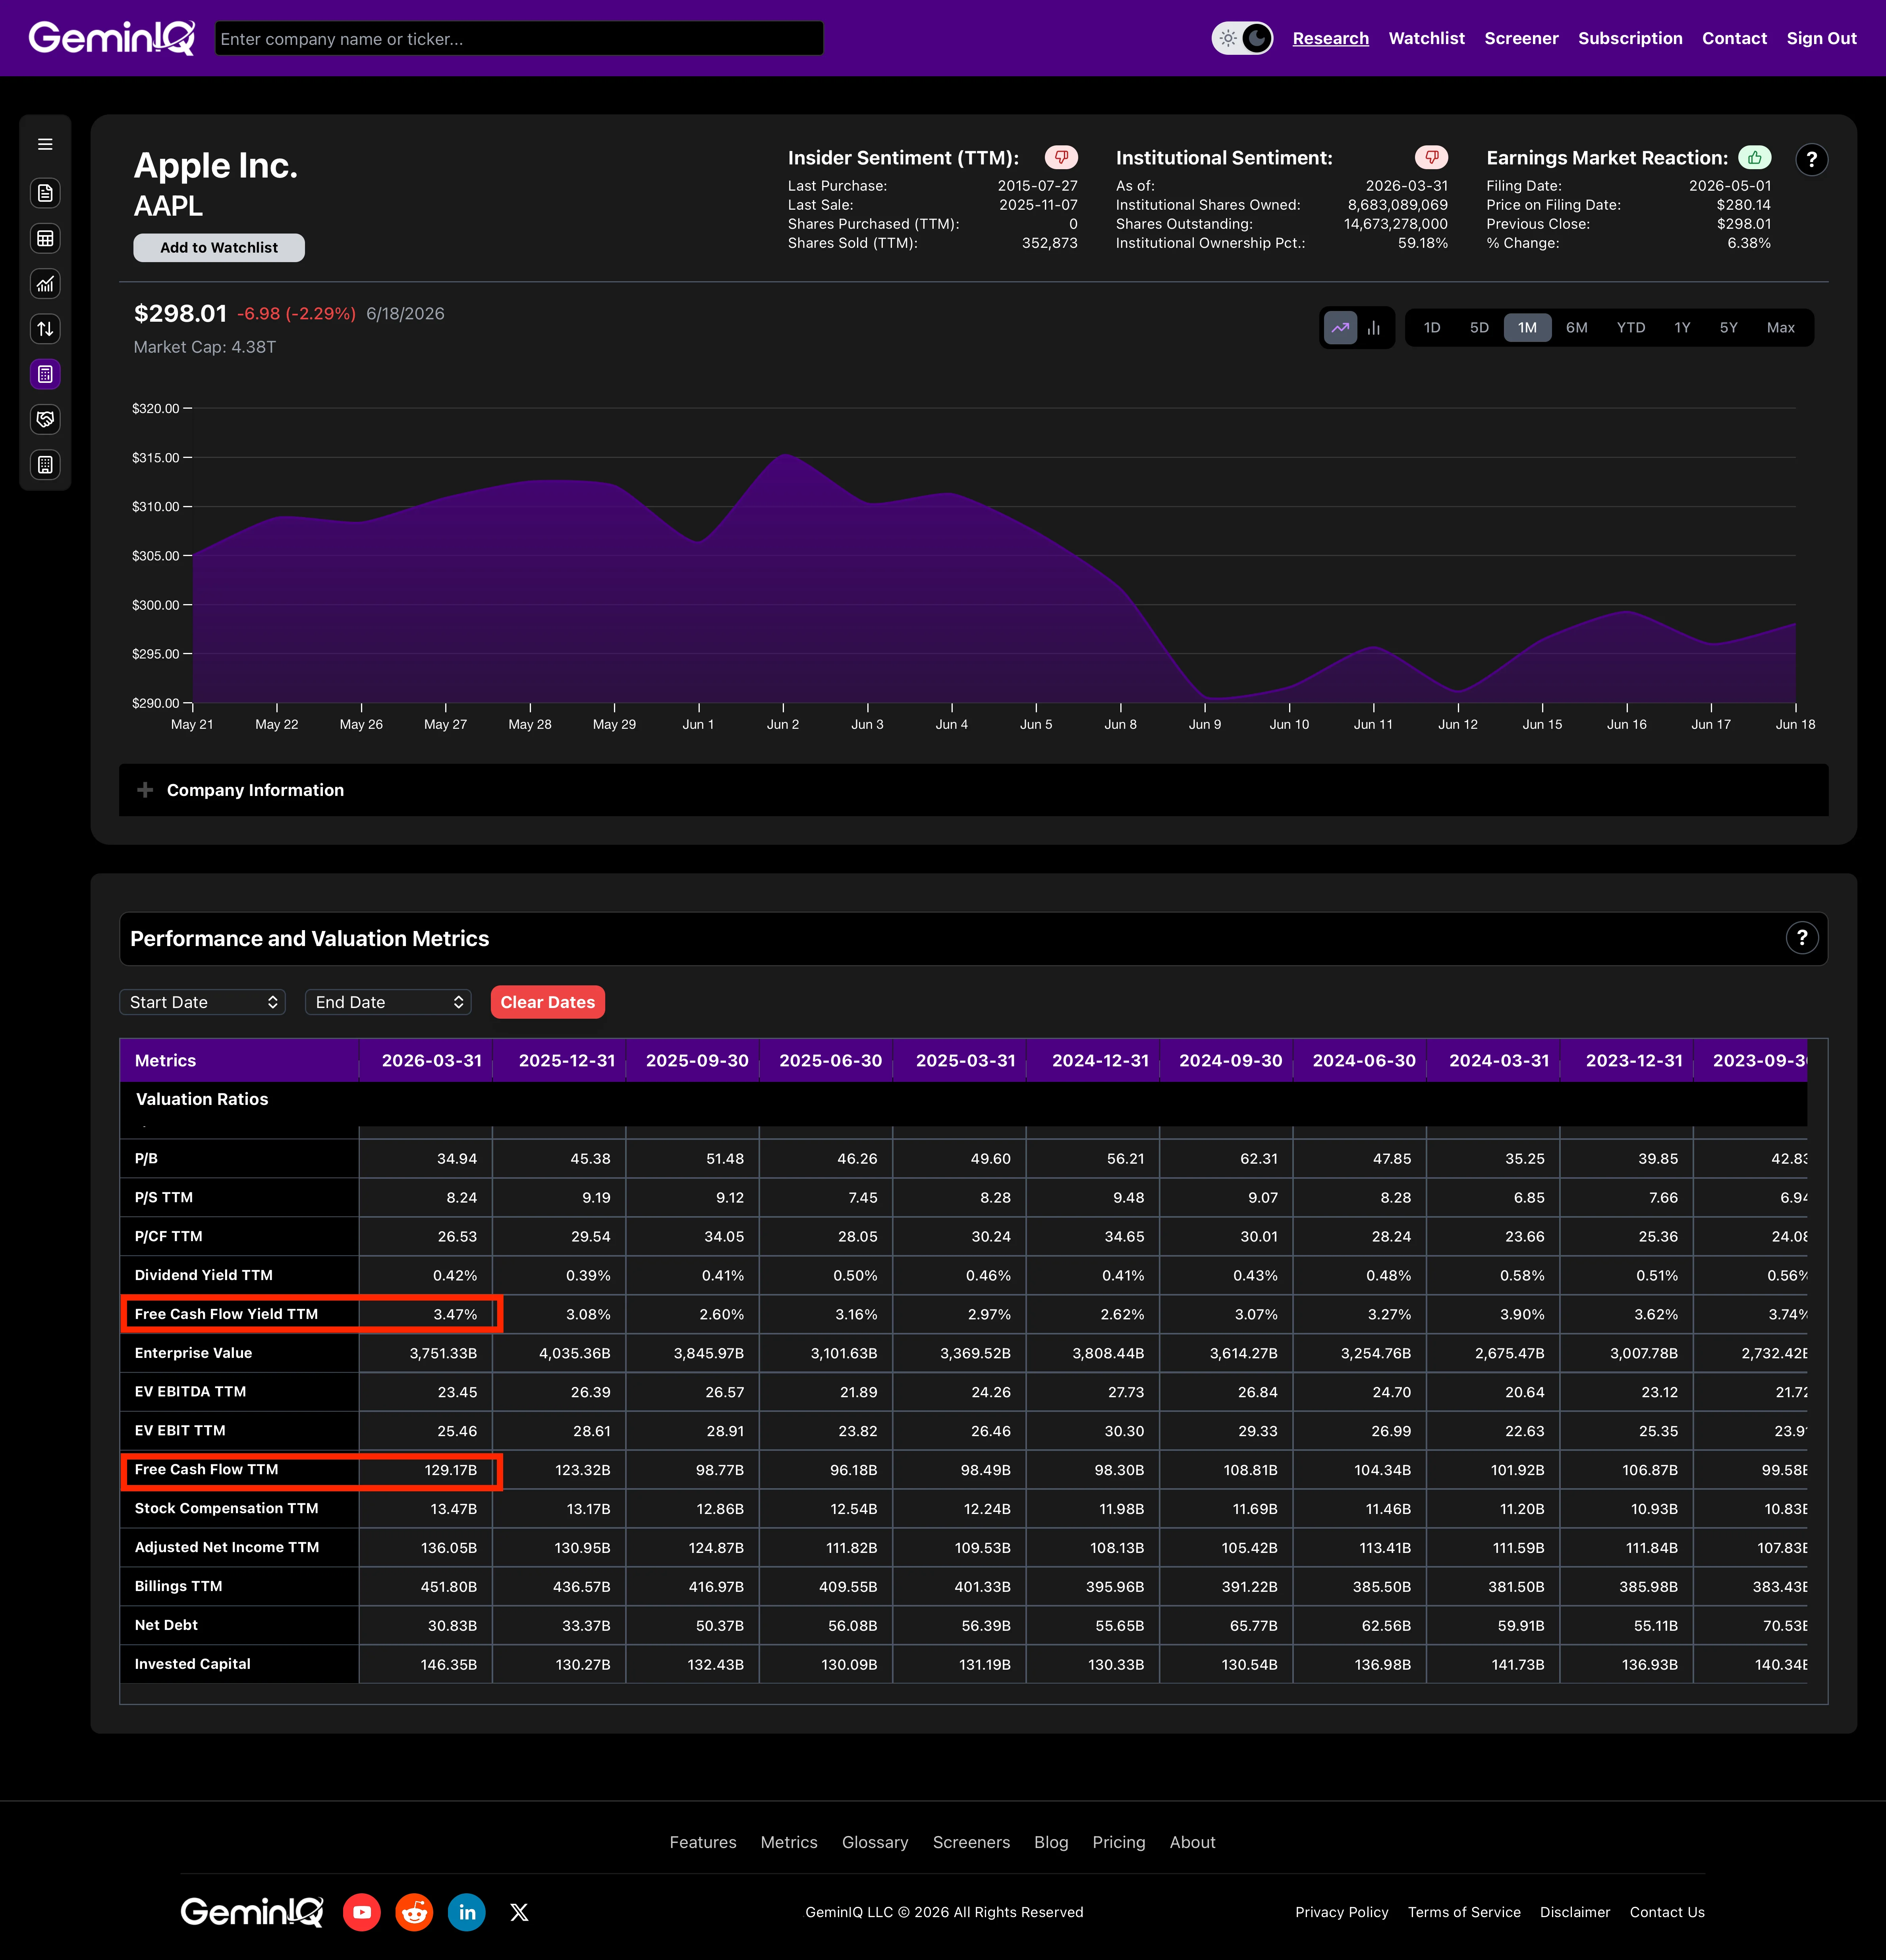
$111.48 Billion − $12.72 Billion = $98.77 Billion in Free Cash Flow
With Apple's Market Capitalization at $3.80 Trillion, dividing free cash flow by market cap gives:
$98.77 Billion / $3.80 Trillion = 2.60%
A Free Cash Flow Yield of 2.60% means Apple generates roughly 2.6 cents of free cash for every dollar of its current market value.
When it breaks: Market capitalization moves every trading day; the cash flow data behind it updates only once a quarter. A stock that has rallied sharply since its last filing will show an artificially compressed FCF yield against a current price, even though nothing about its underlying cash generation has changed — the denominator moved, not the business. The ratio can also penalize capital-intensive growth companies unfairly, since it makes no distinction between maintenance capex (spending required just to sustain the business) and growth capex (discretionary spending to expand it).
Step 6: Reconcile Your Number Against the Platform
The discipline that separates a reliable by-hand calculation from a guess is checking it against a second source before trusting it. Every figure built above — Current Ratio 0.89, Debt-to-Equity 3.87, Gross Profit Margin 46.91%, Free Cash Flow Yield 2.60% — matches exactly what appears in GeminIQ's Calculated Metrics view for Apple, because both the manual math and the platform figure trace back to the same as-filed line items.
That reconciliation is not guaranteed on every platform. Two financial websites showing different debt-to-equity or FCF yield figures for the same company in the same period are not necessarily making an error — they may simply be using different definitions of "total debt" or "capex" without labeling the difference. For a deeper walkthrough of how to spot-check a platform's figures line by line, see How to Verify Financial Data Against an SEC Filing — and for a closer look at where those definitional gaps come from in the first place, see Third-Party Financial Data: What Gets Lost When the Data Is Processed.
Where This Process Breaks Down at Scale
Building four ratios for one company by hand, as above, takes maybe twenty minutes once the filing is open. Building the same four ratios for fifty companies — correctly, with correctly matched current vs. non-current debt, correctly separated operating and interest-bearing liabilities — does not scale linearly. It scales into hours of manual line-item hunting, and every hour adds another opportunity for a misread label or a wrong tag to slip into the math.
This is the specific problem GeminIQ's Calculated Metrics library solves. The same as-filed inputs and the same formulas used in this walkthrough run automatically, consistently, across every company in the database — current ratio, debt-to-equity, gross profit margin, free cash flow yield, and more than fifty other metrics, recalculated the moment a new filing posts. Once you can calculate a ratio by hand, the Stock Screener becomes the tool for asking the same question across the entire market: which companies clear a current ratio above 1.5, a debt-to-equity below 1.0, or a free cash flow yield above 5%, all at once.
For the metric that goes one level deeper than any single ratio here — combining profitability and capital efficiency into a single number — see Return on Invested Capital (ROIC): Formula and Benchmarks.
Frequently Asked Questions
Does this process work the same way for a 10-Q as it does for a 10-K?
Yes. The line items, the XBRL tags, and the formulas are identical between the two filing types. The only difference is reporting cadence — a 10-K covers a full, audited fiscal year, while a 10-Q covers one unaudited quarter with year-over-year comparisons. The advantage of building flow ratios like Gross Profit Margin or Free Cash Flow Yield from a 10-K is that the full year is already in the filing, so no trailing-four-quarter summation is needed.
Why do some ratios use a single period and others use a full year?
Balance sheet ratios like the current ratio and debt-to-equity ratio are snapshots — they describe a company's position on one specific date, so a single period is correct by definition. Income statement and cash flow ratios like gross profit margin and free cash flow yield are flow measures. In a 10-K the flow figure already covers a full fiscal year; in a 10-Q you would sum the trailing four quarters to get the equivalent trailing-twelve-month figure and smooth out seasonality.
Can I calculate these ratios without a paid data platform?
Yes. Every input in this guide is publicly available on SEC EDGAR for free. The tradeoff is time: locating the correct line item across dozens of possible label variations, and repeating the process for every company under analysis. A platform that pre-calculates these metrics from the same as-filed data removes the manual labor without changing the underlying math.
Why might my by-hand calculation differ from a number I see on a different financial website?
The formula is rarely the source of disagreement — the definition of an input usually is. "Total debt" can mean only interest-bearing instruments or it can mean total liabilities, depending on the platform. "Capex" can include or exclude capitalized software development costs. If a by-hand calculation built from as-filed figures does not match a platform's displayed number, the input definitions disagree — not the filing.
Wall Street's data. Main Street's price.
Institutional terminals charge thousands a year for as-filed accuracy. GeminIQ gives you the same thing for a fraction of the cost: financials built directly from raw SEC EDGAR filings, not third-party APIs, with full XBRL traceability back to the original 10-K or 10-Q. No normalized guesswork, just calculated metrics, charts, screeners, and watchlists built on numbers exactly as the company reported them. Start researching now at GeminIQ.com.
All financial figures cited in this article reference Apple Inc.'s FY2025 10-K (filed October 31, 2025, fiscal year ending September 27, 2025). All SEC filings are publicly available at SEC EDGAR.
Disclaimer: The content in this blog is for educational and entertainment purposes only and does not constitute financial, legal, or tax advice. Investing involves risk, including the loss of principal. The views expressed are my own and not intended as financial advice or a guarantee of future performance.