
Insider Cluster Buying: What the Data Actually Shows

By Chad Hartman
Published · Last updated
Insider buying is an open-market purchase of a company's stock by one of its officers, directors, or 10% owners, reported on SEC Form 4 with transaction code P. It is the one insider transaction that means the person chose to spend their own money on the stock, which is why it carries more information than insider selling, and why several insiders buying at once, a cluster buy, carries more than any single purchase.
Financial media covers insider transactions as if every filing is equal signal. A CEO buys 10,000 shares — financial sites flag it. A director sells 5,000 — that generates a headline too. Both responses treat the individual transaction as the unit of analysis. The research record says they shouldn't.
Decades of empirical work on insider trading finds the same thing: individual insider purchases produce modest abnormal returns, inconsistently, with enough noise to make them unreliable as standalone research inputs. Cluster buying events — where multiple insiders at the same company purchase shares on the open market within a short window — produce returns that are categorically stronger and far rarer. The convergence of independent informed opinion is what creates the signal. And most investors never track it systematically because most platforms don't surface it cleanly.
This post covers the research evidence behind why the signal concentrates in clusters rather than individual transactions, what factors separate high-quality cluster events from low-quality ones, and what GeminIQ's raw Form 4 data reveals when you apply that framework to GameStop's 17-year insider transaction history.
Why Individual Insider Buys Are A Weaker Signal Than You Think
The intuition behind insider buying as a signal is sound. An executive who purchases shares on the open market with personal capital is making a deliberate decision — a view on valuation, a bet on near-term catalysts, a statement of confidence in the business. That's categorically different from receiving RSUs through a compensation plan or exercising expiring options. They chose to buy at the current price with their own money.
But intuition and data don't always agree. The noise in any individual insider buy signal is substantial. Insiders purchase for reasons that carry no analytical content: stock ownership guideline compliance, portfolio optics ahead of an investor day, signaling stability during a CEO transition, tax-offset positioning. A director buying 2,000 shares at $20 to satisfy a minimum board ownership requirement generates a Form 4 filing that looks identical to a director buying 2,000 shares at $20 because they believe the company is trading at a significant discount to intrinsic value. The filing reports the code and the price. It doesn't report the motivation.
H. Nejat Seyhun's foundational research established that insider purchases were, in aggregate, predictive of positive future returns — but the predictive power was unevenly distributed. It didn't concentrate in the largest individual purchases. It concentrated when multiple insiders within the same firm were purchasing simultaneously. The firm-level signal consistently said more than any individual transaction.
Lakonishok and Lee's 2001 analysis in the Journal of Finance formalized this finding. Their central metric was the net purchase ratio — the fraction of a company's insider transactions within a given period that were purchases rather than sales. When that ratio was elevated — when more insiders were buying than selling at the same company in the same window — forward returns were meaningfully stronger. The predictive content lives in the convergence, not in any single filing.
Jeng, Metrick, and Zeckhauser's 2003 analysis in the Review of Economics and Statistics found that insider purchases in aggregate generate roughly 6% annual abnormal returns — but this average masks wide variance between isolated low-conviction buys and genuine cluster events. Standard financial media reports the former with the same urgency as the latter. They are not the same event.
What Makes a Cluster Event Different
The formal academic definition of a cluster buy typically requires two or more insiders purchasing shares at the same company within a defined window — often 30 days. That threshold is permissive enough to include events with minimal analytical weight, and applying it mechanically can cause investors to overweight low-quality cluster appearances.
What actually distinguishes a meaningful cluster event from a statistical coincidence is the convergence of several independent decisions. Each insider who buys on the open market is making their own assessment: do I want to allocate personal capital to this company at this price? When two insiders reach the same conclusion, there's a chance it's coincidental. When five insiders — spanning different roles, different departments, different information access levels — reach the same conclusion within a 9-day window, the coincidence interpretation collapses.
The amplification mechanism is informational diversity. Insiders at different levels of a company see different parts of the picture. A CFO has the clearest view of cash flow trajectory and near-term liquidity. An independent director sees the strategic governance picture from board presentations and committee work. An EVP running a business unit sees operational momentum in their segment. When all of them independently conclude that the current stock price undervalues what they can see, they're each drawing from different information sources to reach the same conclusion. That is the signal.
It is also worth noting what the research says about the other direction. Lakonishok and Lee's paper found that insider sales are largely uninformative as a standalone signal. The asymmetry is real and important. Cluster selling — simultaneous sales by multiple insiders — is far harder to interpret because the motivations for selling (diversification, estate planning, tax obligations, option expirations) are varied and unrelated to business conviction. The useful signal in Form 4 data is almost entirely on the purchase side.
The Five Factors That Define Cluster Buy Quality
Not all cluster events are equal. A cluster buy by three independent directors who each purchased $8,000 over the course of a quarter is technically a cluster. A cluster buy by the CEO, Chairman, and two independent directors who collectively purchased $21.98 million in a 3-day window — all discretionary, all direct — is a different category of event entirely. Using a single threshold to treat them equally produces false positives and underweights the events that matter most.
The following five factors capture most of the quality variance across real-world cluster events. Applying them takes minutes using GeminIQ's Insider Transaction Timeline, which surfaces every Code P open-market purchase and Code S open-market sale directly from the raw Form 4 feed for any company in the database.
Factor 1: Insider Role Hierarchy
Not all Form 4 filers have equal access to the same information. A CEO, CFO, or COO has enterprise-wide visibility — financial performance, pipeline status, strategic options, near-term catalysts. An independent director sees a filtered version of the same picture through board presentations and committee materials. A senior VP or business unit head has deep operational visibility within their segment but limited exposure to the whole.
The strongest cluster events include C-suite insiders alongside board members. When the executive team and independent directors are making the same open-market purchase decision simultaneously, that is multi-tier convergence — they're each drawing on different information to reach the same conclusion about the stock price. A cluster composed exclusively of independent directors carries less weight than one anchored by C-suite participation. A cluster composed only of VP-level officers with no named C-suite or board representation is weaker still. Multi-tier representation amplifies the signal.
Factor 2: Dollar Commitment Relative to Role
The absolute dollar value of purchases matters — but commitment relative to each insider's compensation is the more informative measure. A CEO earning $5 million in total annual compensation who purchases $50,000 of stock is making a modest gesture. A director earning $200,000 in annual board fees who purchases $150,000 of stock is making a much larger proportional bet.
The most informative cluster events are those where dollar commitment is large enough relative to each insider's financial position that the purchase represents a genuine financial decision rather than a routine ownership signal. When insiders are allocating amounts that would meaningfully affect their personal financial situation if the stock declined sharply, the conviction behind the transaction is quantifiably real.
Factor 3: Time Compression
The tighter the cluster, the stronger the signal. Five insiders purchasing within the same 3-day window is more informative than five insiders purchasing across the same quarter. Tight time compression suggests all participating insiders experienced the same triggering condition — a price dip, a post-earnings washout, a macro-driven sector selloff — and independently concluded it represented a buying opportunity.
Loose clustering across a full quarter may reflect nothing more than the opening of a quarterly trading window and five separate, unrelated decisions made at different moments for different reasons. That is technically a cluster, but the convergence is temporal coincidence rather than conviction alignment.
Factor 4: Plan-Free Status
Any purchase executed under a pre-arranged Rule 10b5-1 trading plan is categorically less informative than a discretionary purchase. A 10b5-1 plan was established months before execution — it reflects the insider's view at adoption, not their current assessment. For cluster events specifically, the ideal scenario is that none of the constituent purchases carry 10b5-1 footnote disclosures. When all participating insiders made discretionary open-market purchases outside of pre-planned schedules, the convergence reflects contemporaneous, independent conviction.
Checking plan status requires going directly to the Form 4 footnotes on EDGAR. GeminIQ's Insider Transaction Timeline identifies all Code P purchases and Code S sales cleanly from the raw filing data — footnote verification for plan status is the one step that requires pulling the underlying Form 4 document for each transaction in a cluster event.
Factor 5: Price Context
Cluster buying at a 52-week low, near book value, or following a period of significant price drawdown carries more information than cluster buying at elevated prices during a post-catalyst momentum run. The price context tells you whether insiders are expressing contrarian conviction — "this is cheap relative to what we know about the business" — or accumulating into a period when the stock already reflects positive expectations.
The strongest cluster signals in the empirical record have occurred when prices were under significant negative pressure and the consensus narrative was pessimistic. That is precisely when insiders have the least external incentive to buy, making their decision to do so most informative. Cluster buying into a depressed stock that is being downgraded by analysts and shorted by institutions represents a much cleaner signal than cluster buying into a stock that is outperforming its peers and generating favorable press.
GameStop: Scoring Two Cluster Events Against the Framework
GeminIQ's raw Form 4 data for GameStop spans from November 2008 to January 2026 and covers every open-market purchase and sale in the company's full insider transaction history. The dataset contains multiple distinct cluster events — but two stand out for what they reveal about how the five-factor framework scores events at opposite ends of the quality spectrum.
September 2019: Five Directors, One Inflection
In a 9-day window between September 18 and September 27, 2019, five GameStop independent directors made simultaneous open-market purchases while the stock was trading near multi-year lows, between $4.62 and $5.38 per share.
The names and amounts from GeminIQ's raw Form 4 feed: Raul Fernandez purchased across two transactions — 5,250 shares at $4.62 and 4,900 shares at $5.07 — for approximately $49,098 total. Carrie Teffner purchased 21,118 shares at $4.73 for $99,888. Gerald Szczepanski purchased 40,000 shares at $5.04 for $201,600. Kathy Vrabeck purchased 20,000 shares at $5.29 for $105,800. Lizabeth Dunn purchased 5,000 shares at $5.38 for $26,900. Five independent directors, six transactions, 96,268 shares, $483,286 combined, 9 calendar days. All direct ownership. No officer participation.
Against the five-factor framework: Role hierarchy scores moderate — all directors, no C-suite representation, no multi-tier convergence. Dollar commitment scores moderate to strong — several directors purchased amounts representing a meaningful fraction of typical independent director compensation, with Szczepanski's $201,600 purchase being the standout. Time compression scores strongly at 9 days. Plan-free status appears clean based on the direct-ownership, open-market structures of the filings. Price context is the standout factor: purchases at $4.62 to $5.38 represented the lowest prices GameStop had traded at in its public history up to that point.
The data was public in real time. Five directors making simultaneous purchases at a stock's all-time lows, captured cleanly by GeminIQ's Code P filter, was a visible signal. The subsequent company transformation — including Ryan Cohen's entry as an activist investor and eventual CEO — began roughly 14 months after this cluster.
January 2026: Scoring the Highest-Quality Event in the Dataset
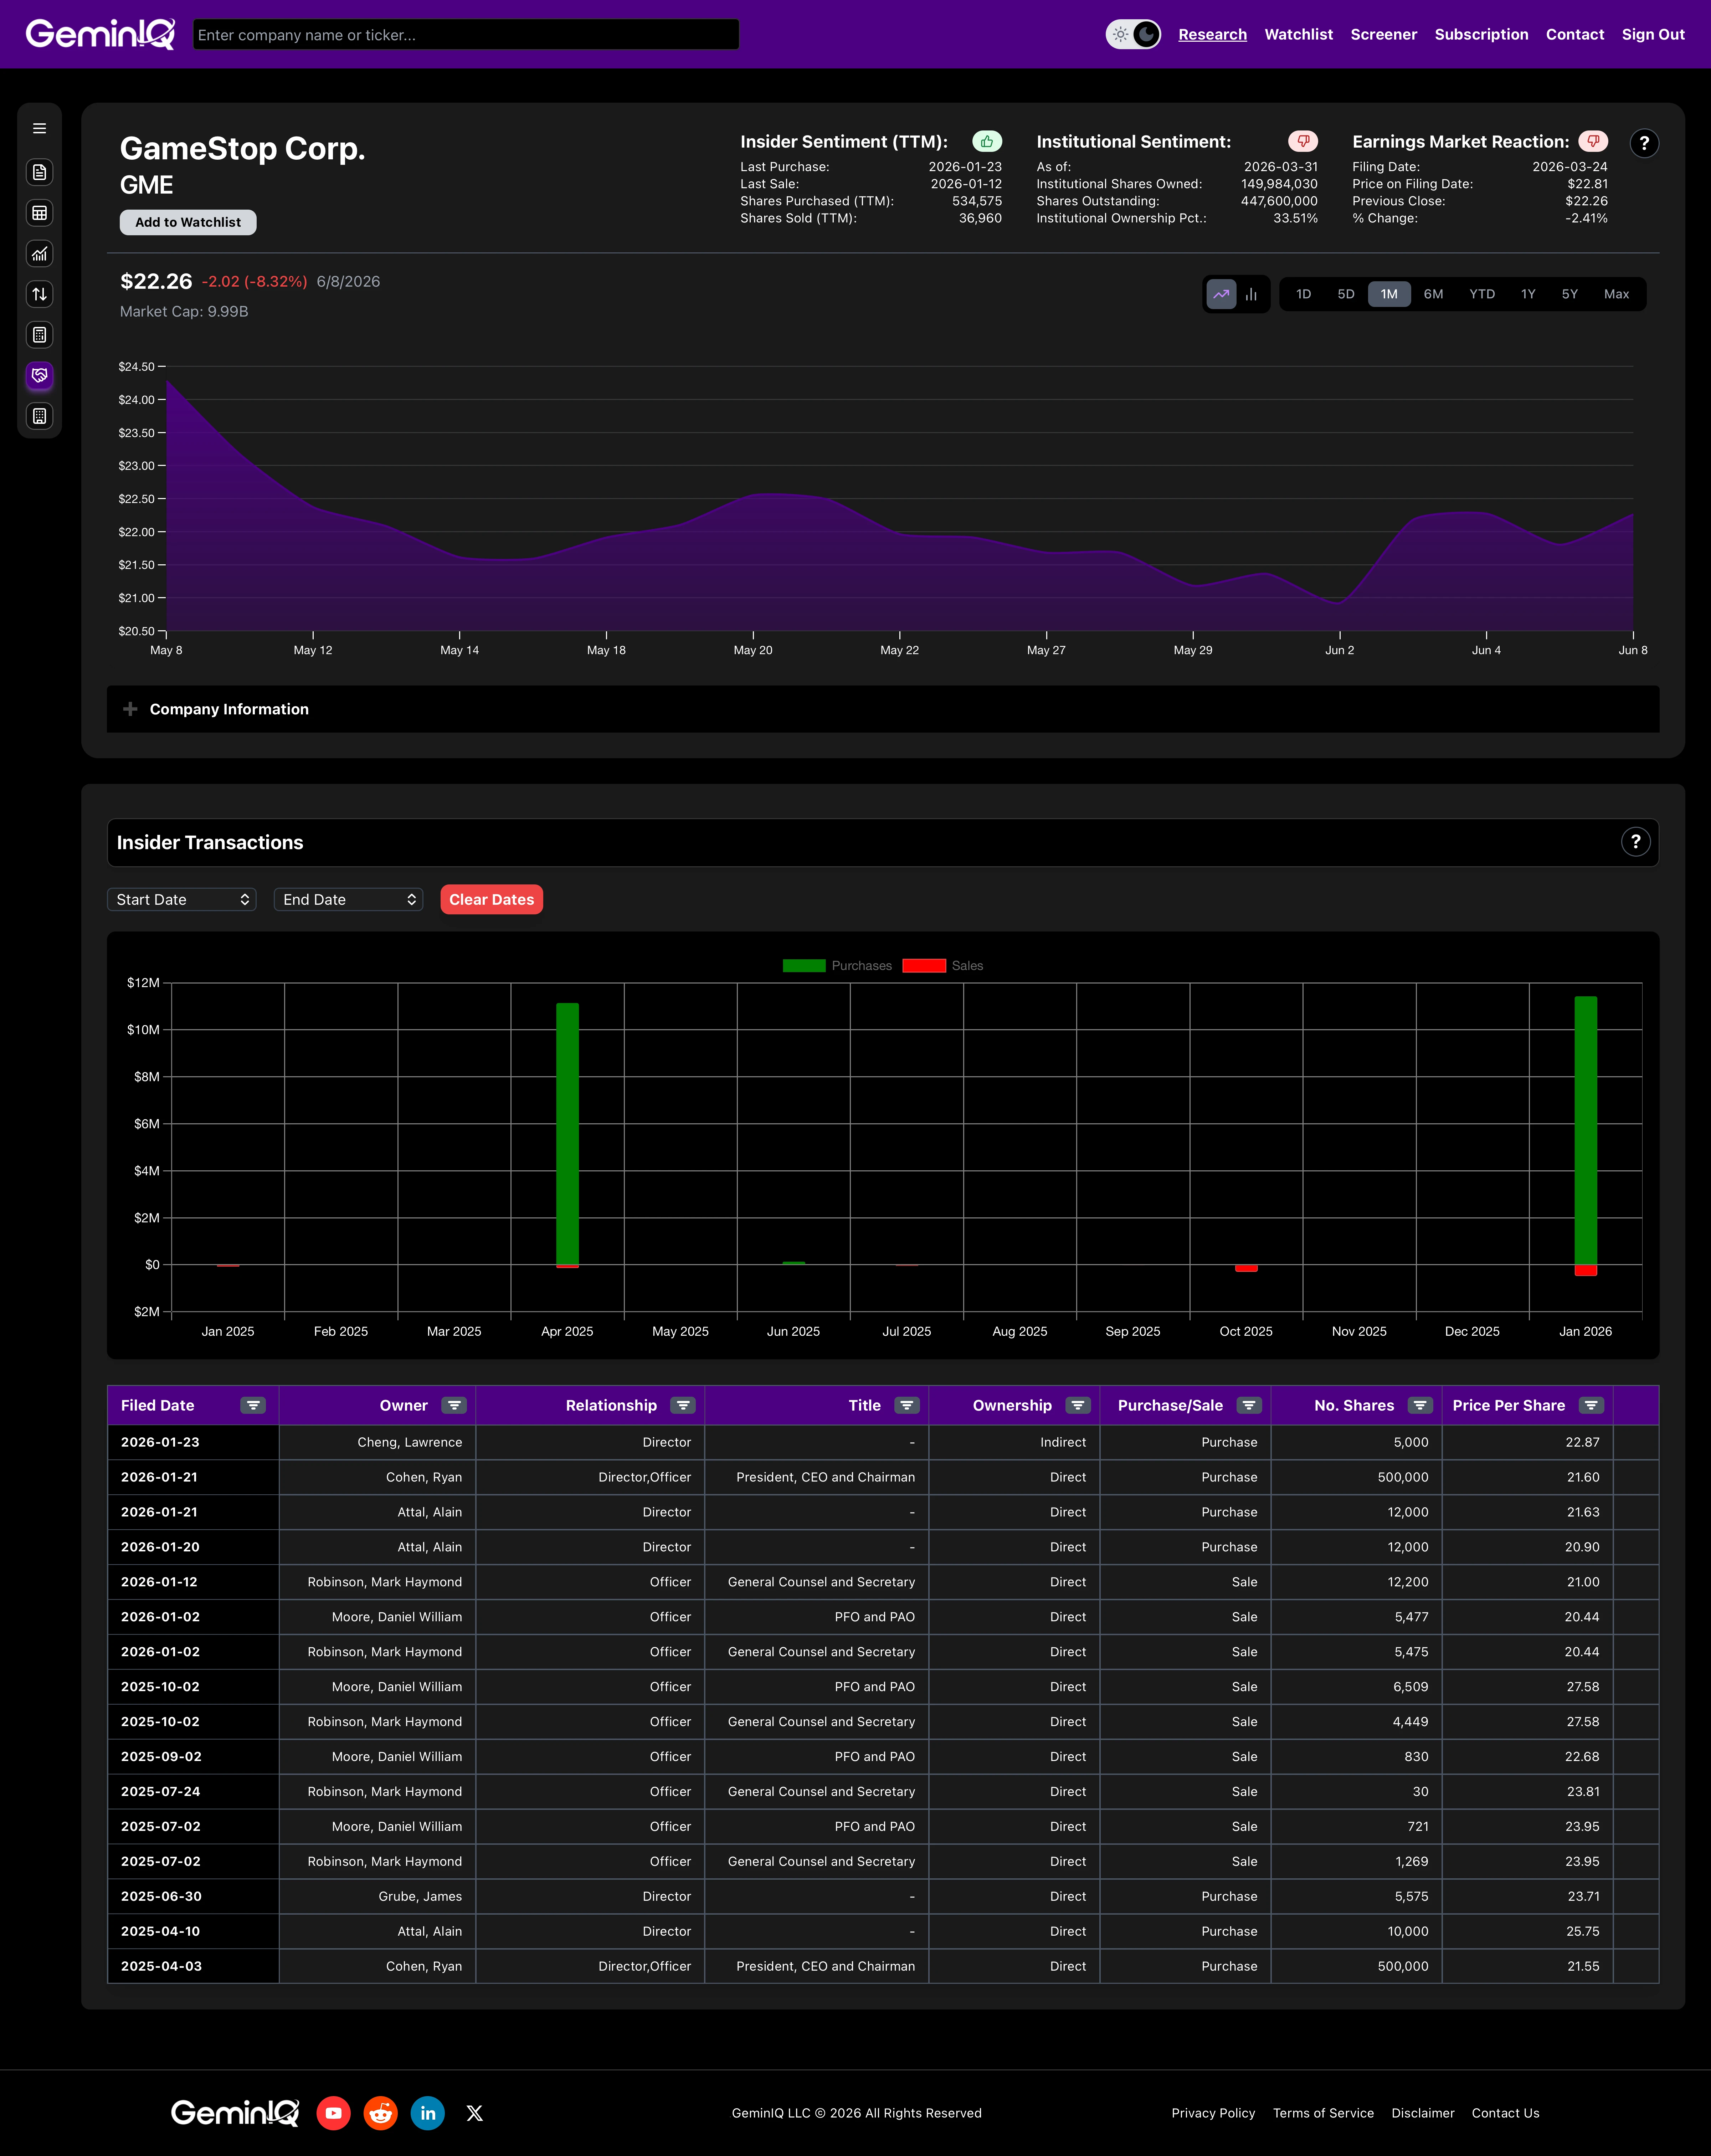
The most recent and highest-scoring cluster event in GeminIQ's GameStop data occurred in a 3-day window between January 20 and January 23, 2026.
Ryan Cohen, serving as President, CEO, and Chairman, purchased 500,000 shares on January 20 at $21.12 for $10,560,000, then an additional 500,000 shares on January 21 at $21.60 for $10,800,000 — 1,000,000 shares and $21,360,000 across two consecutive trading days, all direct ownership. Both transactions were filed under the same Form 4 accession on January 21, 2026; GeminIQ's transaction table surfaces the January 21 entry for this filing, with the full two-day purchase detail visible in the underlying Form 4 on EDGAR. Director Alain Attal purchased 12,000 shares at $20.90 on January 20 for $250,800, then 12,000 more at $21.63 on January 21 for $259,560 — $510,360 combined, direct ownership. Director Lawrence Cheng purchased 5,000 shares on January 23 at $22.87 for $114,350, through an indirect holding structure. Three insiders. 1,029,000 shares. $21,984,710. Three calendar days.
Against the five-factor framework: Role hierarchy scores at maximum — the CEO and Chairman is the highest-tier insider available, joined by two independent directors, delivering the multi-tier convergence that single-tier clusters cannot provide. Dollar commitment is extraordinary — Cohen's $21,360,000 represents one of the largest single-cluster CEO open-market commitments in recent public company data, and Attal's $510,360 is substantial relative to typical independent director compensation. Time compression scores at maximum for a 3-insiders-over-3-days event. Plan-free status requires footnote verification on EDGAR, though the structure of Cohen's purchases — 500,000 shares on each of two consecutive days at successively higher prices — is characteristic of discretionary accumulation rather than pre-scheduled plan execution. Price context scores moderate — the $20.90 to $22.87 purchase range sits above the 2024 lows near $10 to $11 but well below the post-meme peak ranges of 2021 to 2022.
When Cluster Buying Gets It Wrong
The framework improves signal quality — it does not guarantee an outcome. Cluster buying has a documented failure mode, and GameStop's own data illustrates it directly.
In a 3-day window between March 21 and March 24, 2022, the same cast of insiders executed another cluster of open-market purchases. Lawrence Cheng purchased 4,000 shares at $95.22 for $380,880, direct ownership. Ryan Cohen, filing through RC Ventures as a ten-percent owner and board member, purchased 100,000 shares at $102.45 for $10,245,000, indirect ownership through the entity. Alain Attal purchased 1,500 shares at $129.91 for $194,865, direct ownership. Three insiders, $10,820,745 combined, 3 days.
Role hierarchy: strong. Dollar commitment: substantial. Time compression: tight. Plan-free status: consistent with discretionary structure.
But Factor 5 scored low. The purchases were made at prices ranging from $95.22 to $129.91 — well above the normalized trading range the stock would occupy for the following two-plus years. GameStop traded predominantly in the $10 to $25 range throughout most of 2023 and 2024. The 2022 cluster buyers paid elevated prices into residual post-meme premium rather than buying against a depressed narrative.
The lesson is not that cluster buying is unreliable. It's that price context is load-bearing in the framework. Insiders have better visibility into their own company's operations than any outside analyst. They do not have better visibility into the macro environment, interest rate dynamics, or market sentiment cycles that can compress valuations independent of business quality. A cluster that scores four factors well but fails on price context — purchasing into elevated prices rather than against negative pressure — carries substantially less signal than a cluster that scores all five.
The 2019 GameStop cluster at $4.62 to $5.38 was buying against a catastrophic narrative. The 2022 cluster at $95.22 to $129.91 was purchasing into a post-meme residual premium. The five-factor framework scores them very differently — and it should. Price context is the factor that separates conviction from coincidence.
How to Track Cluster Events Without Downloading Filings
The practical barrier to systematic cluster buy analysis is volume. A company with ten active insiders filing through RSU vesting cycles can generate 40 to 60 Form 4 filings per year. Reading each one manually — parsing transaction codes, checking footnotes, calculating net share changes — is not a scalable research process.
GeminIQ's Insider Transaction Timeline pulls directly from the raw Form 4 feed and surfaces only the transactions that carry analytical content: Code P open-market purchases and Code S open-market sales. The RSU grants, tax withholding transactions, option exercises, and compensation-plan-driven filings that constitute the majority of Form 4 volume are filtered out before you ever see them. What remains is a clean record of when insiders chose to spend personal capital at the current market price — and when they chose to convert equity to cash.
With that filtered feed, identifying a cluster event becomes a pattern-recognition task. Multiple Code P transactions from different insiders appearing in the same short window are immediately visible. From there, the five-factor scoring process — role hierarchy, dollar commitment, time compression, plan-free status, price context — can be applied in minutes per company.
The fundamental data that provides the price context factor — where the stock is trading relative to book value, relative to cash flow, relative to the balance sheet — sits on the same company page in GeminIQ. Pre-calculated metrics including Free Cash Flow, Net Debt-to-EBITDA, and Return on Invested Capital are derived directly from SEC filing data and available alongside the insider transaction timeline. The cross-reference between what insiders are doing and what the fundamentals show is immediate.
Frequently Asked Questions
Is insider buying a stronger signal than insider selling?
Generally, yes. Insiders sell for many reasons that have nothing to do with the stock: diversification, taxes, a house purchase, or a scheduled 10b5-1 plan. They buy for essentially one reason, which is that they expect the shares to be worth more. That asymmetry is why open-market purchases (code P) carry more information than sales, and why sales need context before they mean anything.
What stocks are insiders buying right now?
That changes daily. Use an insider trading tracker filtered to open-market purchases (code P) over the last week or two, exclude trades made under 10b5-1 plans, and look for companies where several insiders bought within the same window.
Does insider buying include stock awards and option exercises?
No. Grants and awards (code A) and option exercises (code M) add shares without the insider choosing to buy at the market price, so they are compensation, not insider buying. Only open-market or private purchases reported with code P count.
Related Reading
- How to Read SEC Form 4: Insider Buying and Selling Explained — how to read a single filing field by field before reading a cluster of them.
- Insider Trading Tracker: How to Track Insider Buying and Selling — free and paid ways to track insider trades, the transaction codes to filter for, and a five-step routine for any company's insider history.
- Hidden Information in SEC Filings: What Most Investors Overlook — how insider transaction patterns interact with cash flow signals, balance sheet shifts, and institutional ownership trends for a complete picture.
- GameStop Stock Analysis (2026): The $4 Billion Debt Nobody Priced In — the fundamental picture behind the ticker where the cluster buying framework plays out in practice.
- Complete Guide to SEC Filing Types for Investors — how Form 4 fits into the broader EDGAR filing system alongside 10-K, 10-Q, 8-K, and 13F.
Wall Street's data. Main Street's price.
Institutional terminals charge thousands a year for as-filed accuracy. GeminIQ gives you the same thing for a fraction of the cost: financials built directly from raw SEC EDGAR filings, not third-party APIs, with full XBRL traceability back to the original 10-K or 10-Q. No normalized guesswork, just calculated metrics, charts, screeners, and watchlists built on numbers exactly as the company reported them. Start researching now at GeminIQ.com.
All insider-transaction figures cited in this article are drawn from GameStop Corp.'s SEC Form 4 filings, publicly available on SEC EDGAR. Post-filing market reaction is measured from each filing's filed date.
Disclaimer: The content in this blog is for educational and entertainment purposes only and does not constitute financial, legal, or tax advice. Investing involves risk, including the loss of principal. The views expressed are my own and not intended as financial advice or a guarantee of future performance.