
Intel Stock Analysis 2026: What the Q1 10-Q Actually Shows

By Chad Hartman
Published · Last updated
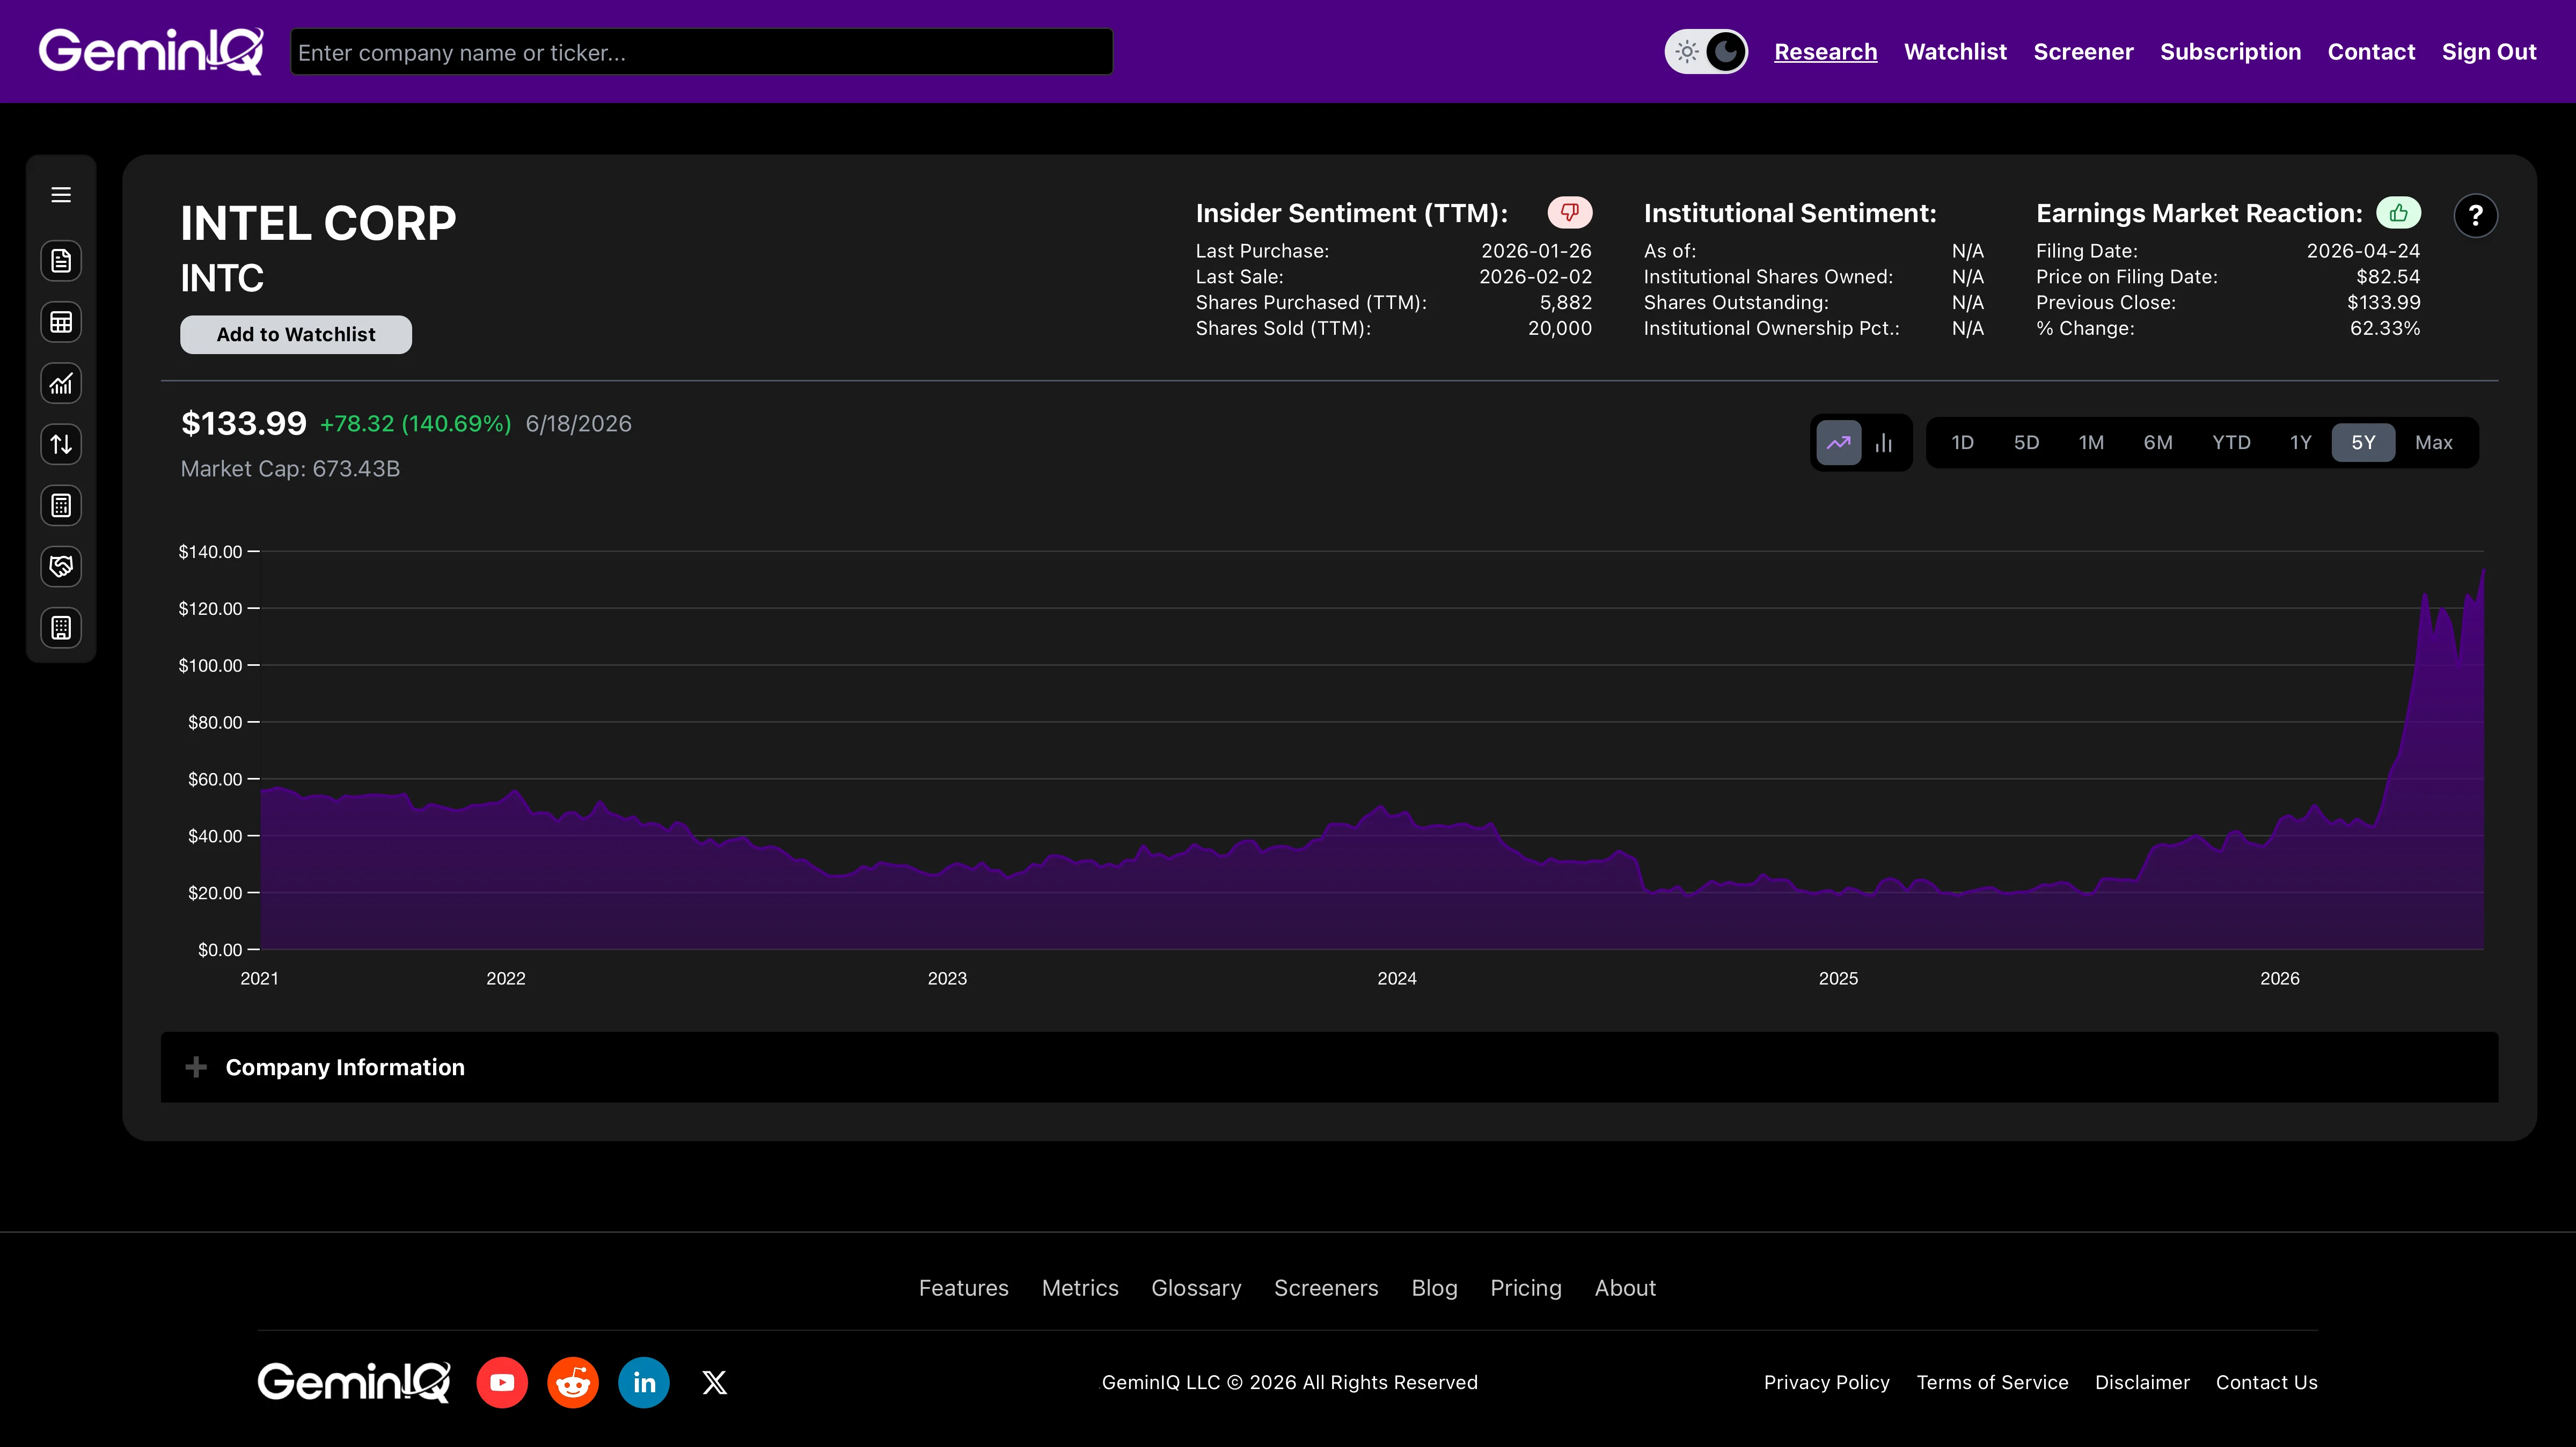
Intel ($INTC) just filed its Q1 FY2026 10-Q (filed April 24, 2026, period ending March 31, 2026), and the financial media is not reading it. The narrative — AI comeback, Computex momentum, Foxconn partnership, 18A process node, full-stack reinvention — drove the stock from roughly $30 to a peak near $135, one of the most dramatic reversals of 2026. But the income statement, the cash flow statement, and GeminIQ's raw SEC data tell a different story. Revenue has fallen 33% from its peak. Free cash flow is negative. The company took $4.07 billion in restructuring charges in a single quarter. And the trailing twelve-month Return on Invested Capital sits at -3.4%. Here is the fundamental, data-driven truth behind the ticker.
| Field | Value |
|---|---|
| Ticker | $INTC |
| Filing | Q1 FY2026 10-Q |
| Filed | April 24, 2026 |
| Period End | March 31, 2026 |
| Free Cash Flow (TTM) | -$3.12 Billion |
| ROIC (TTM) | -3.4% |
The Revenue Collapse the Rally Is Trying to Forget
The financial media covers Intel as a comeback story. The raw income statement tells you how far there is still to go.
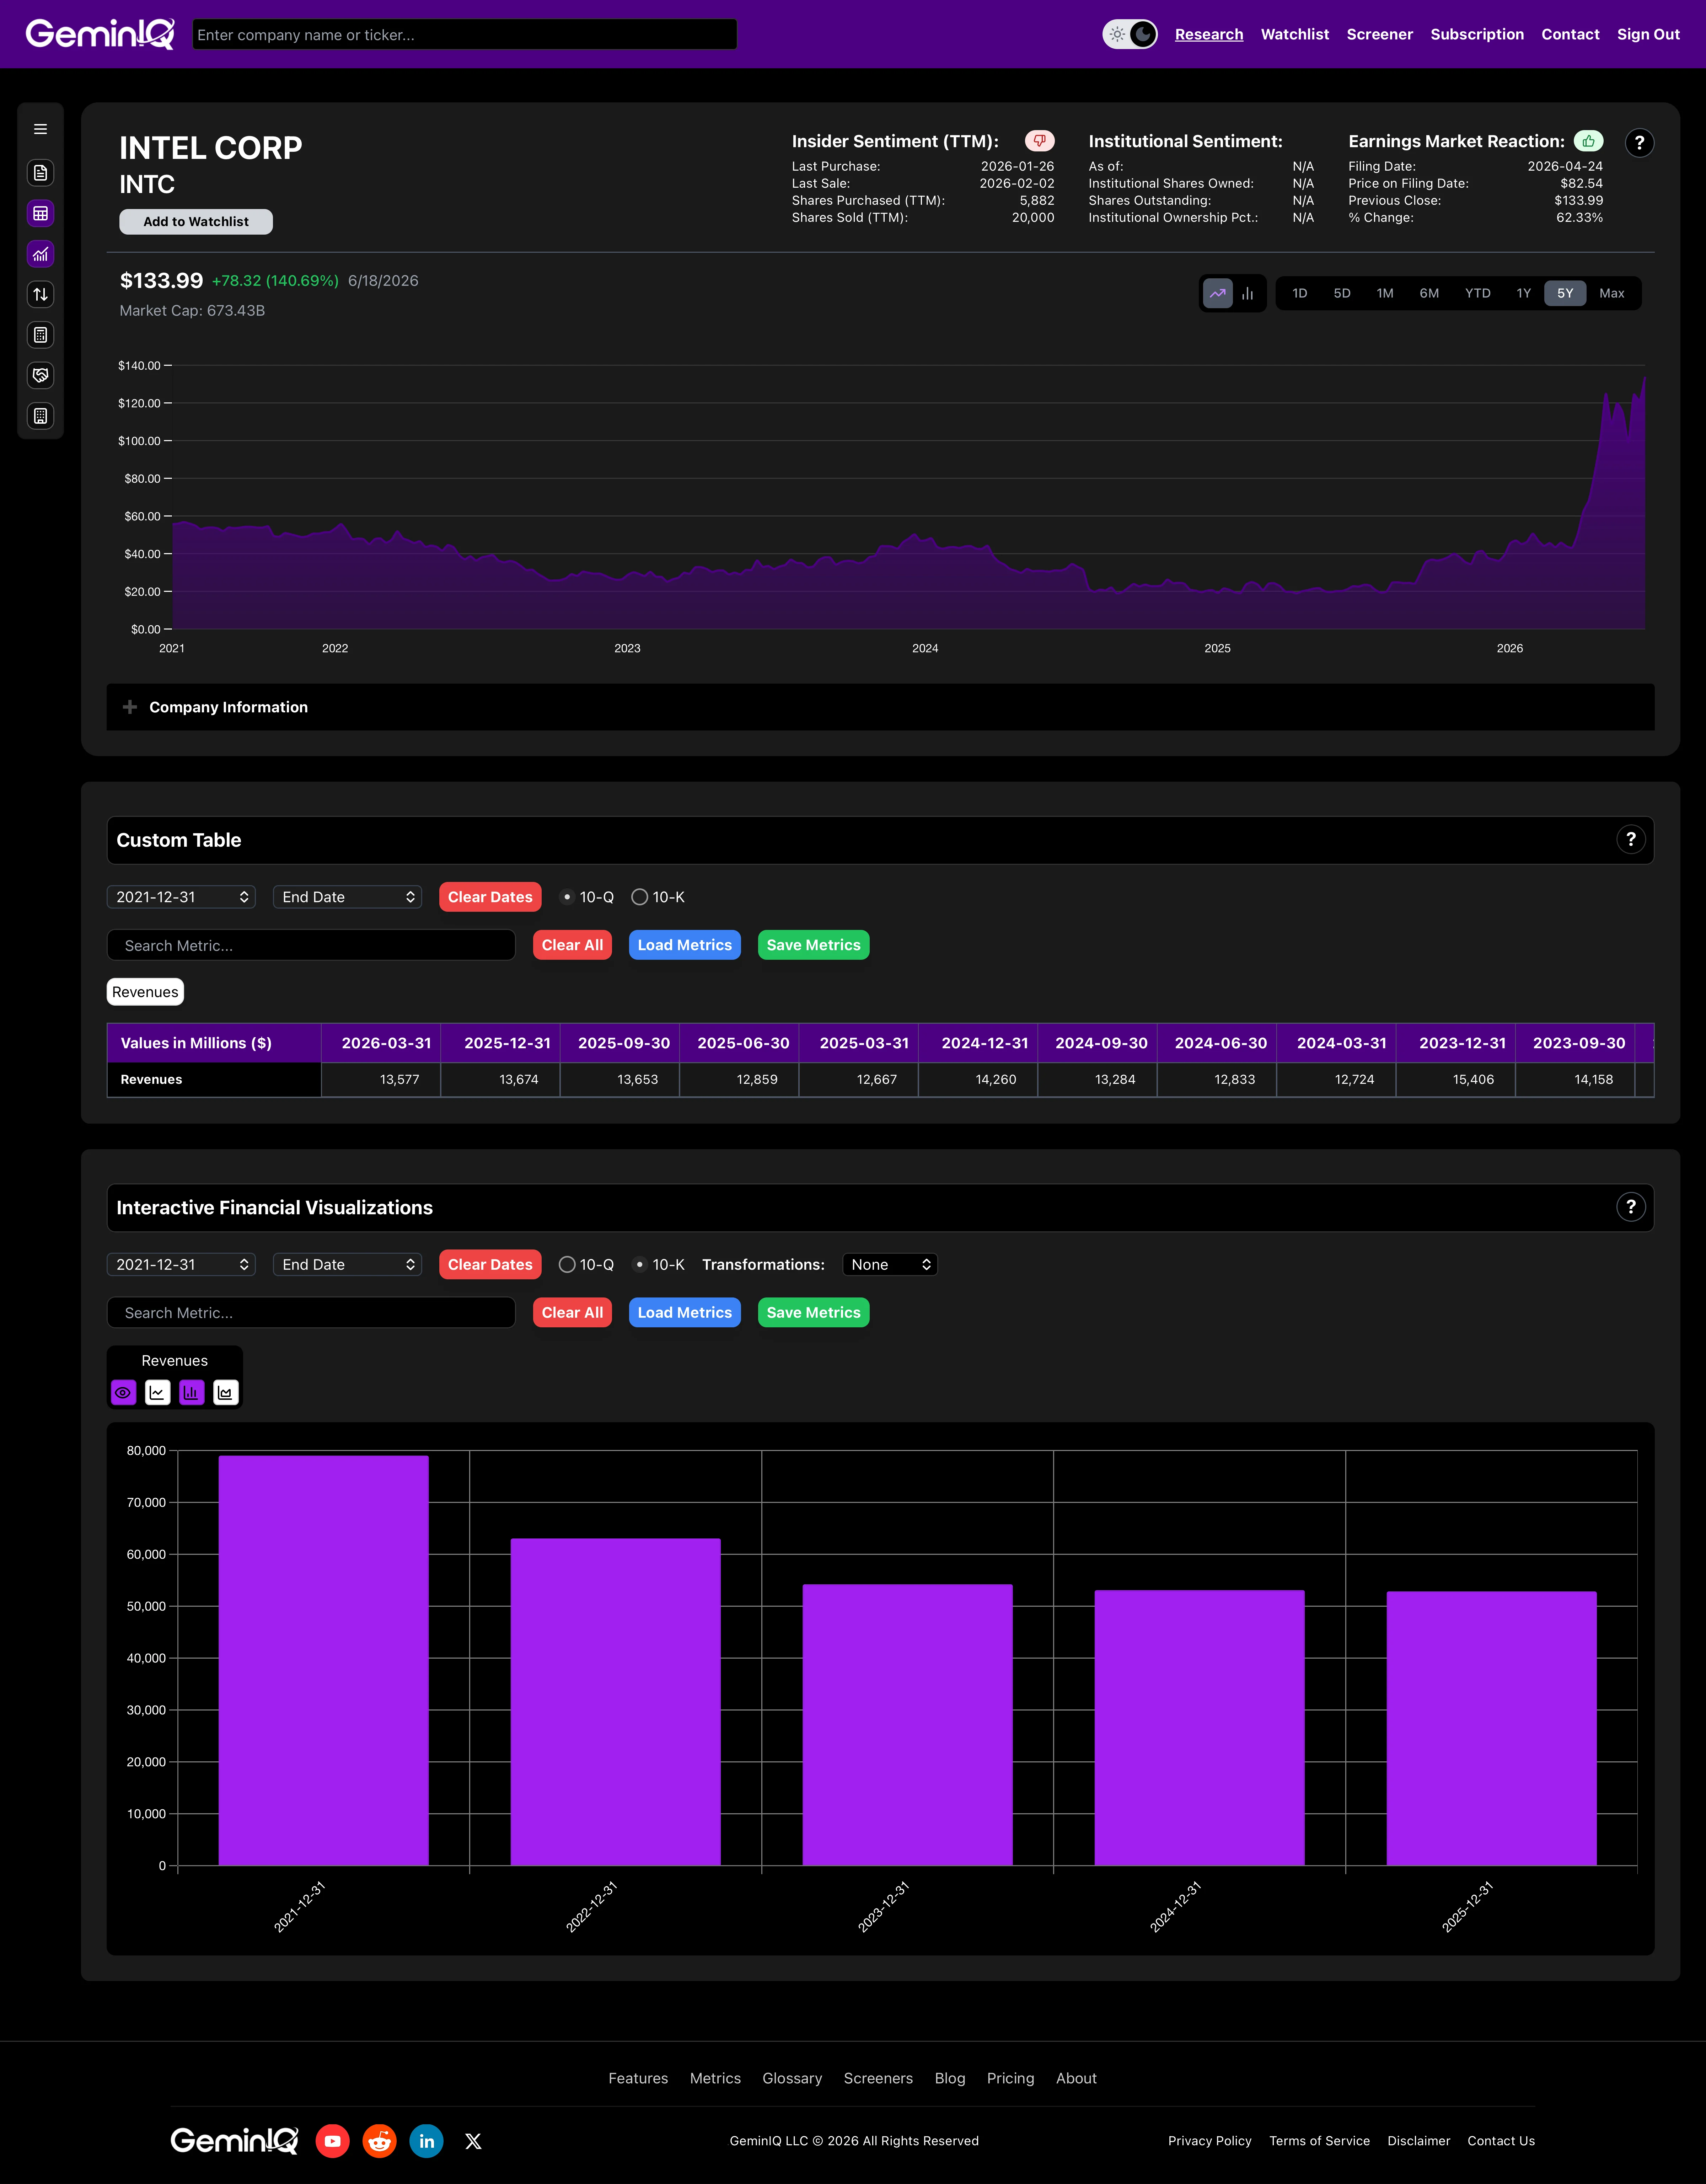
The Data: In FY2021, Intel generated $79.024 Billion in Total Revenues. By FY2022 that had fallen to $63.054 Billion. FY2023 brought $54.228 Billion. FY2024 came in at $53.101 Billion. FY2025 was $52.853 Billion — barely moved from the year before. Q1 FY2026 posted $13.577 Billion in quarterly revenue, which annualizes to approximately $54.3 Billion. Three years of restructuring and billions in capital investment have not reversed a -33% revenue decline from peak.
The GeminIQ Edge: Pulling Intel's Total Revenues line directly from the raw financial statements in GeminIQ makes the trajectory unmistakable. Standard aggregators often present trailing-twelve-month figures that smooth this decline. The period-by-period filing data does not.
Gross Margin: The One Signal Worth Paying Attention To
Not everything in the filing is bad news. One metric has improved in a way worth noting, and it is worth separating from the noise.
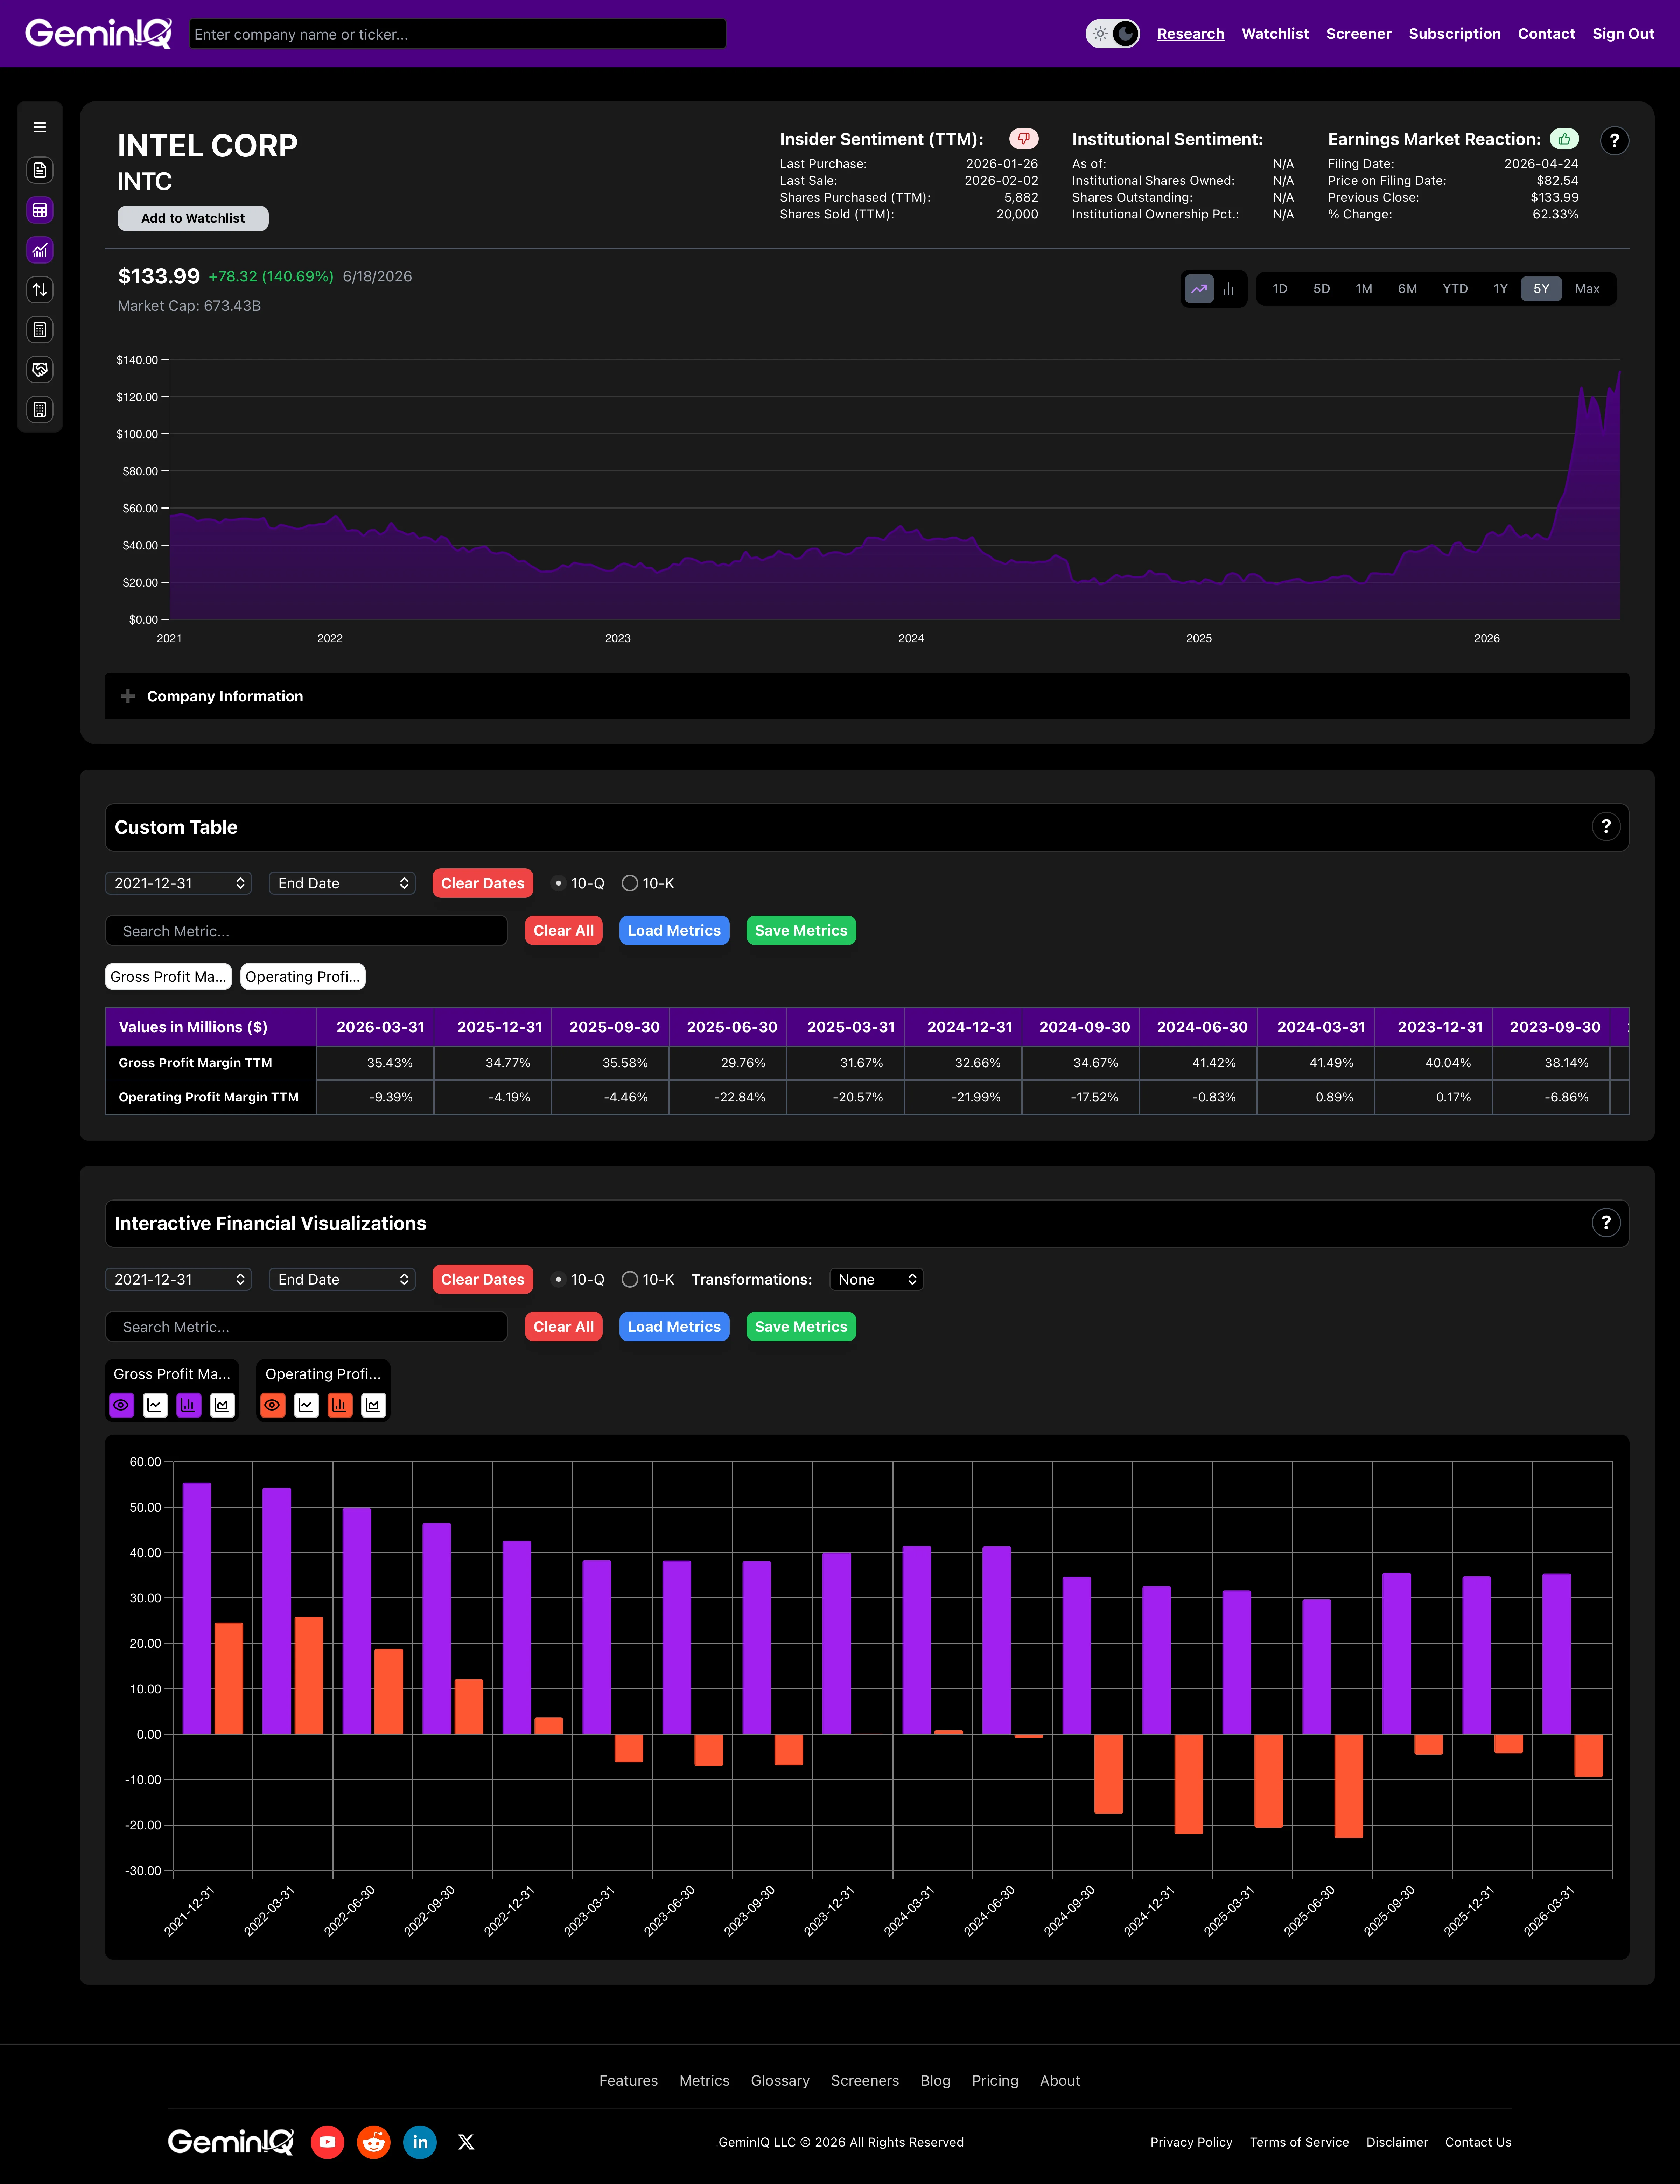
The Data: Intel's Gross Profit Margin (Gross Profit ÷ Total Revenues) collapsed from 55.4% in FY2021 to 32.7% in FY2024 as the company absorbed massive fab depreciation and underutilization costs. FY2025 showed a recovery to 34.8%. Q1 FY2026 reached 39.4%, its best quarterly gross margin since early 2024. Gross profit for the quarter was $5.347 Billion on $13.577 Billion in revenue, leaving $934 million in operating income before restructuring charges. The manufacturing cost story is, slowly, improving.
The GeminIQ Edge: GeminIQ's pre-calculated Gross Profit Margin surfaces this recovery in seconds. Viewing it alongside the Operating Profit Margin makes the remaining gap plain: gross margin is recovering, but operating losses persist — the spending has not caught up to the improvement.
The Restructuring That Never Ends
Here is the line item the Computex coverage ignores. Intel has been taking impairment and restructuring charges at a scale that rivals its operating losses.
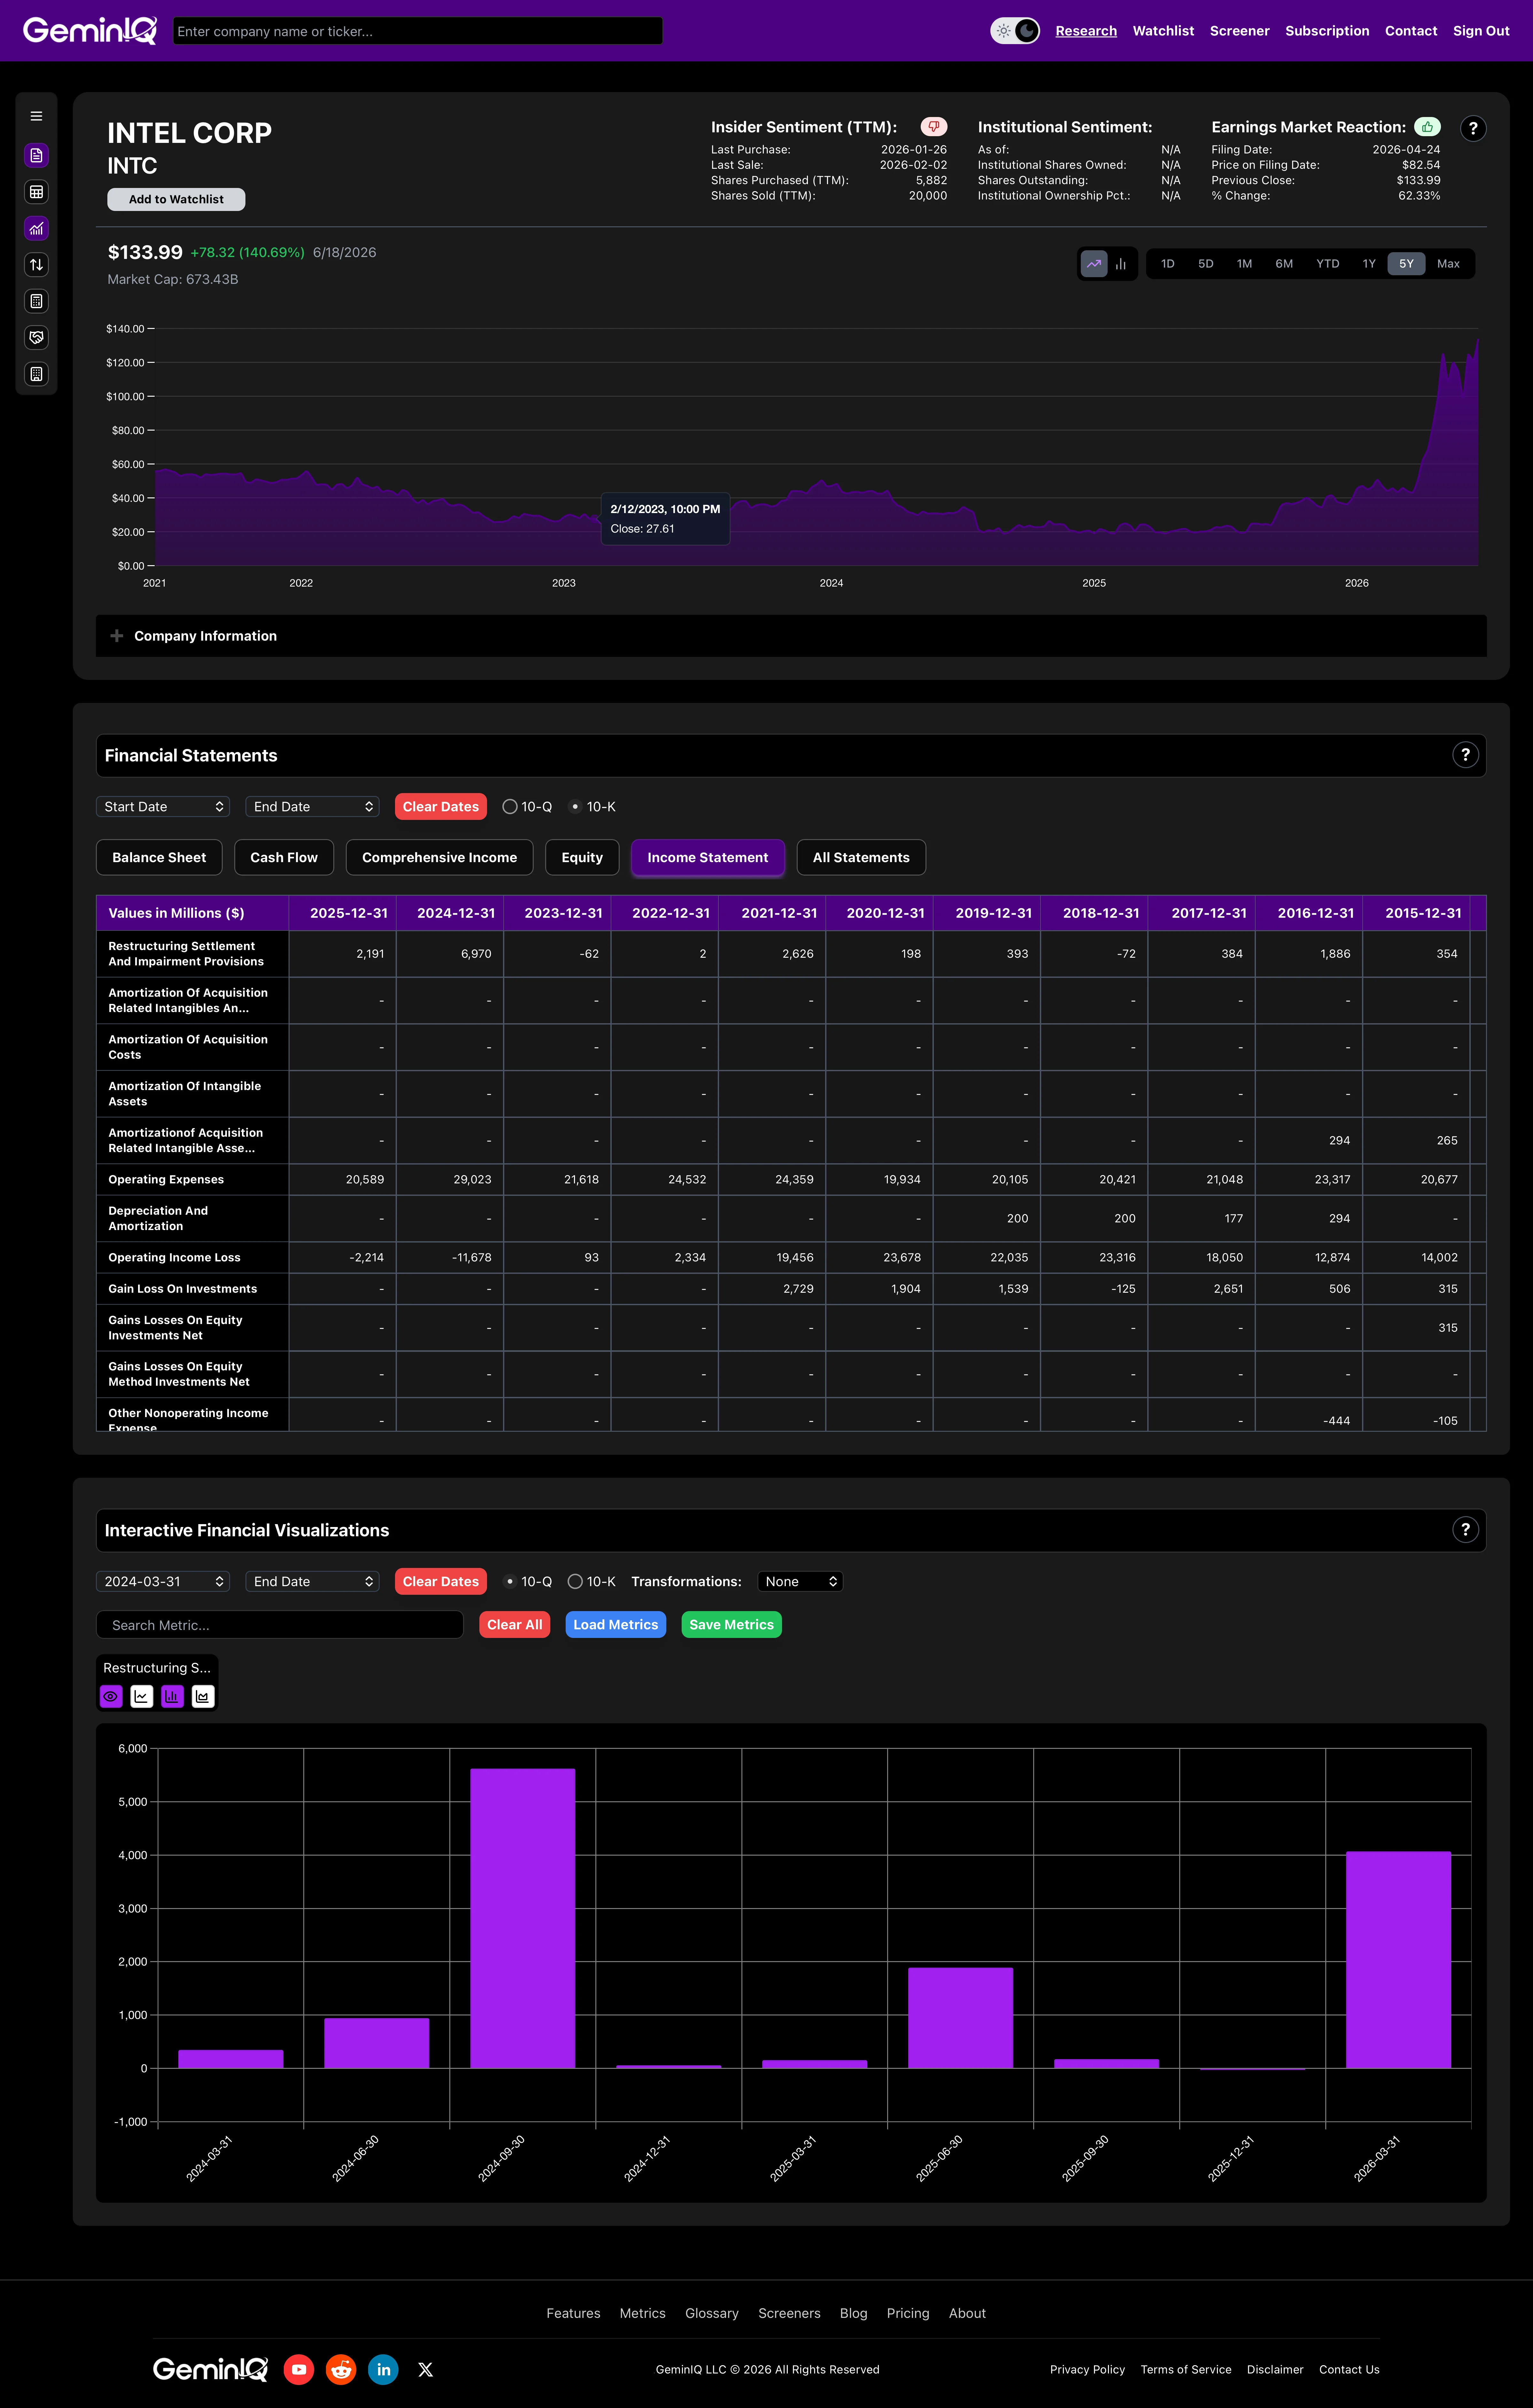
The Data: GeminIQ pulls the Restructuring, Settlement And Impairment Provisions line directly from each filing. In FY2024, Intel booked $6.970 Billion in restructuring and other charges — in a single year. FY2025 added $2.191 Billion more. Q1 FY2026 alone added $4.070 Billion. That is $13.231 Billion in write-offs and impairment charges across the last two fiscal years and the latest quarter, as the company continuously re-values assets from a capacity buildout that preceded the revenue collapse. The $4.07 billion figure in Q1 2026 is precisely what turned gross profit of $5.347 Billion into an operating loss of -$3.136 Billion (Operating Income (Loss)). Strip the restructuring charge and the business generated roughly $934 million in operating profit. Include it and the net loss was -$3.728 Billion.
The GeminIQ Edge: Standard financial media reported the Q1 2026 earnings miss and moved on. GeminIQ's raw filing data lets you track the cumulative impairment toll quarter-by-quarter — what has been written down, how often, and whether the charges are decelerating or accelerating. The Q1 2026 charge of $4.07 billion represents an acceleration, not a wind-down.
Free Cash Flow: The Number That Doesn't Match the Narrative
The stock surged 31.78% in the month following the Q1 FY2026 filing date. The filing itself showed deeply negative free cash flow.
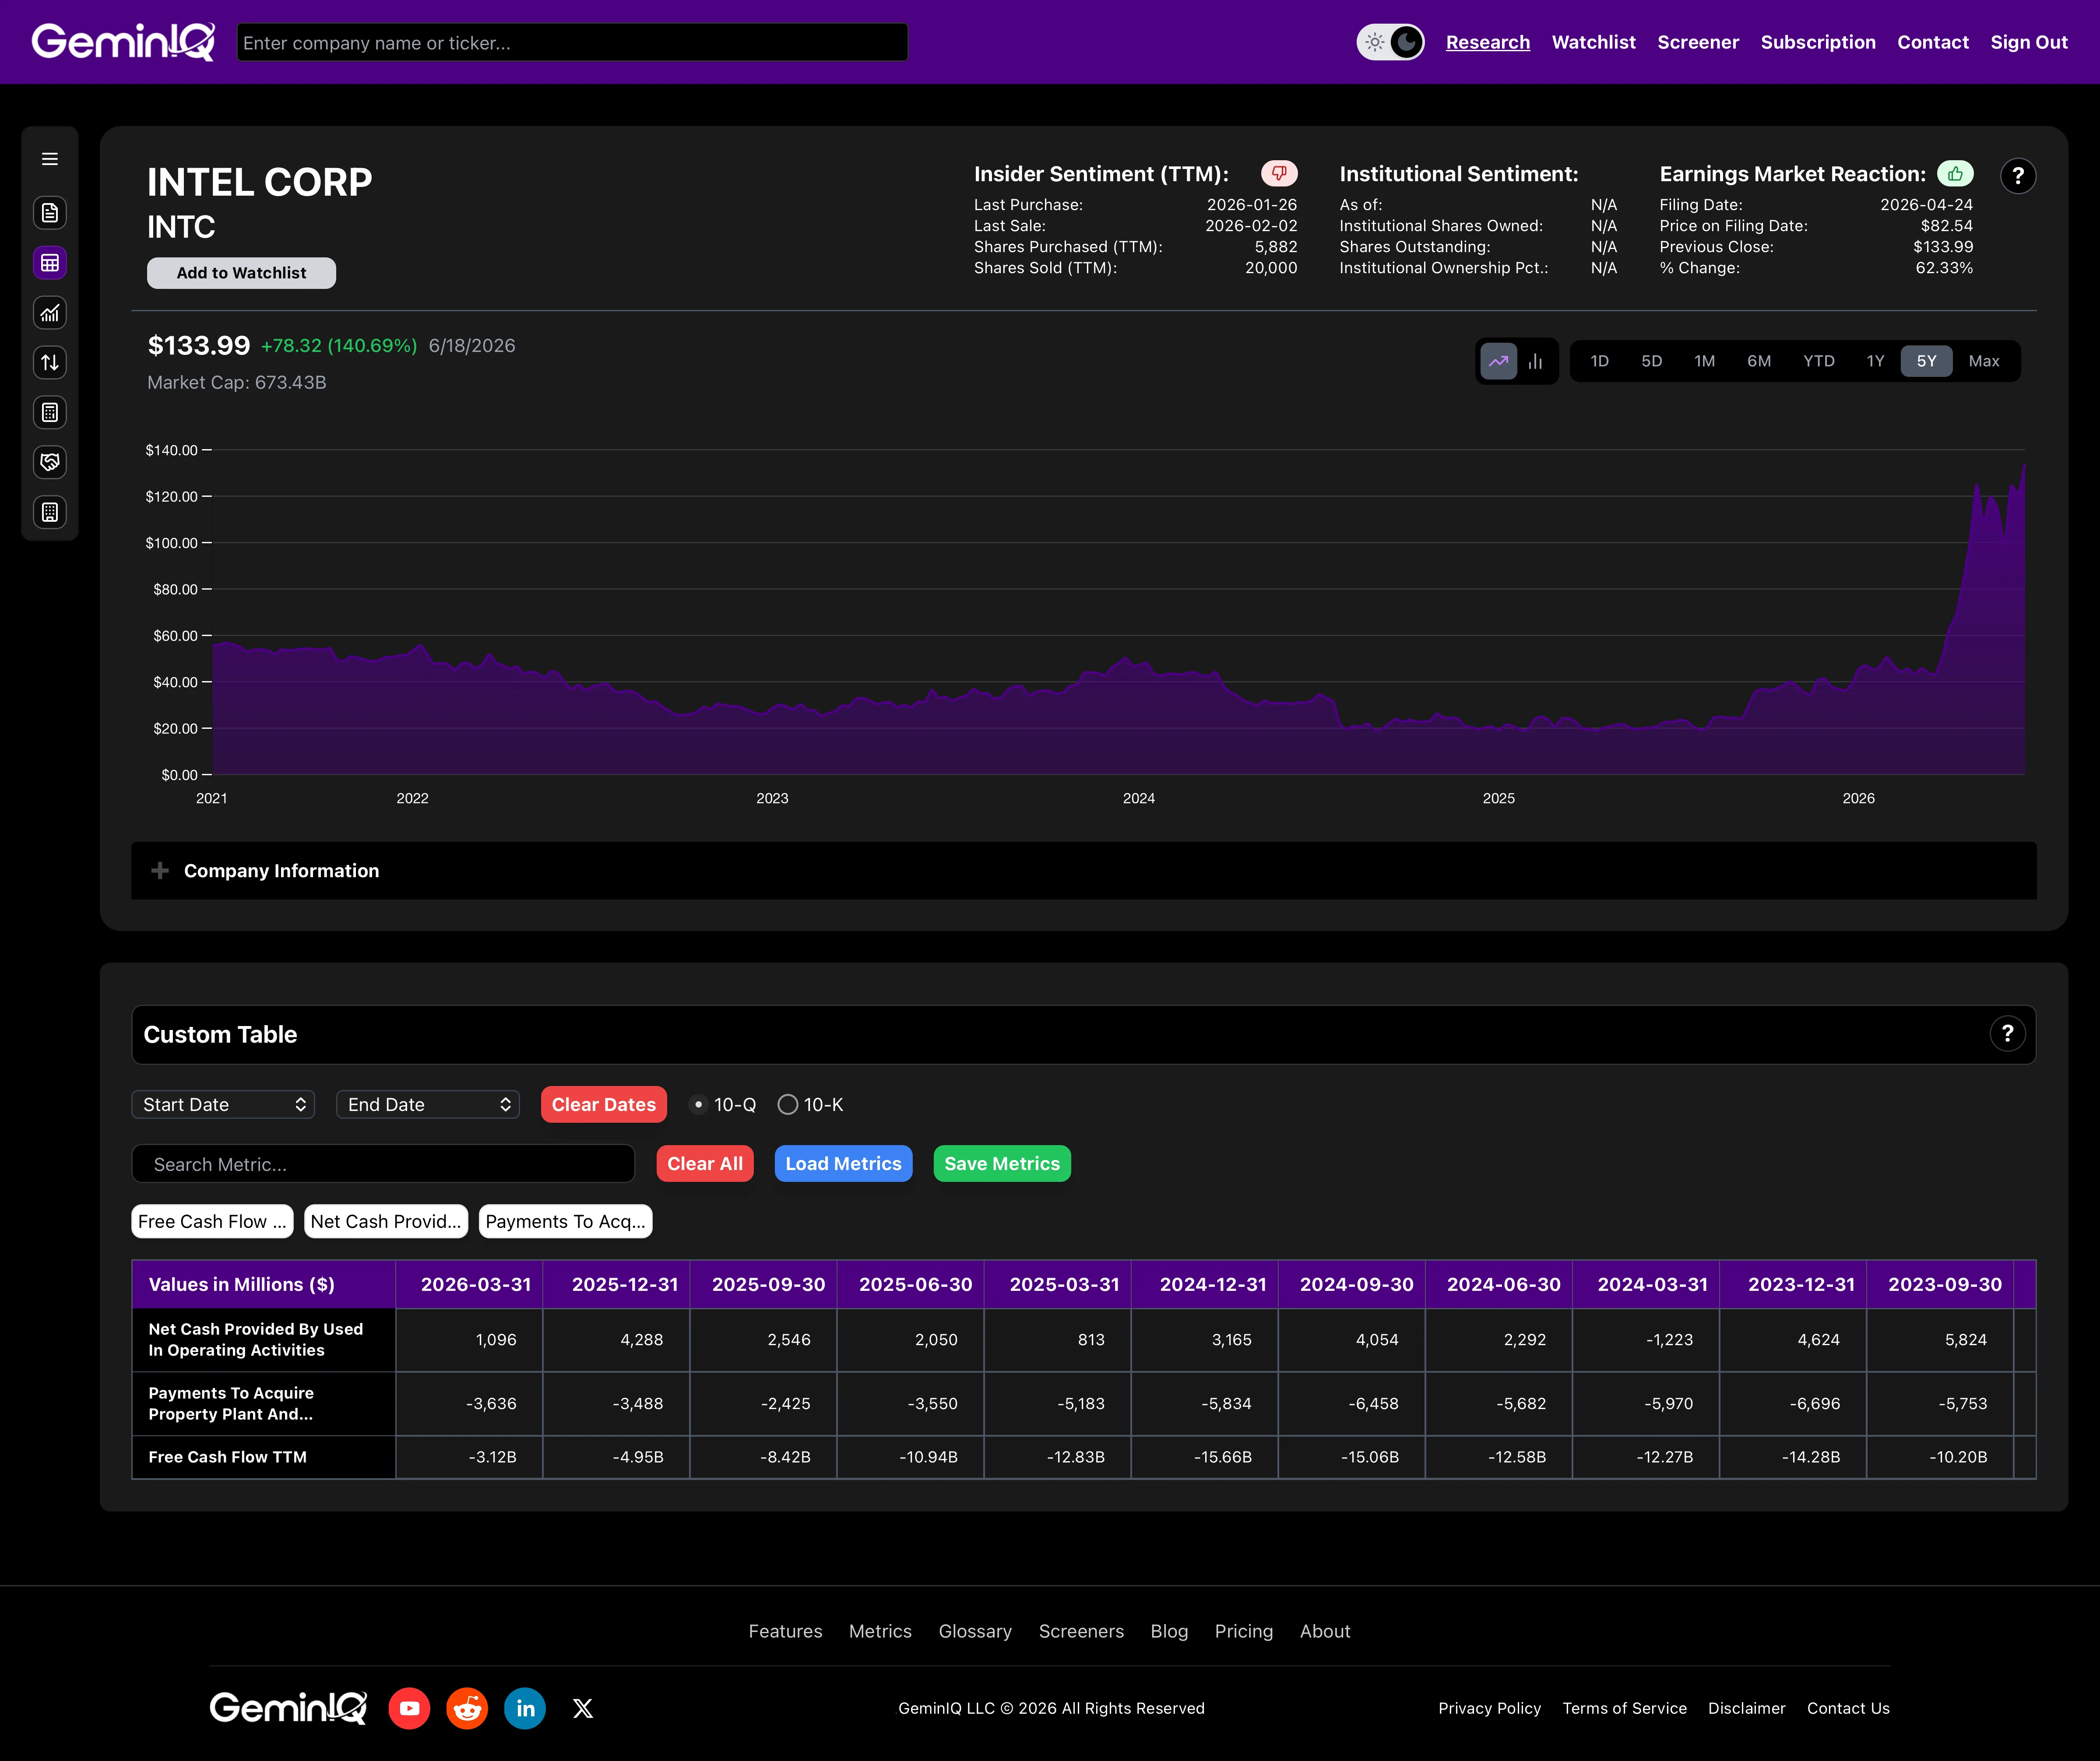
The Data: GeminIQ's pre-calculated Free Cash Flow for Q1 FY2026: operating cash flow of $1.096 Billion minus capital expenditures of $3.636 Billion equals -$2.540 Billion. On a trailing twelve-month basis through March 31, 2026, operating cash flow was $9.980 Billion against $13.099 Billion in capital expenditures — TTM free cash flow of -$3.119 Billion. This is an improvement from FY2024's -$15.656 Billion TTM FCF, but it remains negative. Intel is still spending more capital than its operations generate. The trailing twelve-month Return on Invested Capital is -3.4%. Every dollar of capital deployed across the business is generating a negative return.
The GeminIQ Edge: Pulling Intel's Free Cash Flow and ROIC side-by-side in GeminIQ's calculated metrics makes the gap between narrative and reality visible at a glance. The capex is declining — $23.944 Billion TTM in FY2024, down to $13.099 Billion TTM through Q1 2026 — but Intel remains FCF-negative, and the stock is up over 30% in the month after the filing that showed it.
The Balance Sheet: Carrying $45 Billion in Debt Through the Transition
Intel's balance sheet reflects the true cost of funding a simultaneous revenue recovery and fab transformation at scale.
The Data: As of March 31, 2026, Intel's long-term debt stood at $43.027 Billion, with $2.004 Billion in short-term debt — a combined $45.031 Billion in total debt. Cash and equivalents were $17.247 Billion, leaving a net debt position of approximately $27.8 Billion. Trailing twelve-month EBITDA, calculated as operating income plus depreciation and amortization with each quarter's D&A figure properly isolated to a single quarter rather than summed from cumulative year-to-date filings, comes to approximately $6.2 Billion. The implied Net Debt-to-EBITDA ratio is approximately 4.5x. For a company still generating negative free cash flow, this is a structural constraint. Total assets were $205.332 Billion, with total equity at $124.989 Billion.
The GeminIQ Edge: GeminIQ computes Net Debt directly from the as-filed balance sheet figures, without normalization. EBITDA specifically requires care here: Intel reports some quarters' depreciation and amortization as year-to-date cumulative figures rather than clean single-quarter amounts, and a naive sum across four quarters can more than double the true trailing figure if that isn't accounted for. The raw number, properly isolated to genuine quarterly amounts, is blunt regardless: Intel is carrying near-peak debt through a period of near-peak uncertainty in its transformation.
What Are the People Running Intel Doing With Their Own Money?
Insider transactions filed under SEC Form 4 are one of the few signals that financial aggregators routinely obscure through rounding or filing lag. GeminIQ pulls the raw Form 4 data directly.
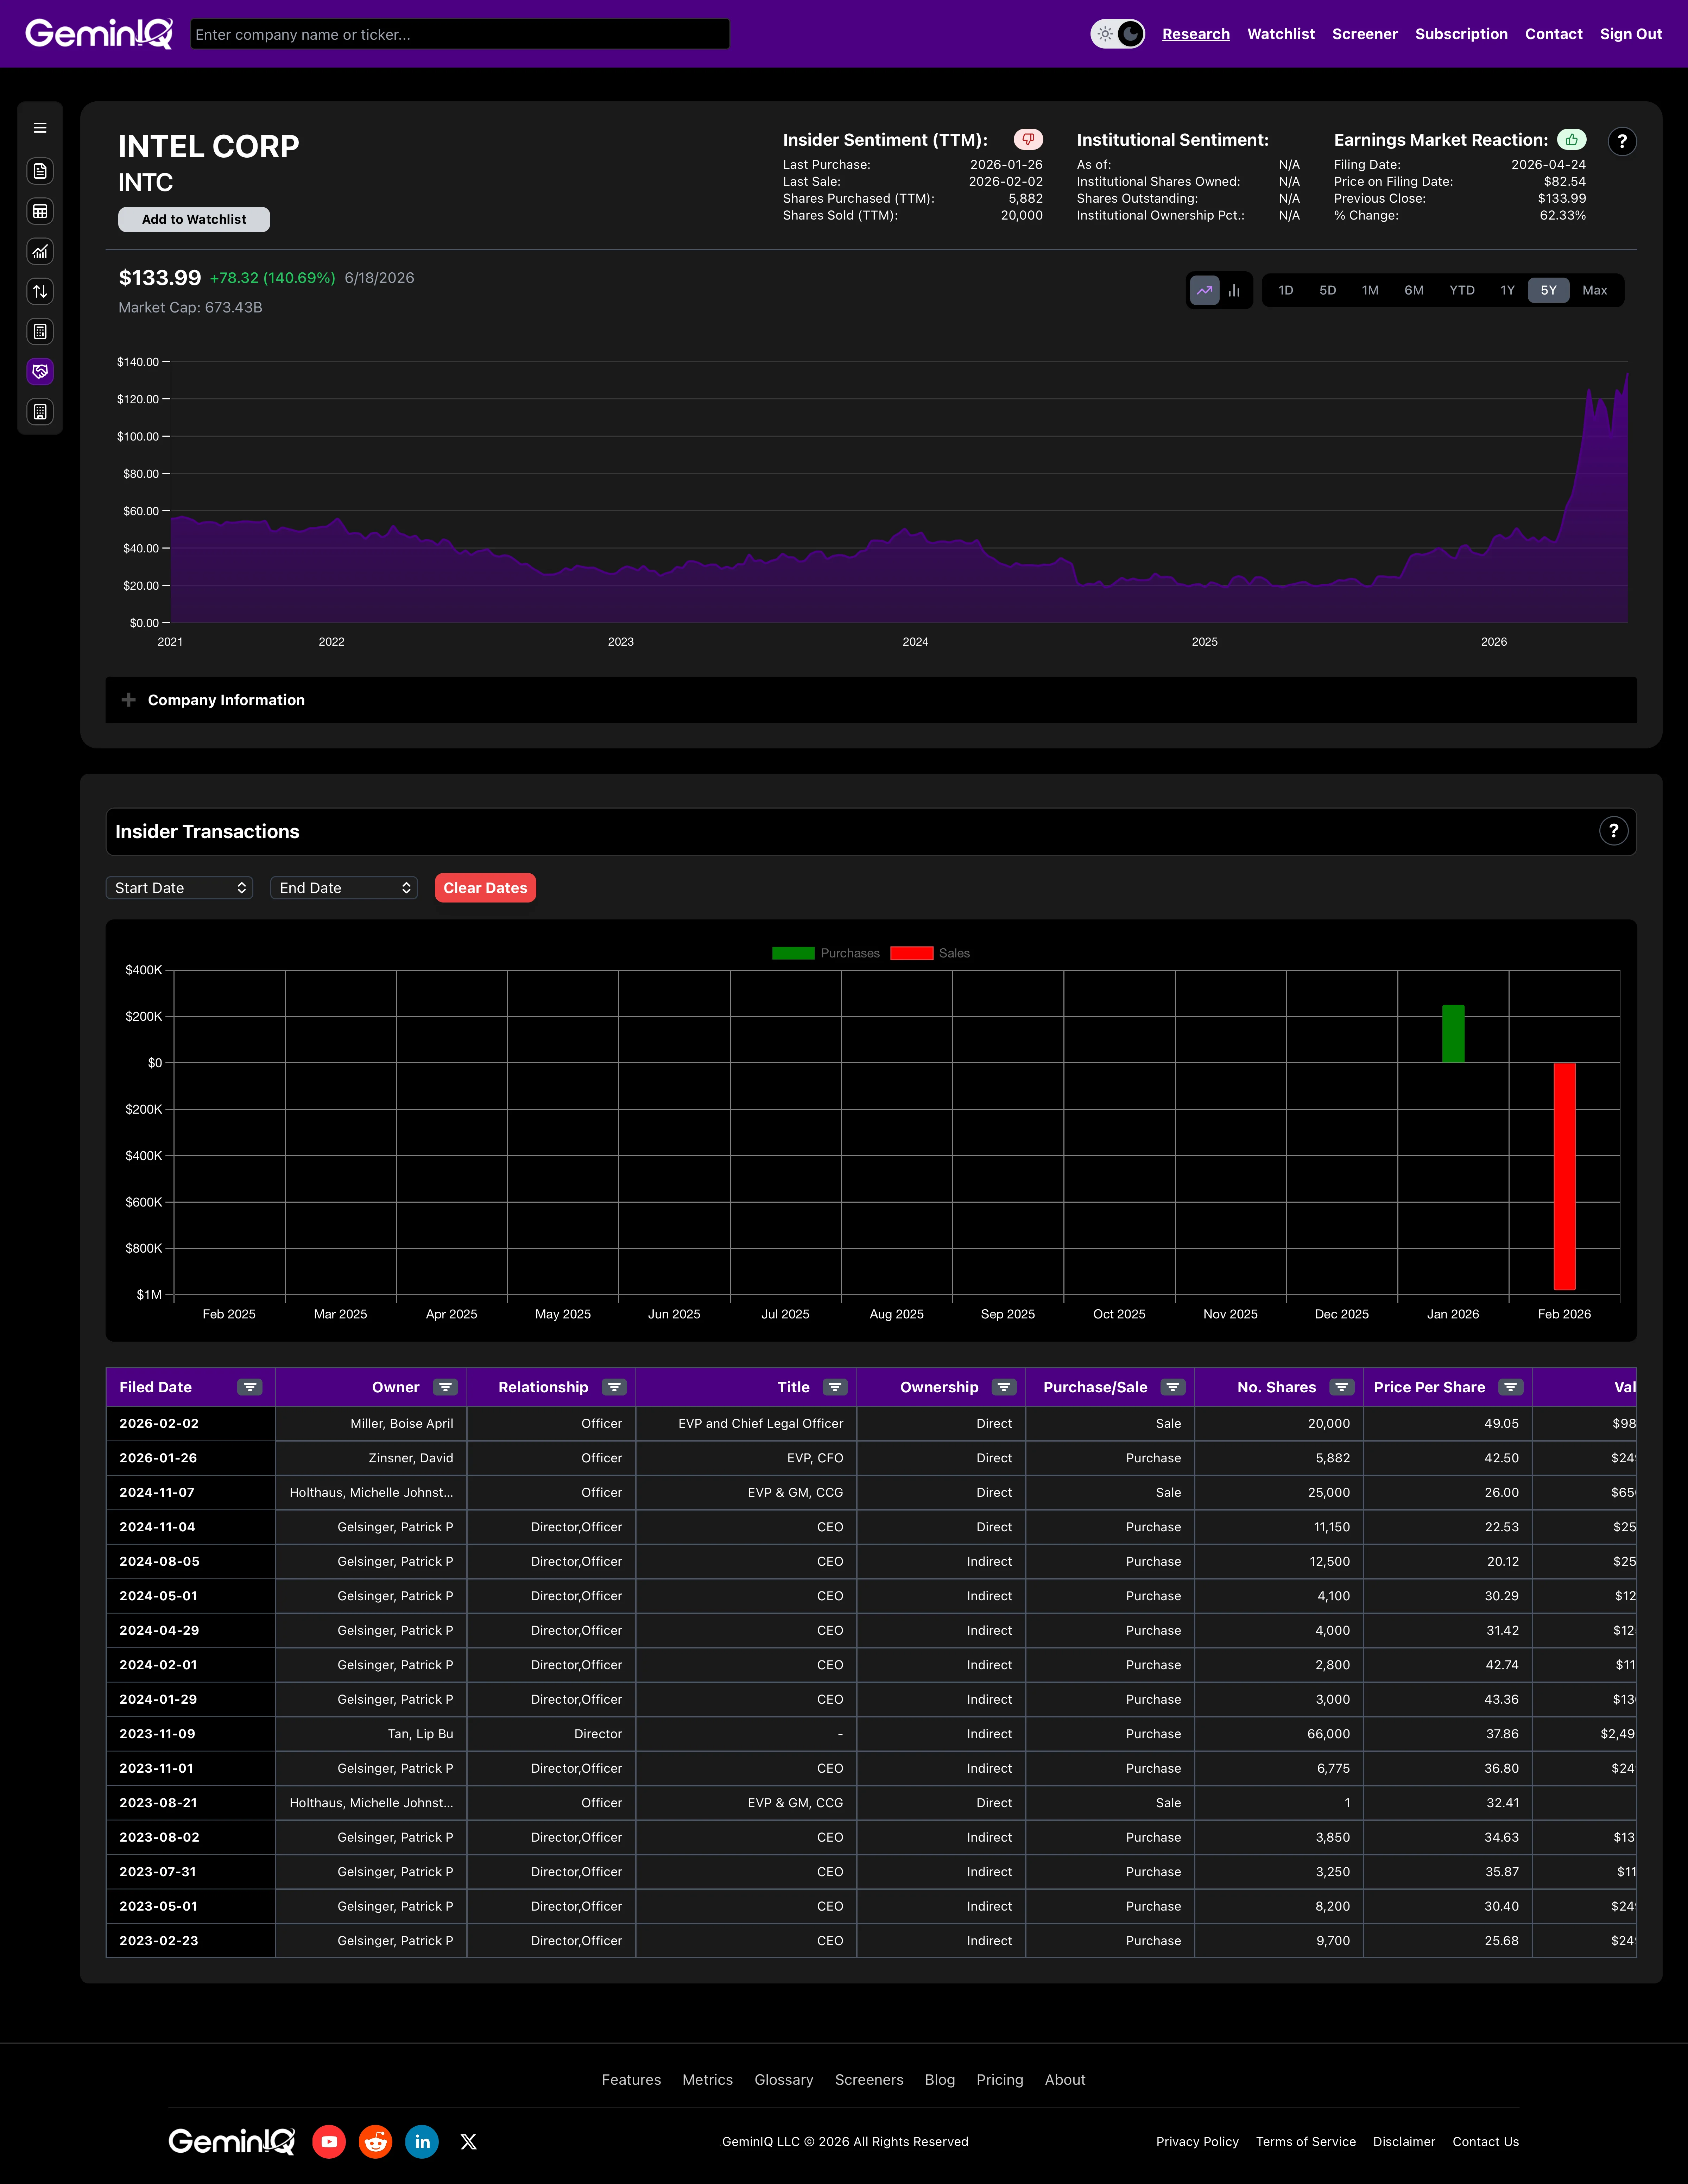
The Data: In late January 2026, CFO David Zinsner made an open-market purchase of 5,882 shares at $42.50 per share — approximately $249,985 — a directional signal from the person responsible for the balance sheet described above. A week later, EVP and Chief Legal Officer Boise April Miller sold 20,000 shares at $49.05 per share, collecting approximately $981,000 in proceeds. The CFO buying and the CLO selling within the same window was a mixed signal that a simple headline screener would miss entirely. The pattern has continued into the rally: Miller sold again on May 1, 2026, this time 40,256 shares at $99.53 — more than double her February exit price — and EVP Nagasubramaniyan Chandrasekaran sold 21,024 shares at $118.28 on May 29, 2026. No further open-market purchases by any executive appear in the record since Zinsner's January buy.
The GeminIQ Edge: GeminIQ's Insider Transactions feed surfaces these Form 4 filings alongside the share price at the time of each transaction. Tracking the pattern across the full rally, not just a single snapshot, shows two consecutive executive sales at successively higher prices as the stock climbed — a pattern more consistent with routine diversification into strength than any specific signal, but worth weighing against the CFO's earlier purchase made when the stock traded at a fraction of today's price.
The market has already priced Intel as an AI winner. The Q1 FY2026 10-Q shows a business still losing $3.7 Billion in a single quarter, writing down $4 Billion in assets, and spending more capital than it generates. The turnaround may prove real — but the income statement has not confirmed what the stock price has already assumed.
Frequently Asked Questions
How far has Intel's revenue fallen from its peak?
Intel's revenue has fallen approximately 33% from its FY2021 peak of $79.024 Billion, sitting at roughly $54.3 Billion on an annualized basis as of the Q1 FY2026 10-Q.
Is Intel's free cash flow positive?
No. As of the Q1 FY2026 10-Q, trailing twelve-month Free Cash Flow is -$3.119 Billion, an improvement from FY2024's -$15.656 Billion but still negative.
What is Intel's Net Debt-to-EBITDA ratio?
Approximately 4.5x, based on net debt of roughly $27.8 Billion against trailing twelve-month EBITDA of approximately $6.2 Billion, calculated with each quarter's depreciation and amortization isolated to a single quarter rather than summed from cumulative year-to-date filing figures.
When did Intel last file its 10-Q, and what period does it cover?
Intel's most recent filing is a Form 10-Q filed April 24, 2026, covering the fiscal quarter ended March 31, 2026 (Q1 FY2026).
Wall Street's data. Main Street's price.
Institutional terminals charge thousands a year for as-filed accuracy. GeminIQ gives you the same thing for a fraction of the cost: financials built directly from raw SEC EDGAR filings, not third-party APIs, with full XBRL traceability back to the original 10-K or 10-Q. No normalized guesswork, just calculated metrics, charts, screeners, and watchlists built on numbers exactly as the company reported them. Start researching now at GeminIQ.com.
All financial figures cited in this article reference Intel Corporation's Q1 FY2026 10-Q (filed April 24, 2026, period ending March 31, 2026). All SEC filings are publicly available at SEC EDGAR.
Disclaimer: The content in this blog is for educational and entertainment purposes only and does not constitute financial, legal, or tax advice. Investing involves risk, including the loss of principal. The views expressed are my own and not intended as financial advice or a guarantee of future performance.