
Interest Coverage Deterioration: Median Held Near 4x

By Chad Hartman
Published · Last updated
Synopsys, Inc.'s interest coverage ratio fell from 199.5x to 0.96x in two years — one of the sharpest declines in GeminIQ's entire filing universe. It looks like the higher-rate cycle's balance-sheet story in miniature: a company stretched thin by refinancing at higher cost, buckling under interest expense it could once absorb without noticing. The as-filed data tells a more specific story. Synopsys didn't get squeezed by rates — it took on acquisition debt to fund its roughly $35 billion purchase of Ansys. Its coverage ratio collapsed because a company that carried almost no debt suddenly carried a lot, not because its existing debt got more expensive.
This study reads GeminIQ's as-filed universe of trailing-twelve-month interest coverage — EBIT divided by interest expense — for companies with positive EBIT and at least $5 million in trailing interest expense, excluding financial companies. This study tracks the universe median by year from 2015 through the current filing snapshot, then ranks the sharpest three-year deteriorations among companies with over $2 billion in trailing revenue that were healthy (coverage above 3x) three years earlier.
The Pattern
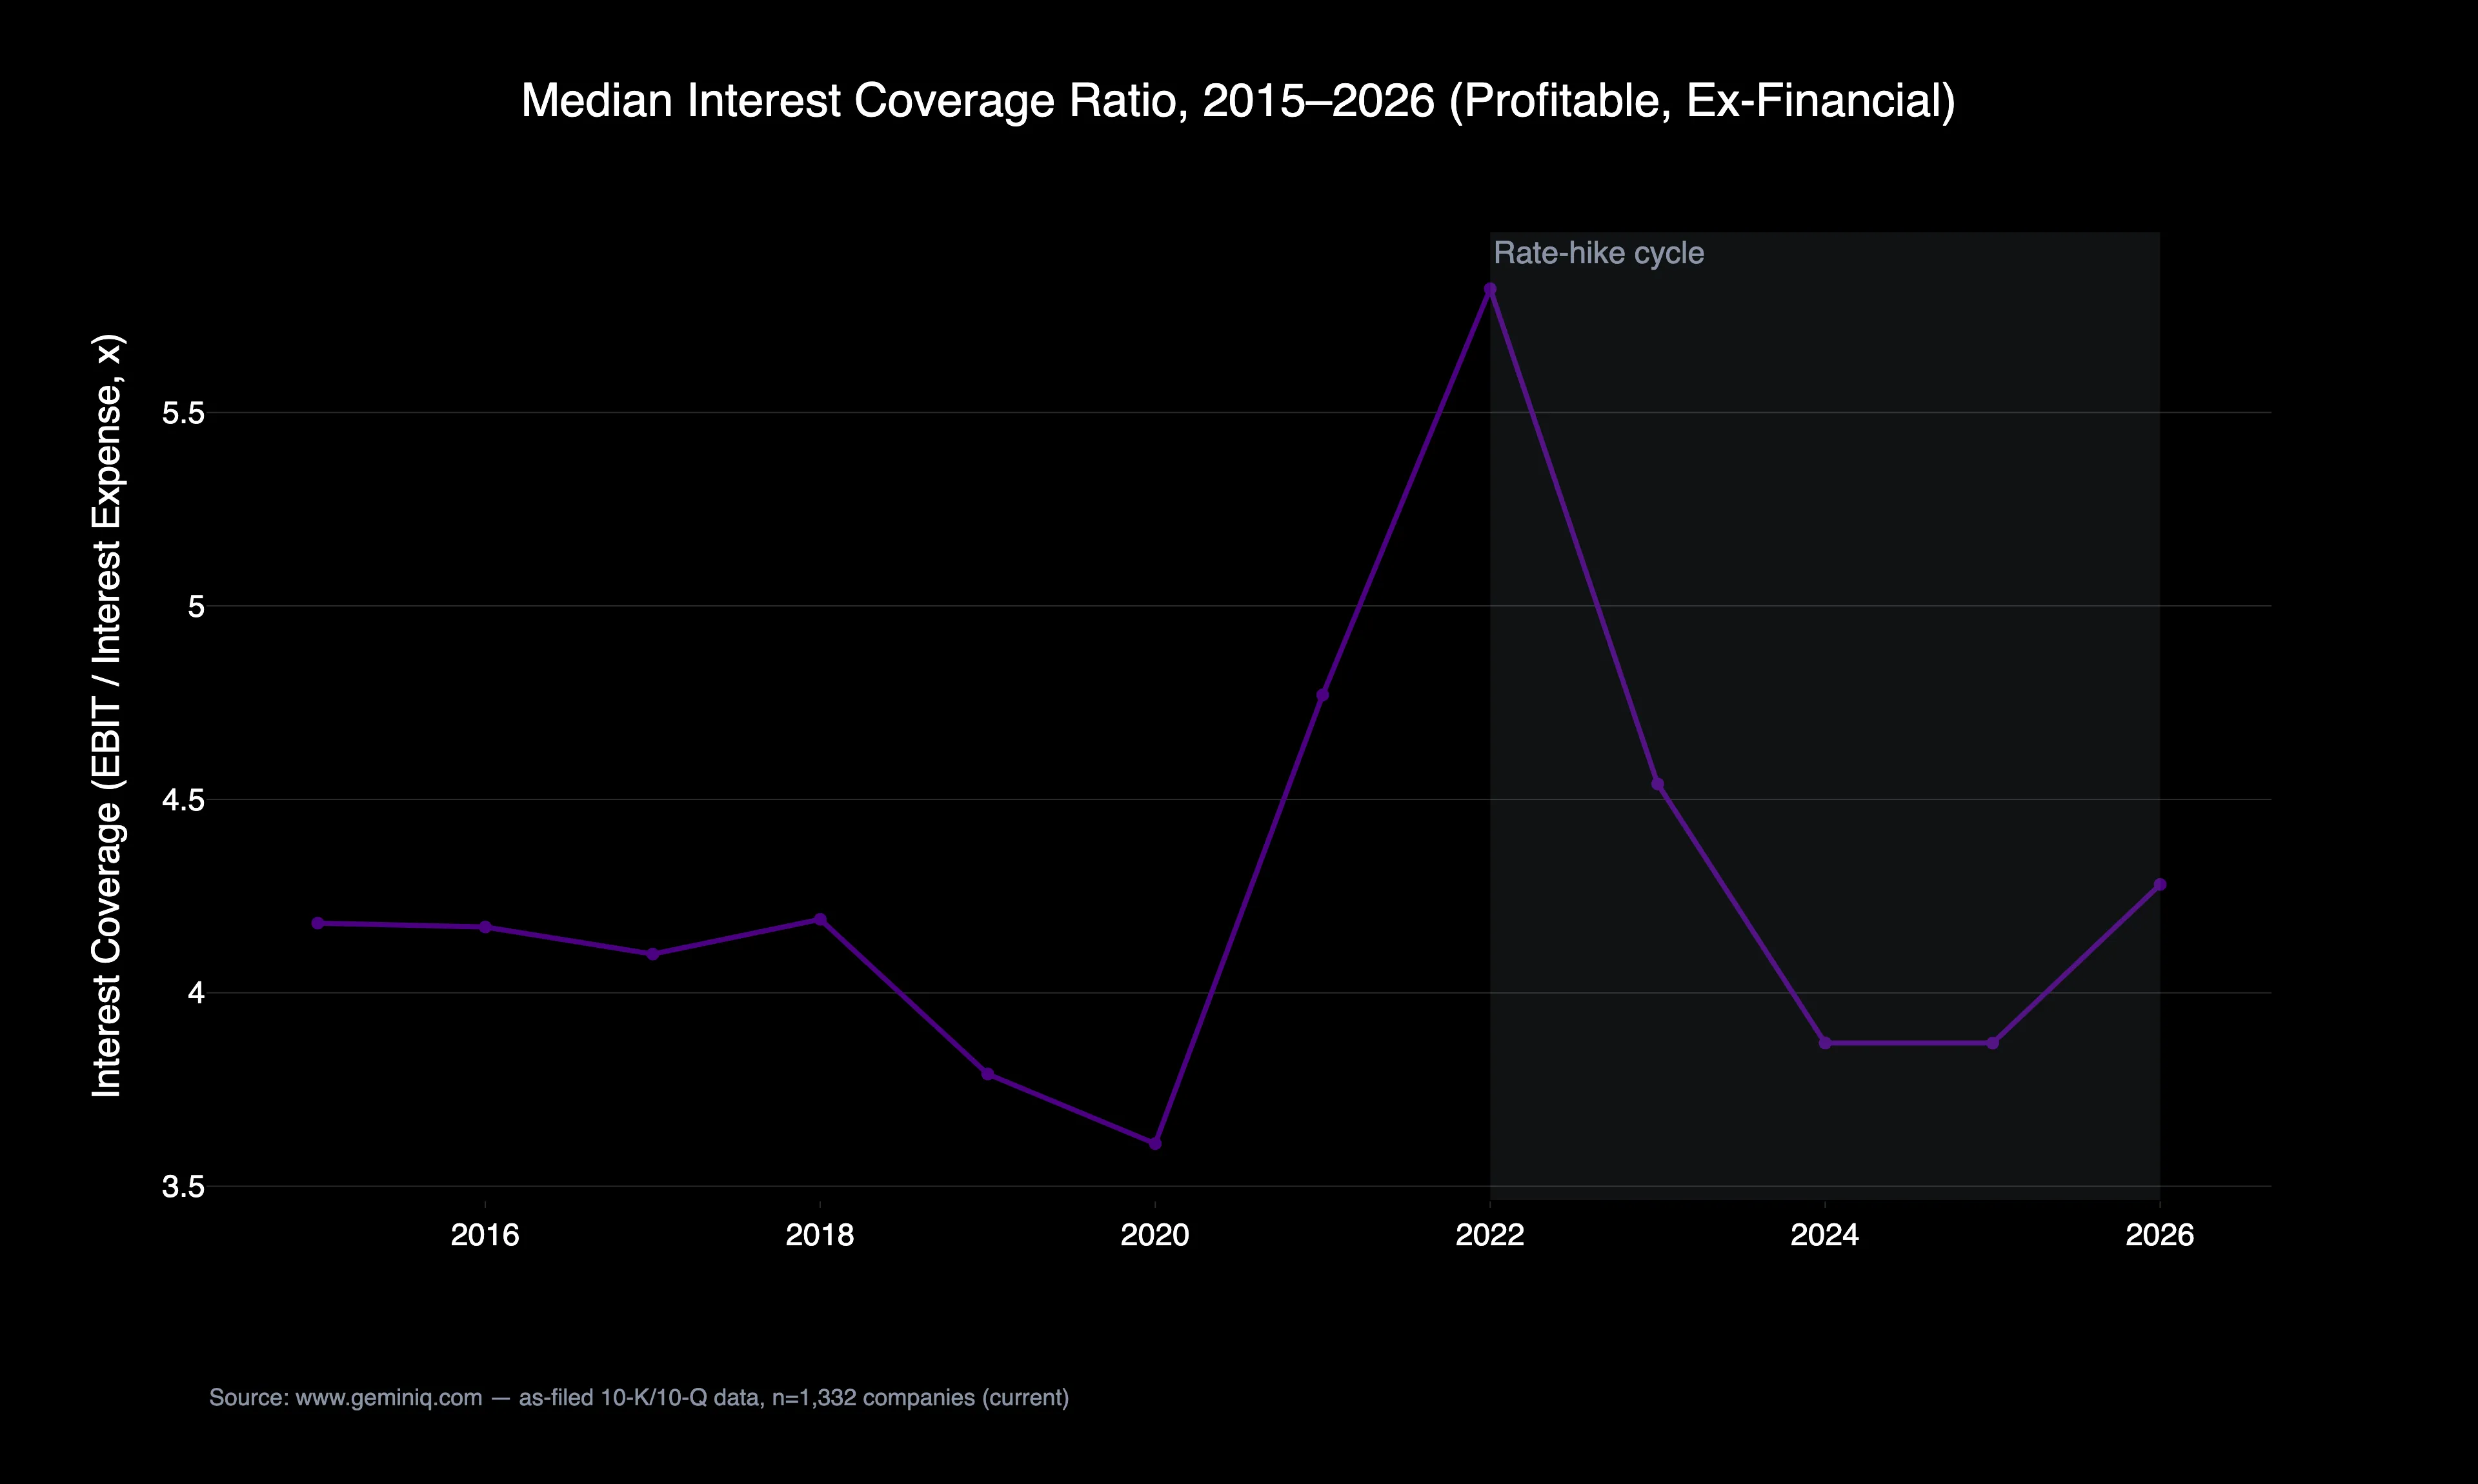
The assumption around the higher-rate cycle is broad balance-sheet stress: rates went up, interest expense went up, coverage ratios came down across the board. The as-filed data does not support that as a universe-wide story. The median interest coverage ratio for profitable, ex-financial companies sat at 4.18x in 2015 and dipped modestly through the pandemic years. It actually peaked at 5.82x in 2022 — the first full year of the hiking cycle — before settling back to 4.28x in the current snapshot, essentially unchanged from a decade ago. Most companies termed out their debt at fixed rates before the hiking cycle began, and that decision shows up directly in the numbers: the median company's coverage never meaningfully cracked.
The Data
| Year | Median Interest Coverage (Profitable, Ex-Financial) |
|---|---|
| 2015 | 4.18x |
| 2018 | 4.19x |
| 2020 | 3.61x |
| 2021 | 4.77x |
| 2022 | 5.82x |
| 2023 | 4.54x |
| 2024 | 3.87x |
| 2025 | 3.87x |
| 2026 | 4.28x |
The median obscures real dispersion at the current snapshot. Among the 1,332 companies meeting this study's criteria today, the 25th percentile sits at just 1.93x, and 348 companies — 26.1% of the universe — currently run coverage below 2x. A thin-coverage minority exists and is worth screening for individually; it simply isn't a new, rate-driven phenomenon showing up in the aggregate trend.
The Extremes: M&A Debt, Not Rate Resets
Synopsys's collapse from 199.5x to 0.96x and Accenture's drop from 213.2x to 39.8x share the same mechanism: both moved from a near-debt-free capital structure to a leveraged one inside a two-to-three-year window. In Synopsys's case, the timing lines up directly with its Ansys acquisition. Neither company's existing debt got more expensive — both added new debt on top of a base that previously had almost none, which mechanically crushes a coverage ratio regardless of the rate environment. That distinction matters for anyone screening on interest coverage trend alone: a sharp decline from an extremely high starting point is frequently an acquisition-financing story, not a distress signal. The two look identical on a bare ratio without checking the debt levels underneath.
Chevron and ExxonMobil also appear among the largest three-year drops, both falling from coverage ratios above 80x to still-comfortable levels in the 20x–52x range. Even a large percentage decline can land somewhere entirely healthy when the starting point was that extreme.
The Method
Interest coverage is GeminIQ's trailing-twelve-months EBIT divided by trailing-twelve-months interest expense, drawn from as-filed data via GeminIQ's Interest Coverage Ratio metric. GeminIQ computes the yearly median across companies with positive EBIT and at least $5 million in trailing interest expense, excluding financial companies, for each calendar year 2015–2026. The deterioration ranking compares each company's most recent reading (within the last 15 months) against its own reading roughly three years earlier. It is restricted to companies with over $2 billion in trailing revenue that started from a coverage ratio above 3x. Full methodology is covered in How GeminIQ Builds Filing Data Studies.
Check Your Holdings
Pull up any leveraged position's interest coverage trend on GeminIQ, and before assuming a decline reflects rate pressure, check whether total debt actually grew over the same window. A coverage ratio that fell because debt increased tells a very different story than one that fell because interest expense on the same debt load simply got more expensive. Every reader can run that same check directly against GeminIQ's as-filed data.
Frequently Asked Questions
Did the higher-rate environment broadly hurt interest coverage?
Not at the universe level, in GeminIQ's data. The median interest coverage ratio for profitable, ex-financial companies sat at 4.18x in 2015 and 4.28x in the current snapshot — essentially unchanged over a decade that included a full rate-hiking cycle. Most companies termed out debt at fixed rates before rates rose.
What is causing the sharpest declines in interest coverage?
Acquisition-financed debt, more often than rate resets. Synopsys's coverage ratio fell from 199.5x to 0.96x in two years, timed to its roughly $35 billion Ansys acquisition — new debt added on top of a nearly debt-free base, not existing debt becoming more expensive.
What counts as a low interest coverage ratio?
In GeminIQ's current snapshot, the 25th percentile among profitable, ex-financial companies with meaningful interest expense sits at 1.93x, and 26.1% of that universe currently runs coverage below 2x.
How is interest coverage calculated?
Interest coverage is trailing-twelve-months EBIT divided by trailing-twelve-months interest expense, available on GeminIQ as the Interest Coverage Ratio metric.
Wall Street's data. Main Street's price.
Institutional terminals charge thousands a year for as-filed accuracy. GeminIQ gives you the same thing for a fraction of the cost: financials built directly from raw SEC EDGAR filings, not third-party APIs, with full XBRL traceability back to the original 10-K or 10-Q. No normalized guesswork, just calculated metrics, charts, screeners, and watchlists built on numbers exactly as the company reported them. Start researching now at GeminIQ.com.
All figures are drawn from each company's as-filed 10-K and 10-Q filings, publicly available on SEC EDGAR. The yearly median and deterioration ranking are computed from GeminIQ's Interest Coverage Ratio metric across the described universe and snapshot window.
Disclaimer: The content in this blog is for educational and entertainment purposes only and does not constitute financial, legal, or tax advice. Investing involves risk, including the loss of principal. The views expressed are my own and not intended as financial advice or a guarantee of future performance.