
Negative Cash Conversion Cycle: 76 Companies Run One

By Chad Hartman
Published · Last updated
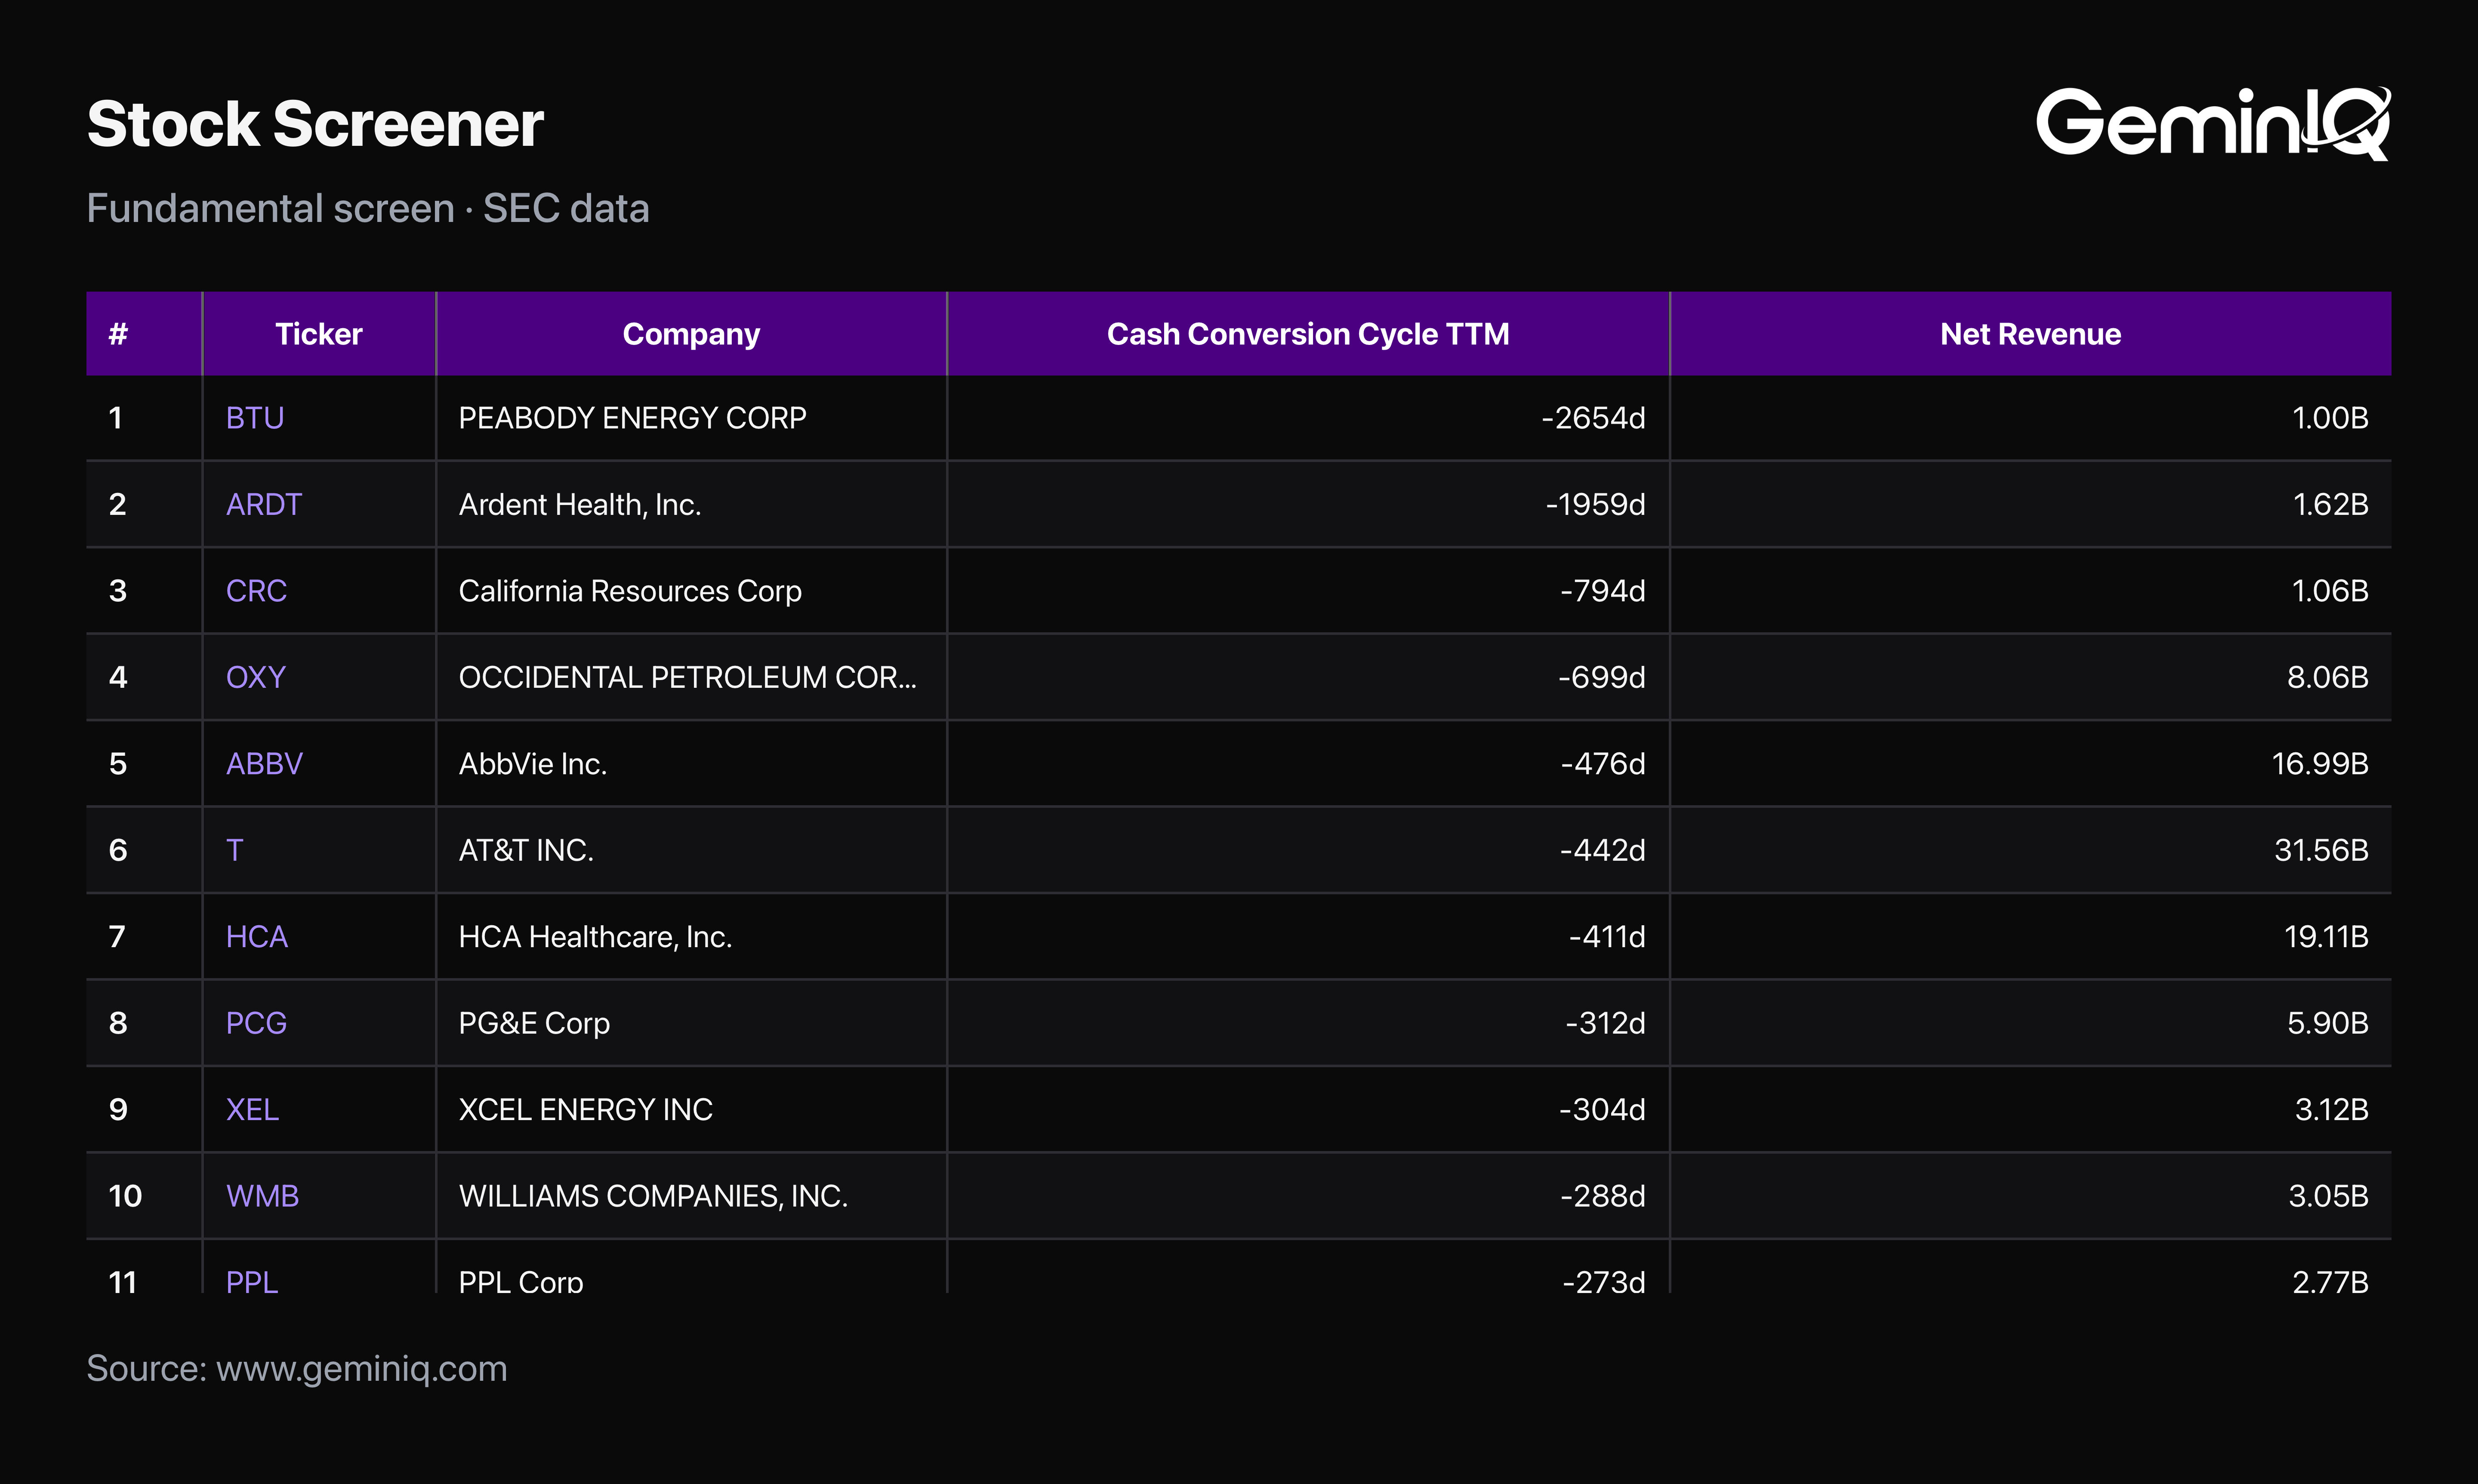
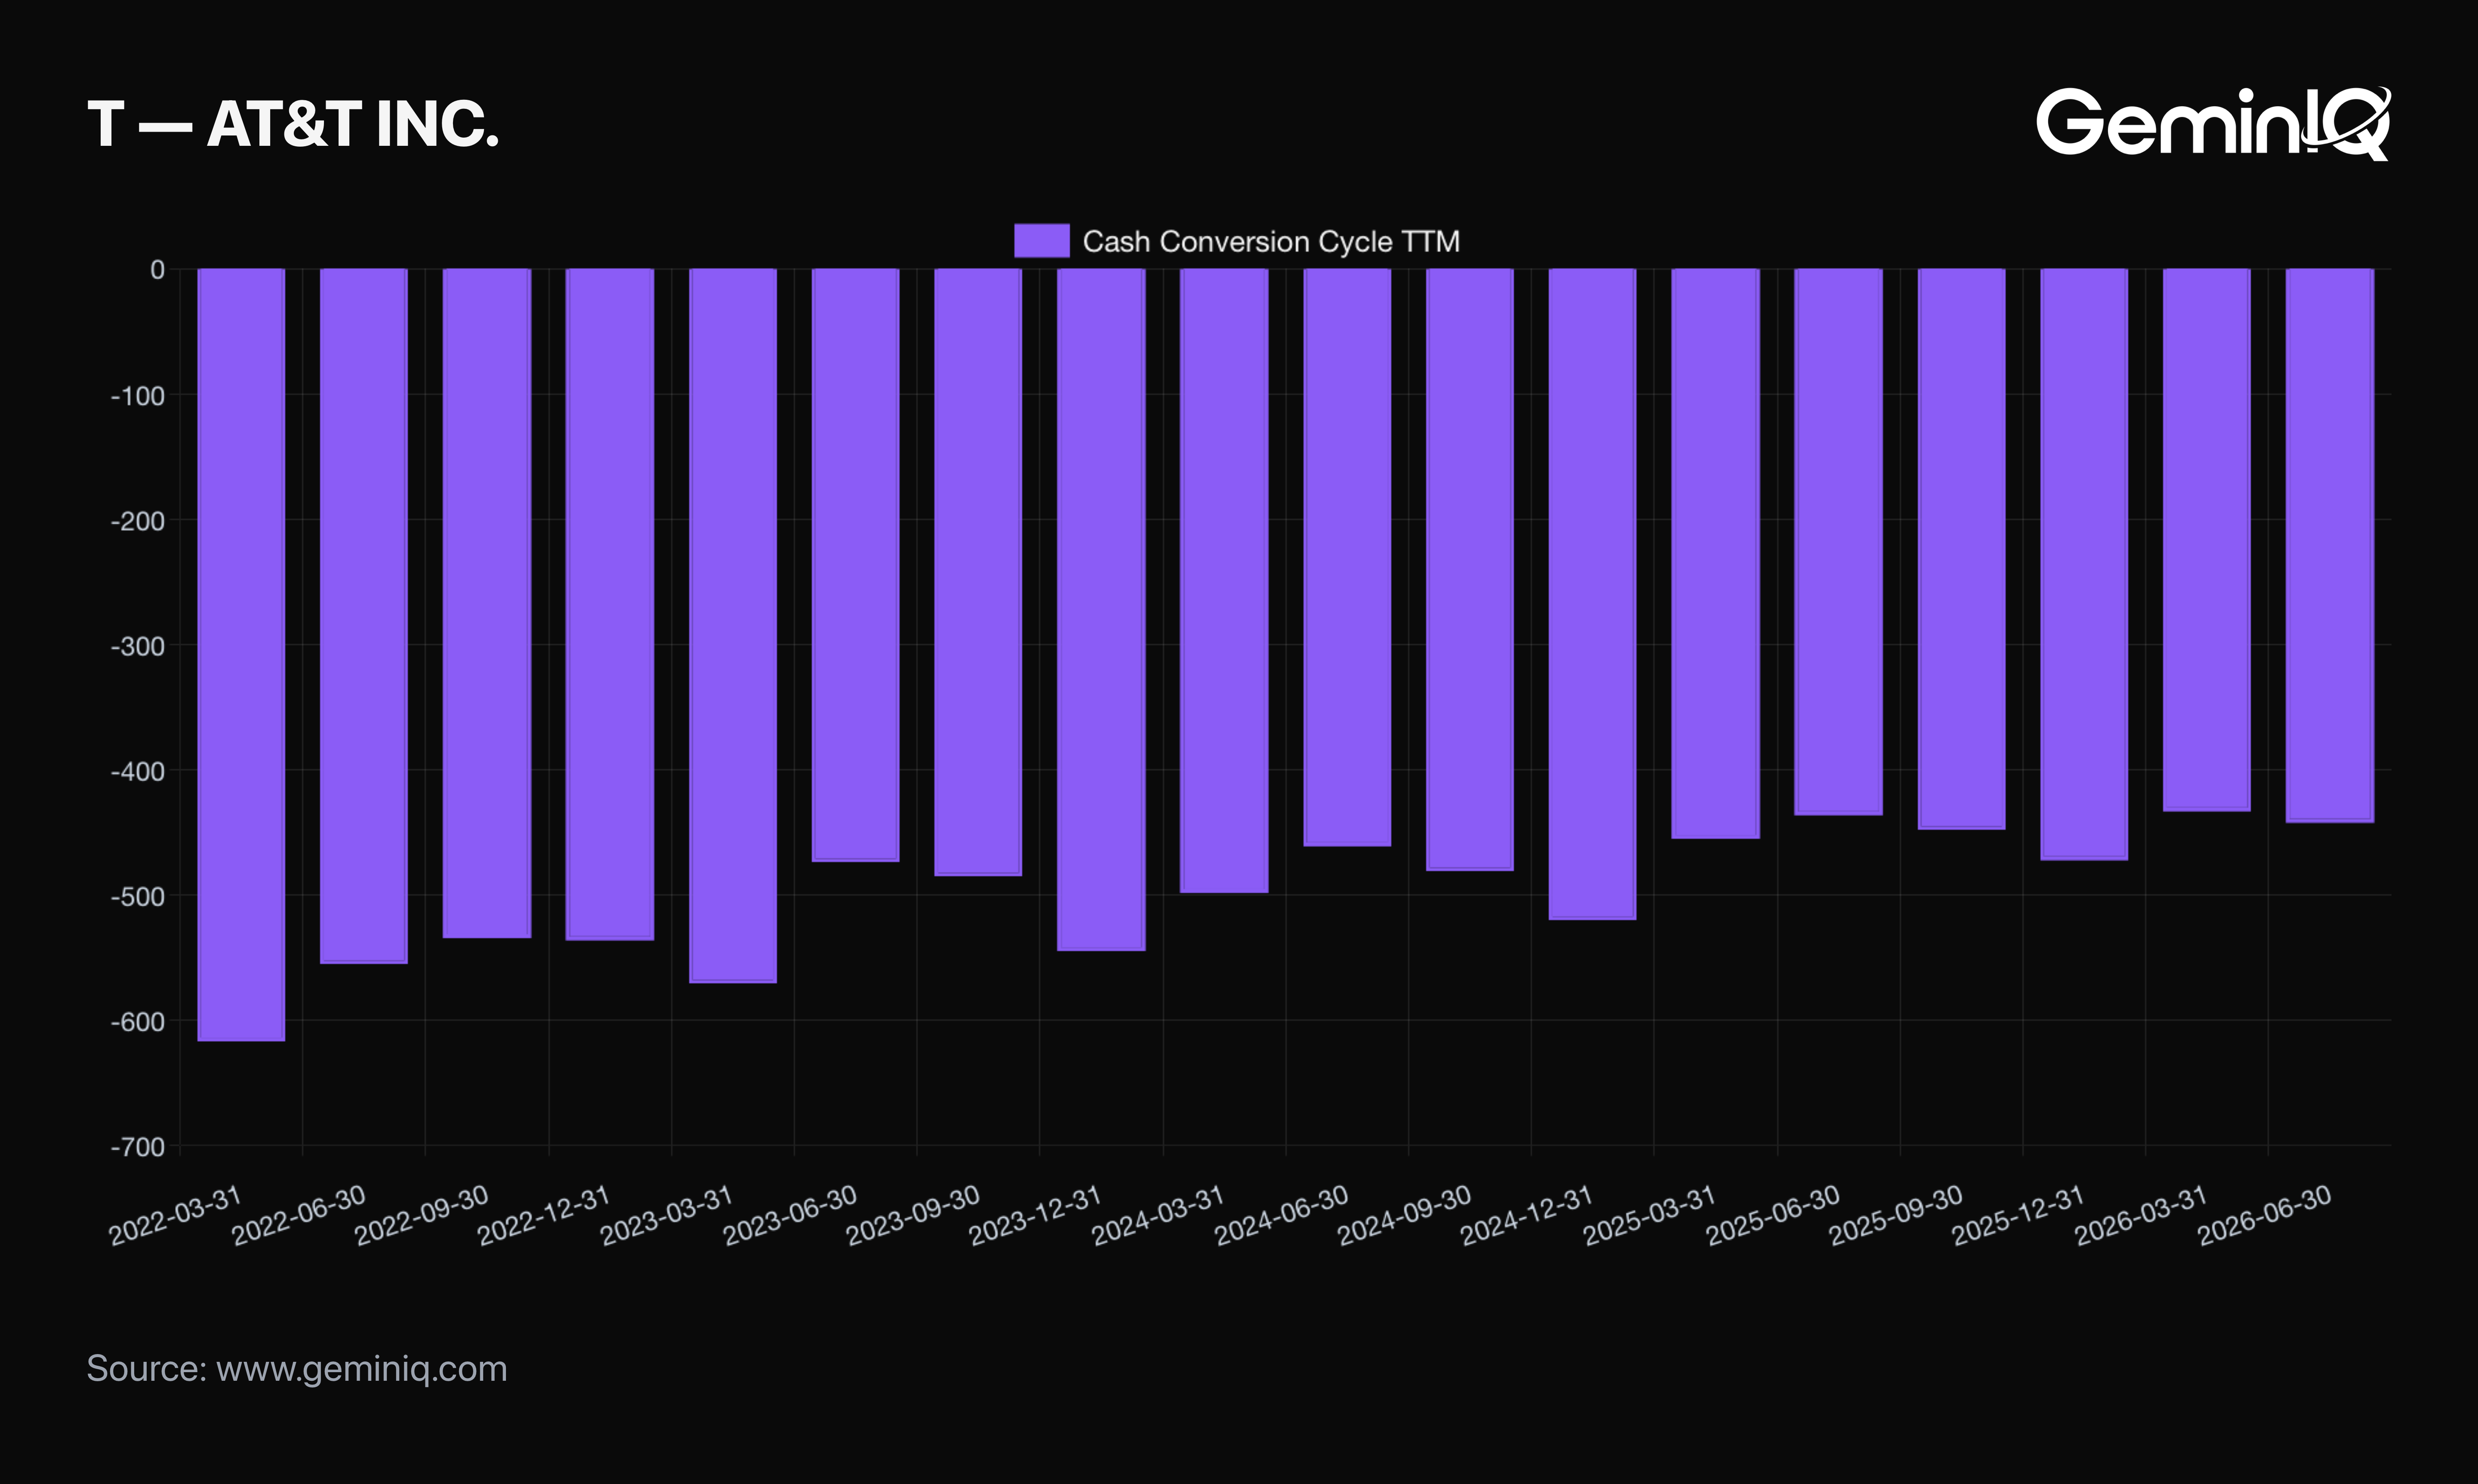
AT&T runs a cash conversion cycle of -442 days. That means AT&T collects cash from its own customers well before it has to pay its suppliers, who are effectively financing over a year of the company's operations in the meantime. That's a structural advantage that has nothing to do with margin or growth, and everything to do with negotiating leverage and billing structure. It is not the most extreme case on this list, but it is one of the largest companies running the pattern, and the as-filed data shows exactly who else does it and why.
This study reads GeminIQ's as-filed universe as of the most recent trailing-twelve-month filing period, restricted to companies with at least $1 billion in trailing revenue and a cost-of-revenue figure large enough to compute a reliable ratio. Cash Conversion Cycle is GeminIQ's Cash Conversion Cycle metric — days sales outstanding plus days inventory outstanding, minus days payables outstanding — computed directly from as-filed receivables, inventory, payables, revenue, and cost of revenue. 76 companies in that universe currently run a negative cycle within a plausible range; the table below ranks the twenty largest by magnitude.
The Pattern
A negative cash conversion cycle is the mechanical opposite of how most businesses are taught to think about working capital. Instead of tying up cash in inventory and receivables while waiting to collect, the company is effectively using its suppliers' money to fund operations. Three distinct mechanisms produce it, and they show up as three distinct clusters in the ranking. Telecom and utility billing collects on a cycle shorter than supplier payment terms. Consumer-staples brands carry enough negotiating leverage to extend payables well past their own inventory turns, and marketplace or e-commerce models collect from the customer at the moment of sale while paying the supplier weeks later. None of the three is a signal of financial distress; all three are structural features of how the business is built.
The Data
| Rank | Company | Ticker | Sector | Cash Conversion Cycle | Revenue (TTM) |
|---|---|---|---|---|---|
| 1 | AbbVie Inc. | ABBV | Manufacturing | -476 days | $64.4B |
| 2 | AT&T Inc. | T | Telecom | -442 days | $127.2B |
| 3 | Pitney Bowes Inc. | PBI | Manufacturing | -375 days | $1.9B |
| 4 | Coca-Cola Co | KO | Manufacturing | -175 days | $49.3B |
| 5 | Verizon Communications Inc. | VZ | Telecom | -163 days | $138.9B |
| 6 | Coty Inc. | COTY | Manufacturing | -147 days | $5.8B |
| 7 | BrightSpring Health Services | BTSG | Services | -131 days | $14.4B |
| 8 | Synopsys Inc. | SNPS | Services | -121 days | $8.7B |
| 9 | Phibro Animal Health Corp | PAHC | Manufacturing | -119 days | $1.5B |
| 10 | PepsiCo Inc. | PEP | Manufacturing | -100 days | $97.1B |
| 11 | Clorox Co | CLX | Manufacturing | -75 days | $6.8B |
| 12 | Ralph Lauren Corp | RL | Manufacturing | -72 days | $8.4B |
| 13 | Designer Brands Inc. | DBI | Retail Trade | -72 days | $2.9B |
| 14 | NXP Semiconductors N.V. | NXPI | Manufacturing | -67 days | $12.6B |
| 15 | American Electric Power Co | AEP | Utilities | -63 days | $22.4B |
| 16 | Air Products & Chemicals Inc. | APD | Manufacturing | -59 days | $12.6B |
| 17 | Coupang, Inc. | CPNG | Retail Trade | -56 days | $35.5B |
| 18 | Snap-on Inc | SNA | Manufacturing | -52 days | $5.3B |
| 19 | Apple Inc. | AAPL | Manufacturing | -51 days | $466.8B |
| 20 | O'Reilly Automotive Inc | ORLY | Retail Trade | -50 days | $18.6B |
AT&T and Verizon: Billing Ahead of Paying
Both telecoms bill customers on recurring cycles — often with prepaid or auto-pay components — while extending payment terms to equipment vendors and network contractors that run well past the collection window. AT&T's -442 days and Verizon's -163 days sit in the same family, and the size of the gap between the two is itself informative. AT&T's more negative figure reflects a heavier mix of prepaid and equipment-financed billing relative to Verizon's, even though both are running the same underlying mechanism at nine-figure revenue scale.
Coca-Cola, PepsiCo, and Clorox: Supplier Leverage, Not Distress
Coca-Cola and PepsiCo are the cleanest illustration of the second mechanism. Neither company is short on cash or slow to collect from bottlers and retailers. The negative cycle comes entirely from the payables side, where decades of brand leverage let both companies negotiate supplier payment terms far longer than their own inventory and receivable turns require. A -175 day or -100 day cash conversion cycle at this kind of scale is a direct, filed measure of negotiating power that a margin figure alone would never show.
Amazon and the Marketplace Mechanism
Amazon narrowly missed the top twenty at -45 days, but it is the textbook case for the third mechanism: a retailer that collects from the customer at checkout and pays the supplier on standard trade terms weeks later. That timing gap finances a meaningful share of its own inventory float with other people's money. O'Reilly Automotive, at -50 days, runs the same marketplace-adjacent logic inside physical auto parts retail — fast-turning inventory paired with extended supplier terms.
Apple, at -51 days, is the case most investors already associate with negative working capital, and the filings show it holds at nearly half a trillion dollars in revenue — proof the mechanism scales without breaking.
The Method
Every figure above is GeminIQ's Cash Conversion Cycle metric — trailing-twelve-months days sales outstanding plus days inventory outstanding, minus days payables outstanding. GeminIQ computes it from as-filed revenue, cost of revenue, receivables, inventory, and payables for each company's most recent filing period within the last fifteen months. The ranking excludes companies whose cost-of-revenue figure is too small relative to revenue to produce a reliable ratio, since a near-zero denominator can distort the underlying turnover math without reflecting a real operating pattern. Full methodology is covered in How GeminIQ Builds Filing Data Studies.
Check Your Holdings
Pull up any position's Cash Conversion Cycle on GeminIQ and check the sign. A negative number is not automatically bullish, and a positive one is not automatically bearish. The question worth asking is which of the three mechanisms above is producing it, and whether that mechanism is a durable structural feature of the business or a temporary artifact of one unusual quarter. Every reader can run that check directly against GeminIQ's as-filed data for their own holdings.
Frequently Asked Questions
What does a negative cash conversion cycle mean?
It means a company collects cash from its customers before it has to pay its own suppliers, so suppliers effectively finance part of its operations. GeminIQ computes it as days sales outstanding plus days inventory outstanding, minus days payables outstanding.
Is a negative cash conversion cycle good or bad?
Not automatically either. Telecom and utility billing, consumer-staples supplier leverage, and marketplace models all produce one, and none of those is a signal of distress. The useful question is which mechanism is behind the number and whether it is a durable feature of the business.
Which companies have a negative cash conversion cycle?
76 companies with at least $1 billion in trailing revenue currently run one within a plausible range. The largest by magnitude are AbbVie at -476 days, AT&T at -442 days, and Pitney Bowes at -375 days; Coca-Cola, Verizon, PepsiCo, and Apple also appear in the top twenty.
How many days negative is the largest company on the list?
AbbVie leads the ranking at -476 days. Among the largest companies by revenue, AT&T runs -442 days on $127.2 billion in trailing revenue and Apple runs -51 days on $466.8 billion.
Wall Street's data. Main Street's price.
Institutional terminals charge thousands a year for as-filed accuracy. GeminIQ gives you the same thing for a fraction of the cost: financials built directly from raw SEC EDGAR filings, not third-party APIs, with full XBRL traceability back to the original 10-K or 10-Q. No normalized guesswork, just calculated metrics, charts, screeners, and watchlists built on numbers exactly as the company reported them. Start researching now at GeminIQ.com.
All figures are drawn from each company's as-filed 10-K and 10-Q filings, publicly available on SEC EDGAR. Rankings are computed from GeminIQ's Cash Conversion Cycle metric across the described universe and snapshot window.
Disclaimer: The content in this blog is for educational and entertainment purposes only and does not constitute financial, legal, or tax advice. Investing involves risk, including the loss of principal. The views expressed are my own and not intended as financial advice or a guarantee of future performance.