
Retail Sector Stock Analysis: Returns Are Fading

By Chad Hartman
Published · Last updated
Home improvement and farm-retail names screen as steady compounders on the surface. Home Depot (HD), Lowe's (LOW), and Tractor Supply Company (TSCO) all grew trailing-twelve-month revenue between 2.2% and 6.2% through their most recent quarterly filings, and none of the three shows any sign of a demand problem.
Look past revenue and a different, shared trend shows up. Home Depot's Q1 FY2026 10-Q (filed May 27, 2026, period ending May 3, 2026) shows Return on Invested Capital at 24.70%, down from 58.06% five years ago. Tractor Supply's fell from 47.56% to 25.30% over the same window. Lowe's path was choppier but still sits well below its own 2022 peak. This isn't one company's story. It's the sector's.
The harder question is how to compare the three cleanly, because two of them no longer have an equity base clean enough for half the standard ratio toolkit to mean anything. Using a GeminIQ Custom Watchlist to pull every quarter of Calculated Metrics for Home Depot, Lowe's, and Tractor Supply back to 2021, here's where all three actually stand, and how they got there.
| Company | ROIC (TTM) | Net Debt-to-EBITDA (TTM) | Altman Z-Score |
|---|---|---|---|
| Home Depot (HD) | 24.70% | 2.14x | 5.50 |
| Lowe's (LOW) | 31.82% | 2.96x | 3.26 |
| Tractor Supply (TSCO) | 25.30% | 0.92x | 4.33 |
Phase 1: The Shared ROIC Erosion
None of the three retailers is compounding capital better than it was five years ago. Home Depot's Return on Invested Capital has fallen in nearly every year since 2021: 58.06%, 47.57%, 43.60%, 37.68%, 31.59%, and 24.70% now, cut by more than half. Tractor Supply's path is nearly as steep: 47.56% down to 25.30%. Lowe's peaked at 46.42% in 2022 before sliding to 31.82% now, still the highest of the three in absolute terms but well off its own high.
The market hasn't priced this consistently. Home Depot's Price-to-Earnings Ratio climbed from 20.62x in 2021 to 23.15x now, a richer multiple attached to a ROIC less than half what it used to be. Tractor Supply's multiple actually peaked at 26.39x in 2025 and has pulled back to 21.87x this year, the one name where the price has started catching up to the trend. Lowe's ended higher too, 18.68x to 19.98x, but choppier in between.
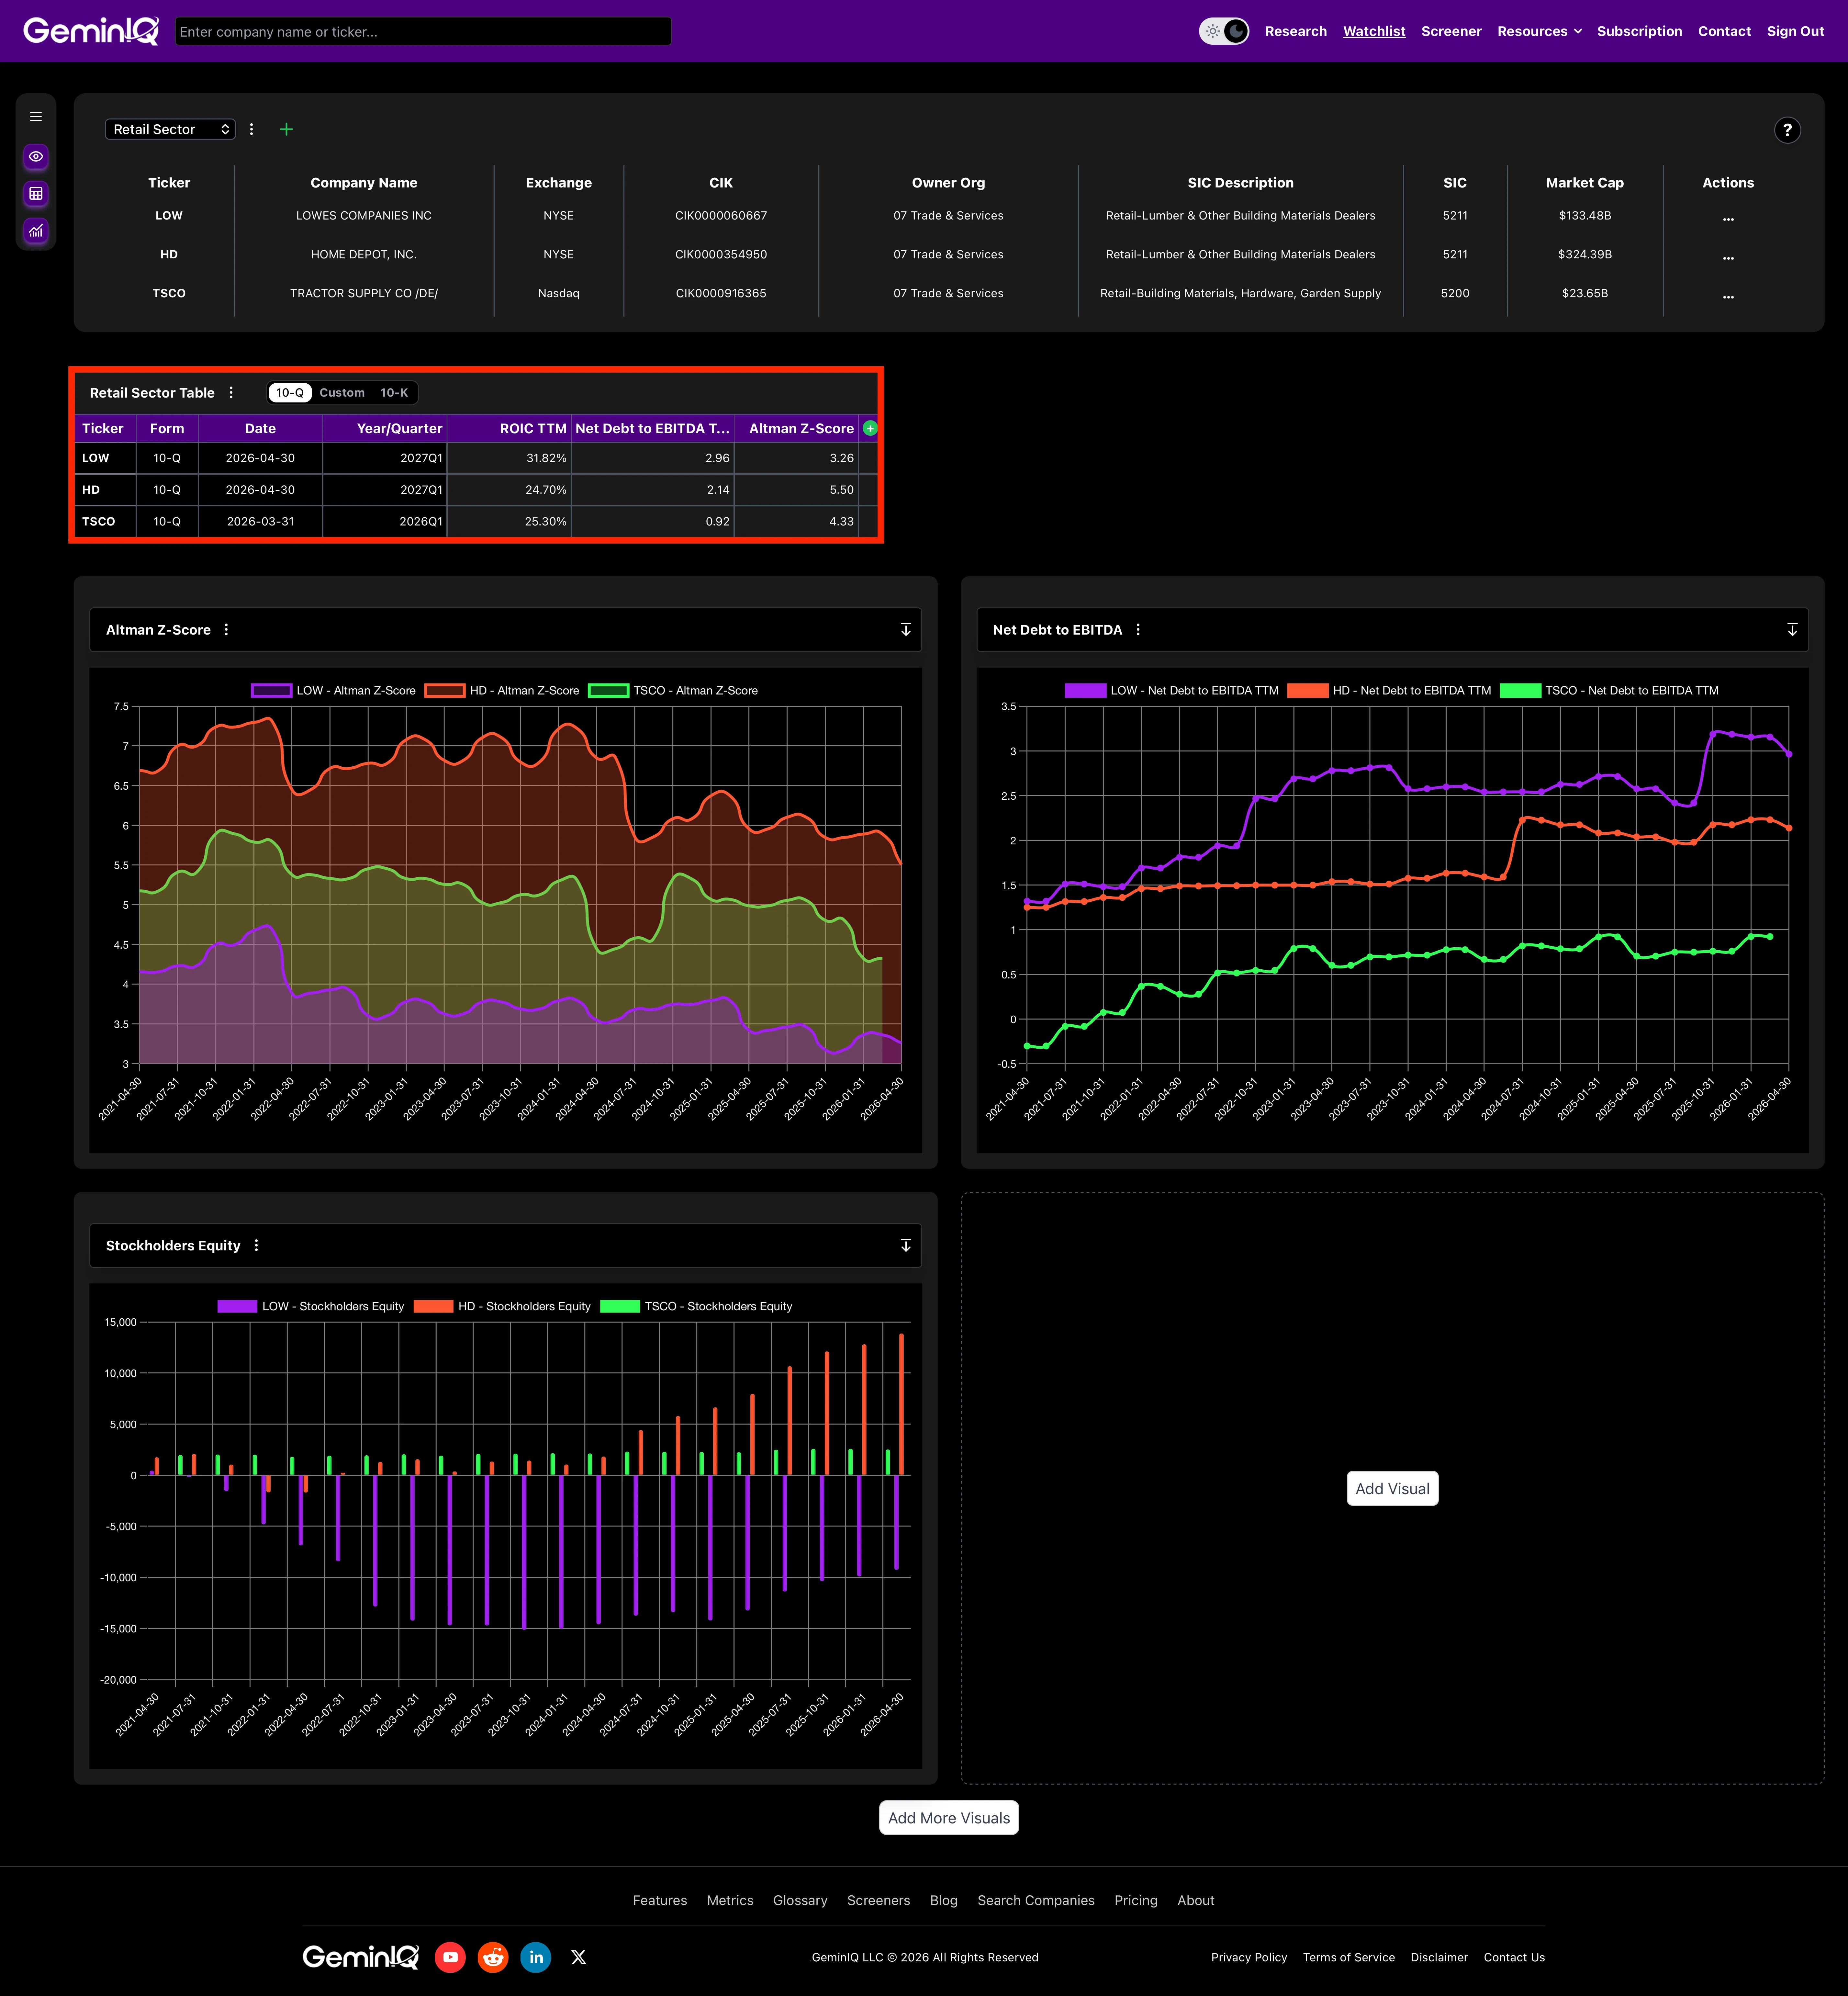 GeminIQ Calculated Metrics comparison showing Return on Invested Capital, Net Debt-to-EBITDA, and Altman Z-Score for Home Depot, Lowe's, and Tractor Supply as of each company's most recent quarter.
Phase 2: Why Half the Toolkit Doesn't Work Here
A shrinking Return on Invested Capital should show up in Return on Equity and Debt-to-Equity too. For two of these three names, it can't, because the equity in the denominator has stopped behaving like a normal number.
Home Depot's equity swung negative in 2022 (-$1.71 Billion) before recovering to a still-thin $13.87 Billion now, against $107.90 Billion in total assets. The effect on Return on Equity is exactly what you'd expect from a denominator bouncing near zero: -1,695% in 2021, an absurd 84,713% in 2022 when equity briefly cratered, -2,487% the year after, then 128% now. Lowe's equity has been negative every year since 2022 and remains negative today at -$9.27 Billion, against $64.21 Billion in total liabilities and only $54.94 Billion in assets. Lowe's own balance sheet doesn't call this section "equity" anymore. Its cover page labels it "Shareholders' Deficit."
Tractor Supply is the exception. Its equity has stayed solidly positive throughout, growing from $1.85 Billion in 2021 to $2.51 Billion now, which is why its own Return on Equity and Debt-to-Equity Ratio still behave like normal numbers (currently 45.50% and 3.64) instead of swinging wildly or flipping sign. That's the reason this comparison leans on ROIC and Net Debt-to-EBITDA throughout: neither one requires a sane, positive equity figure to still mean something.
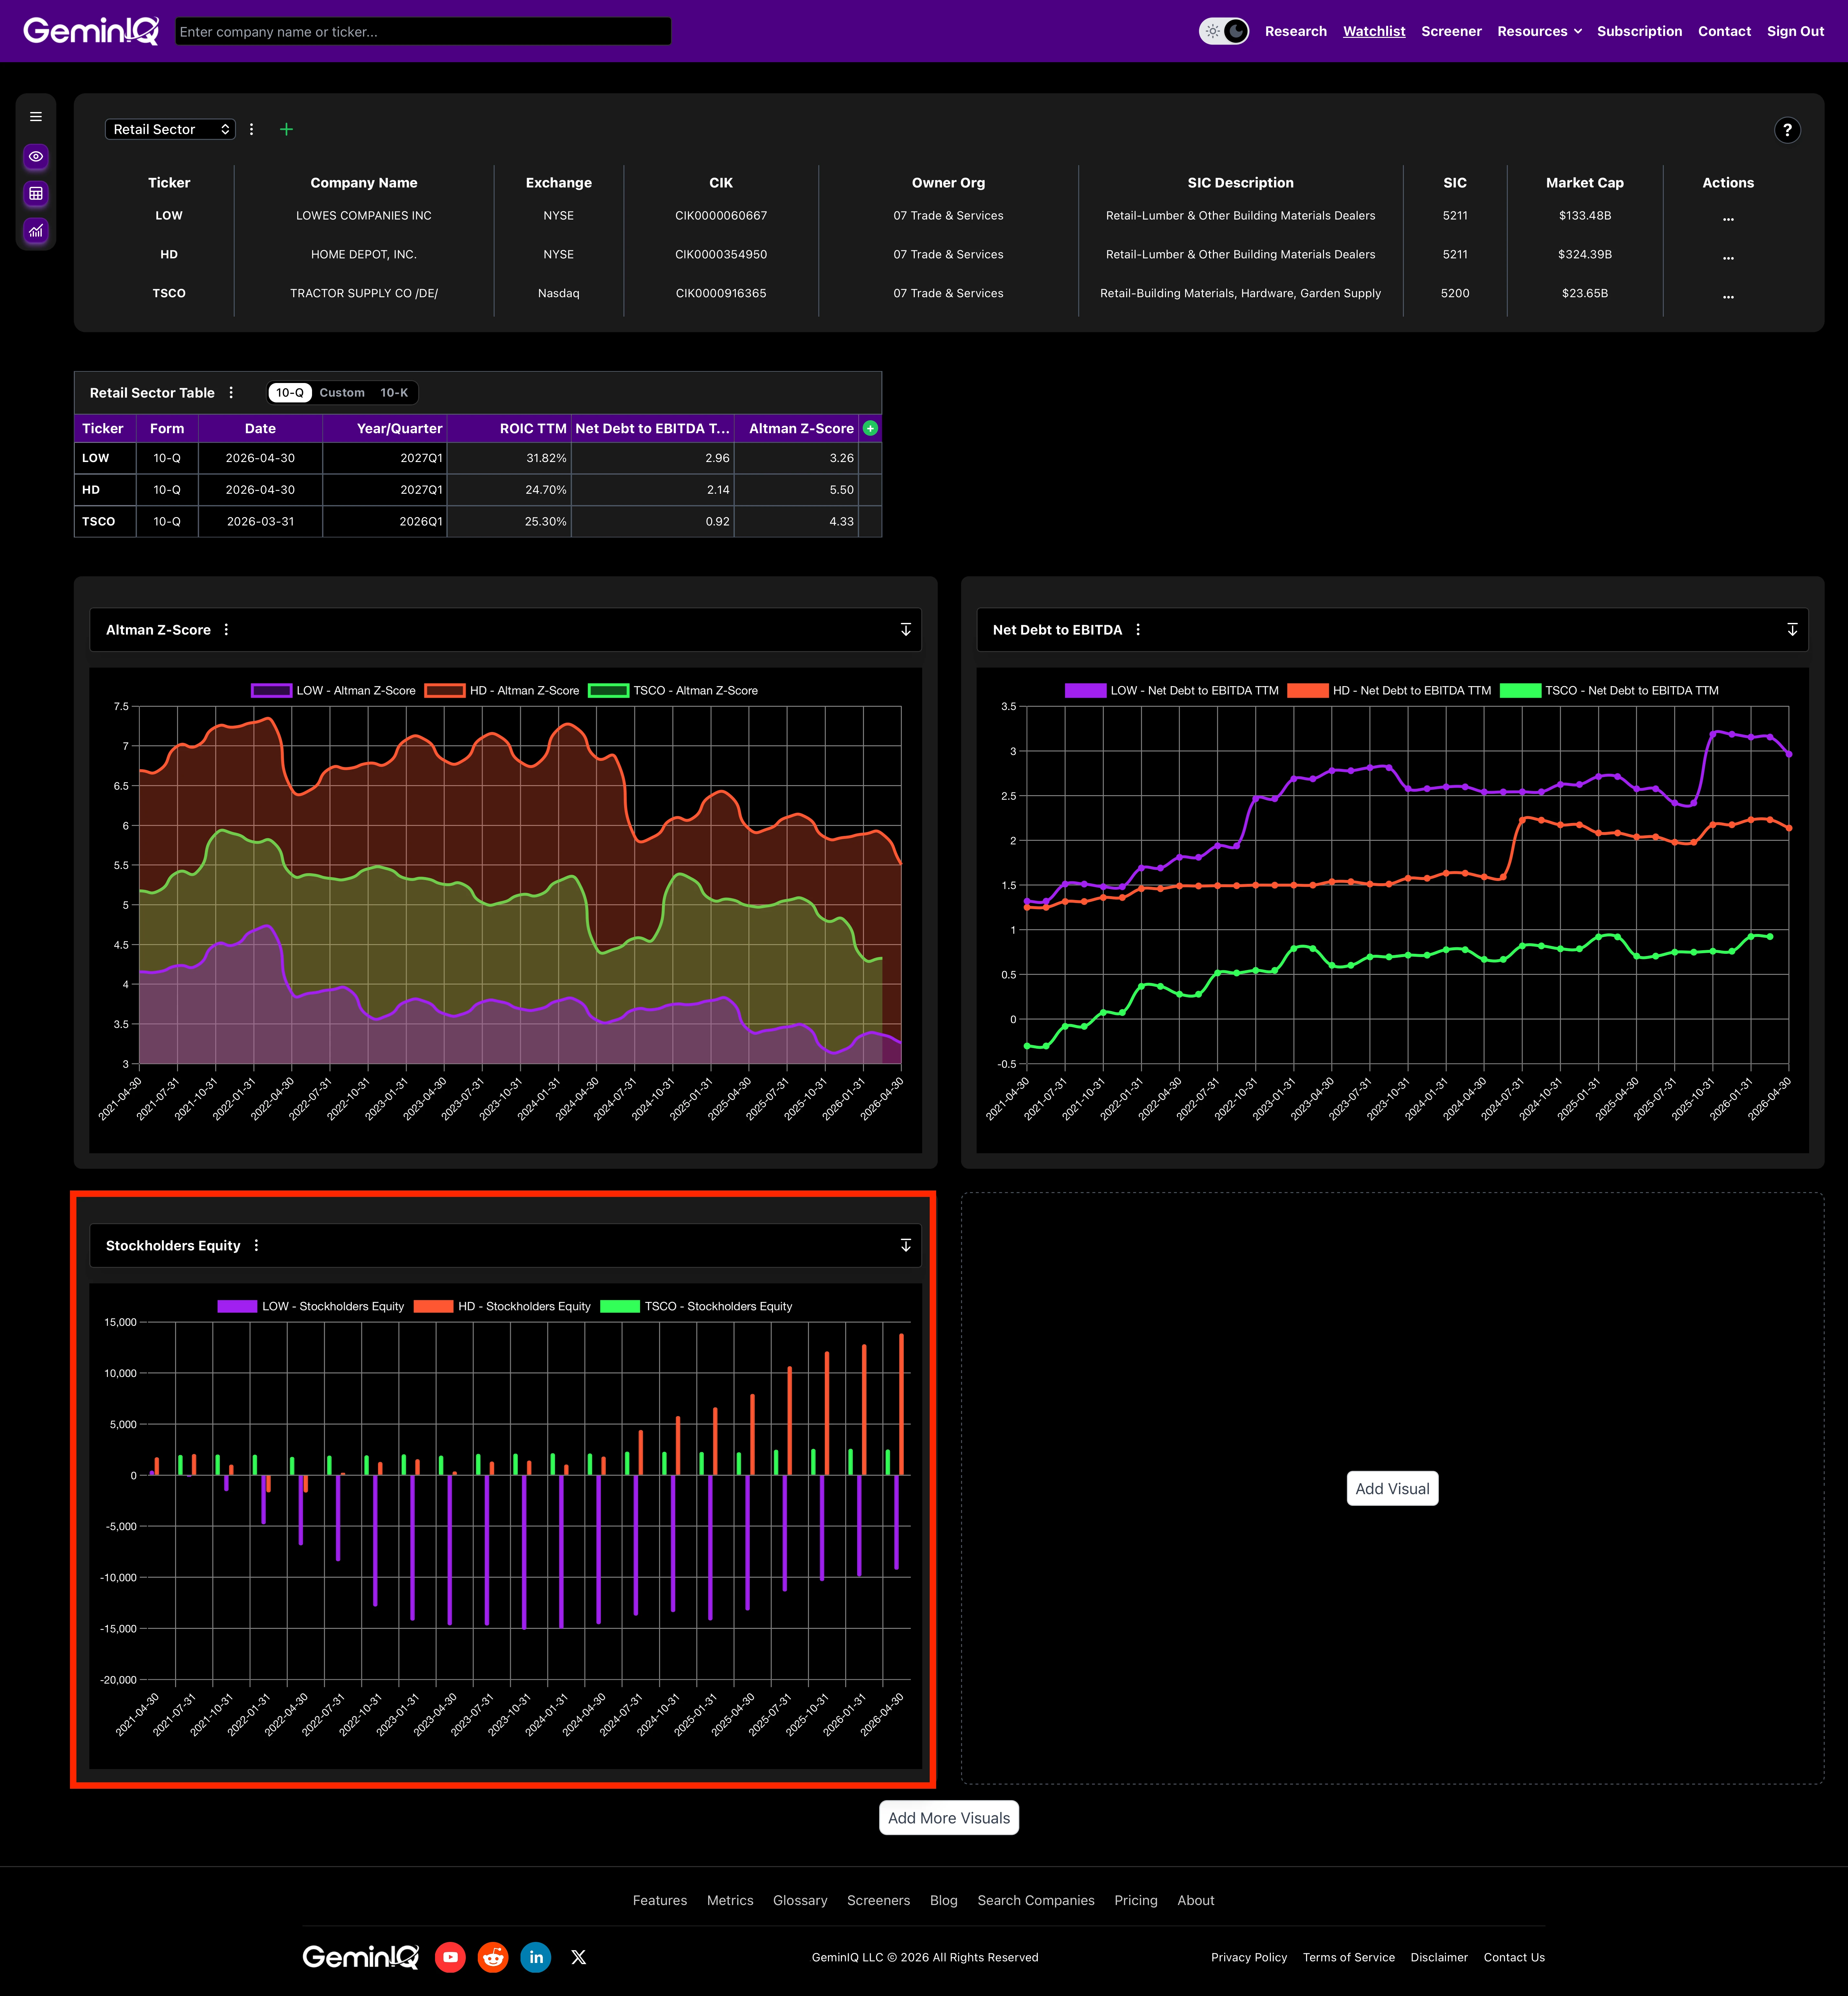 GeminIQ Financial Statements view of the Balance Sheet for Home Depot and Lowe's, showing Total Stockholders Equity of $13.87 Billion and negative $9.27 Billion respectively, against Tractor Supply's positive $2.51 Billion.
Phase 3: The Leverage Creep
Capital efficiency fading is one half of the picture. The other half is that all three are carrying more debt relative to their own cash flow than they were five years ago, not less.
Home Depot's Net Debt-to-EBITDA rose from 1.25x in 2021 to 2.14x now. Lowe's rose further, from 1.32x to 2.96x, the highest reading of the three and the worst point in its own six-year window. Tractor Supply started this period in a net cash position (-0.12x in 2021) and has moved to modest net debt, 0.92x now. Still the lowest of the three by a wide margin, but the direction of travel matches its peers.
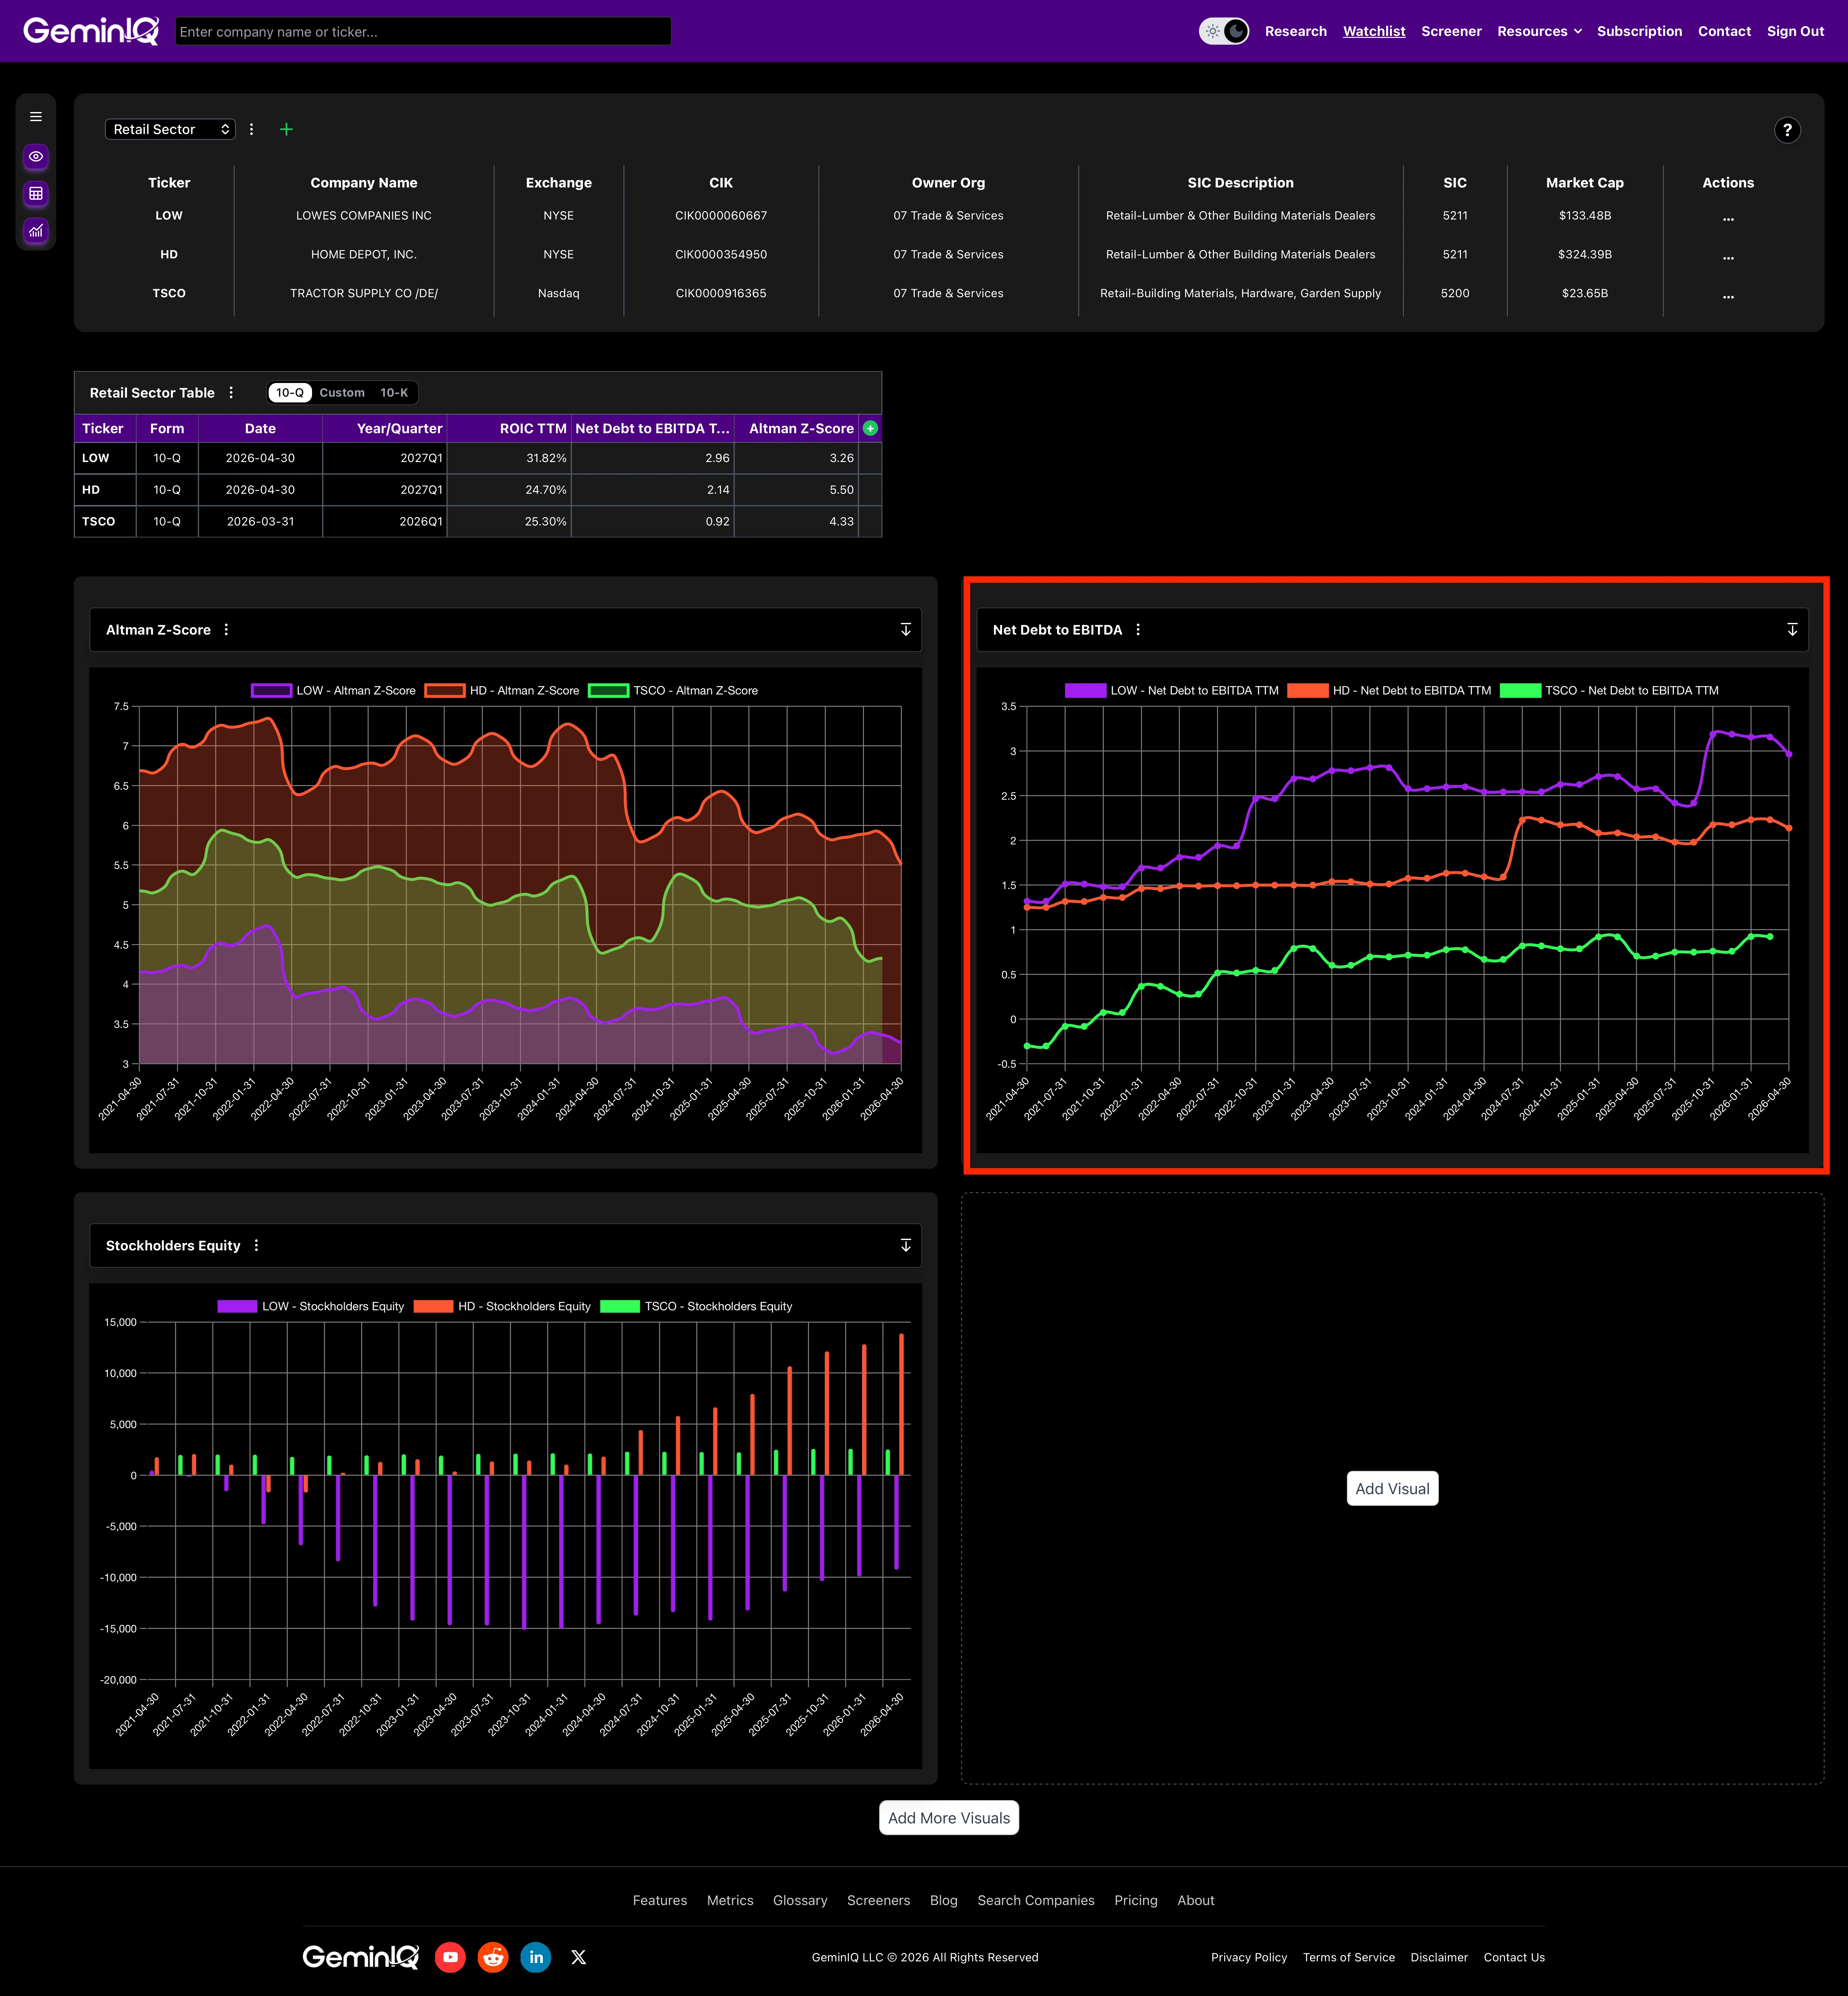 GeminIQ Visualizations chart plotting quarterly Net Debt-to-EBITDA for Home Depot, Lowe's, and Tractor Supply from 2021 through Q1 FY2026, showing all three trending higher over the window.
Phase 4: The Altman Z-Score Trend
All three retailers remain comfortably in the Altman Z-Score's "safe zone" above 2.99. None of them is a distress case. But none of them is getting safer, either.
Home Depot's score fell from 6.69 in 2021 to 5.50 now, still the highest of the three but down from a 2024 peak of 6.85. Lowe's declined every single year, from 4.15 to 3.26, the closest of the three to the gray-zone threshold. Tractor Supply's score held in the low-5s for years before a sharp drop in the most recent twelve months, from 5.07 to 4.33, the steepest single-year move of the three.
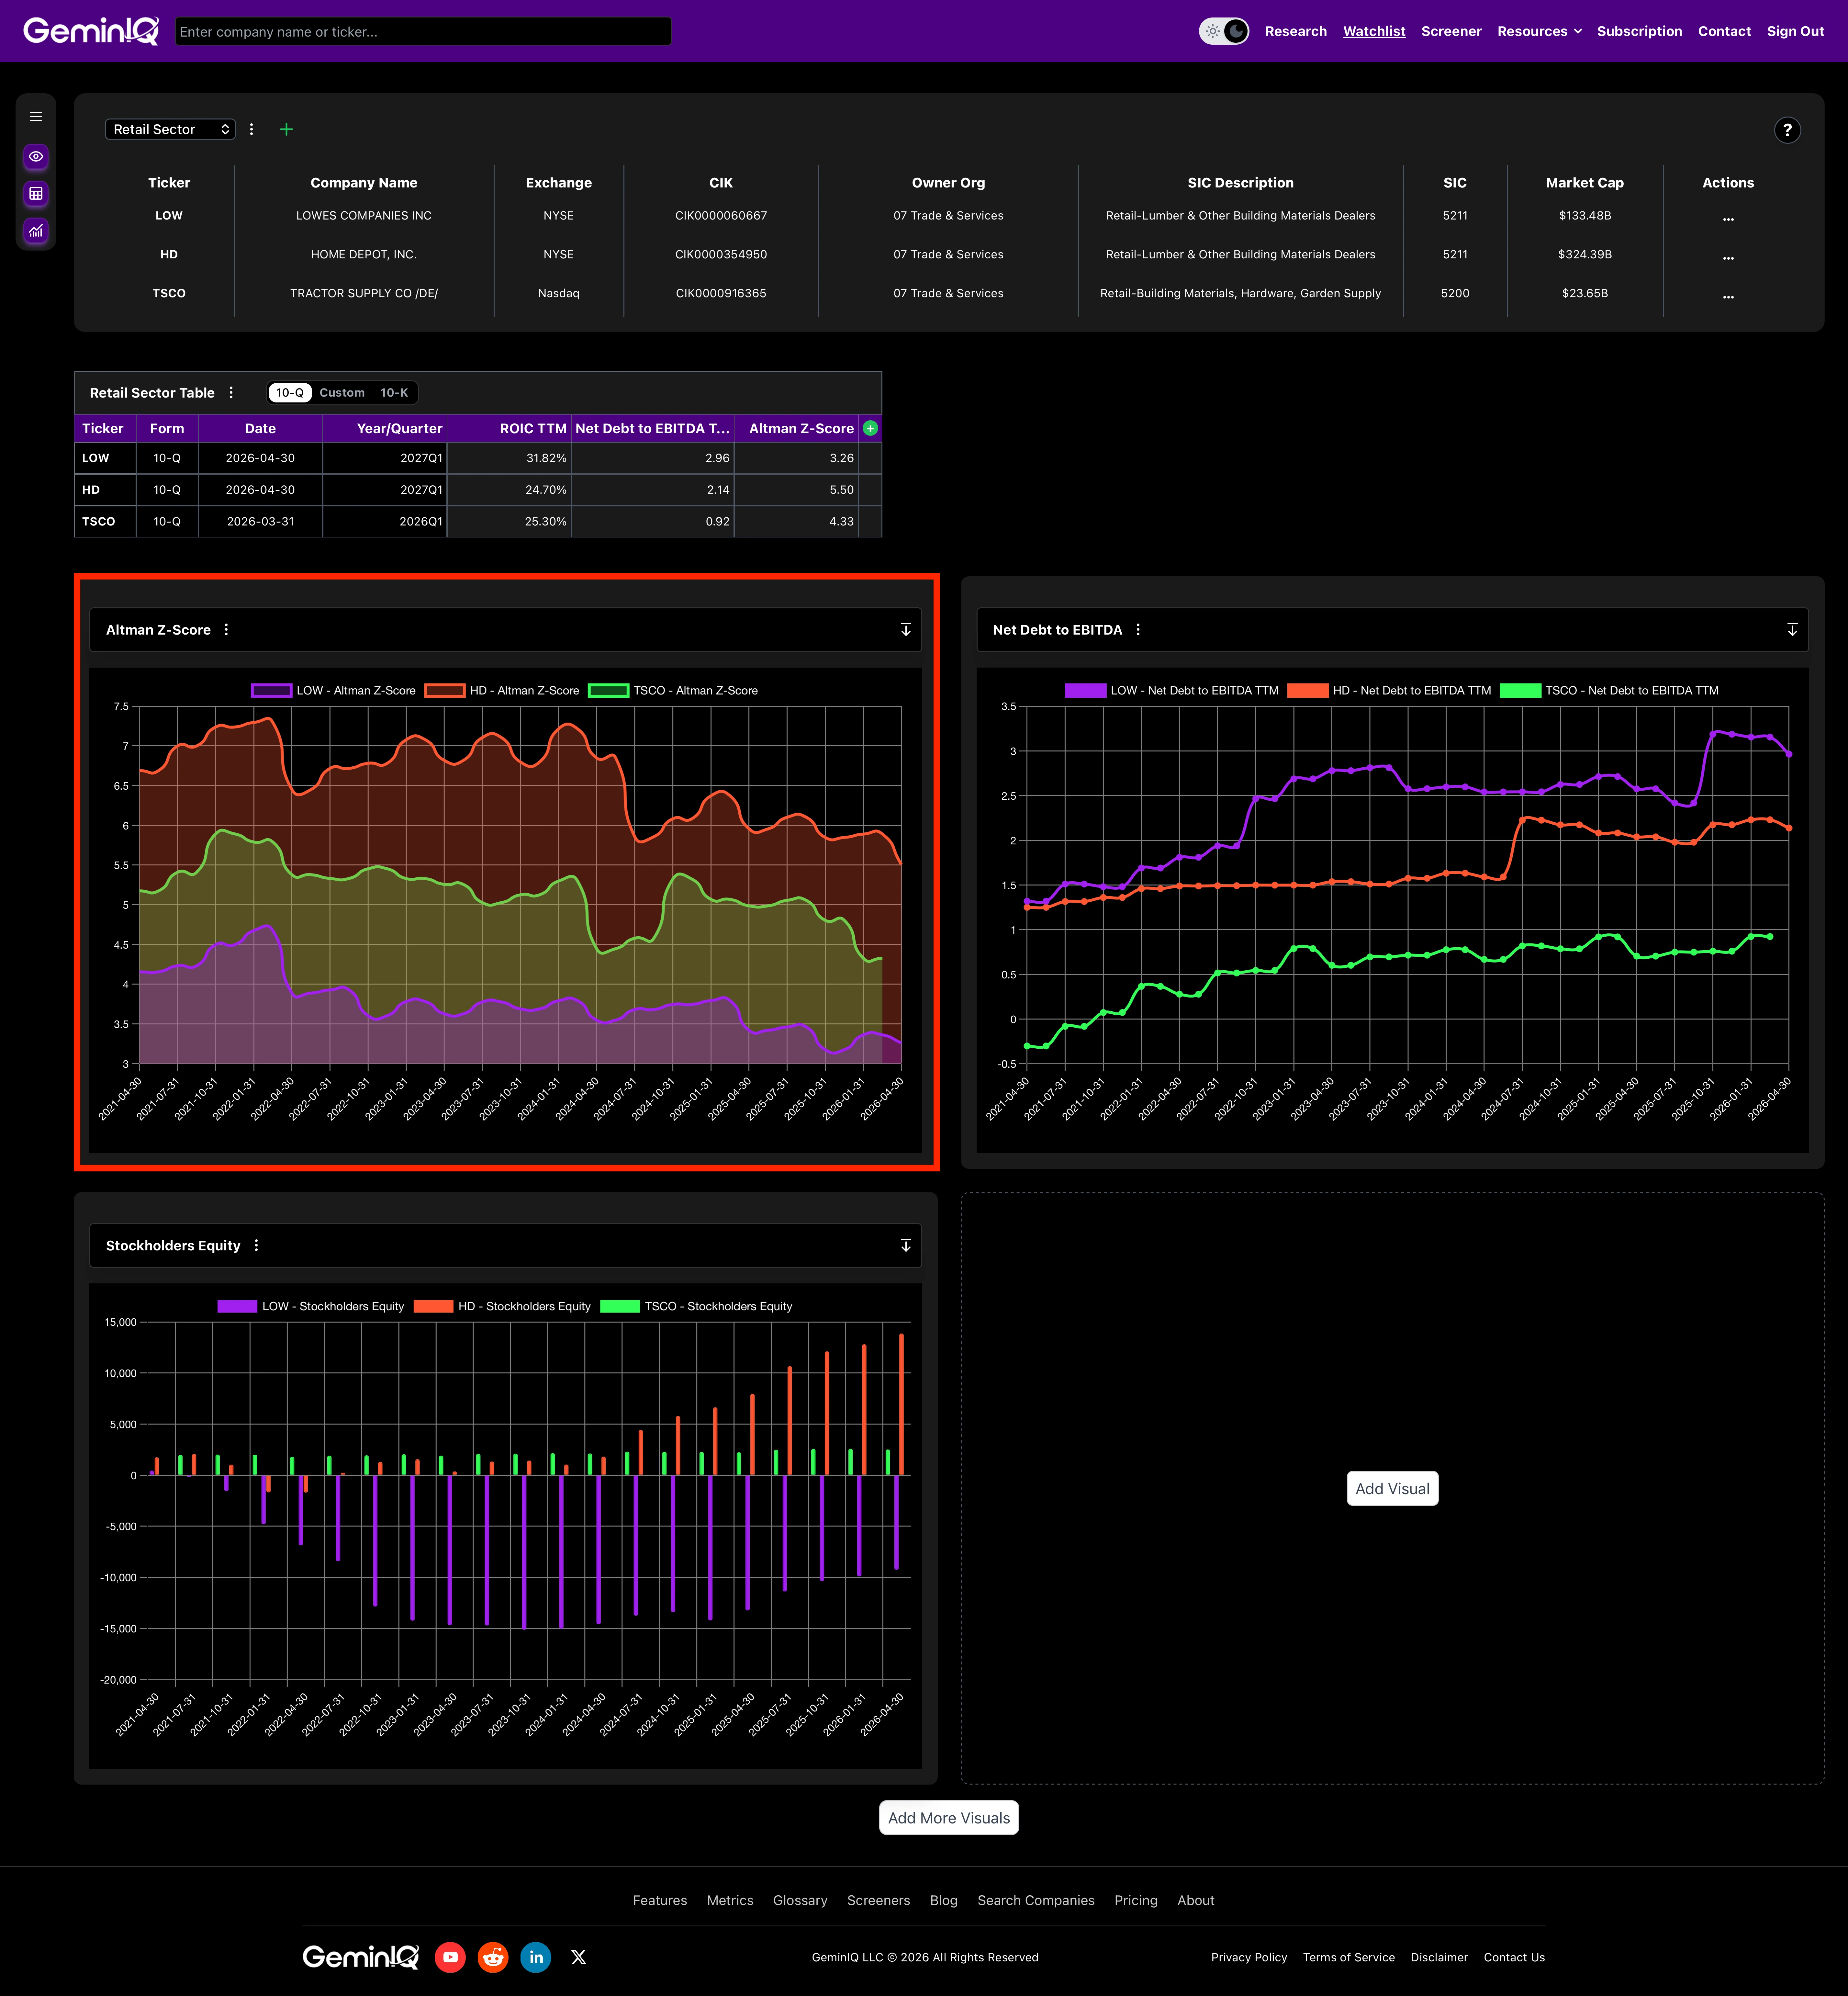 GeminIQ Visualizations chart plotting quarterly Altman Z-Score for Home Depot, Lowe's, and Tractor Supply from 2021 through Q1 FY2026.
Phase 5: What Institutional and Insider Data Confirm
GeminIQ's Institutional Ownership data shows 69.68% for Home Depot, 68.38% for Lowe's, and 84.69% for Tractor Supply, as of the most recent 13F-reported quarter. Tractor Supply's figure is down sharply from roughly 93.7% the quarter before, and Lowe's from roughly 75.9%, both large enough single-quarter moves to note, though 13F data is lagged by design and one quarter isn't a trend on its own. The GeminIQ Insider Transactions feed shows nothing but Sale filings at Home Depot and Tractor Supply over the past year. Lowe's shows mostly Sale filings too, plus a single Director purchase of $231,060 late last year, a small position against the sale volumes around it and not enough to read as a signal in either direction.
The Analyst's Verdict
Revenue growth is the number all three retailers share, and it's the number that makes the sector look healthy from a distance. Underneath it, Return on Invested Capital has fallen at all three since 2021, leverage relative to EBITDA has risen at all three over the same window, and none of the three Altman Z-Scores is moving up. The reason this is easy to miss is that Home Depot's and Lowe's own equity bases have shrunk or gone negative from years of buybacks, breaking Return on Equity and Debt-to-Equity as useful tools for two-thirds of the sector. Tractor Supply's balance sheet is the one clean enough to still read normally, but its own returns are eroding at close to the same pace as its larger peers.
Frequently Asked Questions
Why is Lowe's Return on Equity not a useful metric right now?
Lowe's carries negative total equity, -$9.27 Billion as of its most recent quarter, so any Return on Equity calculation divides by a negative number and produces a result that doesn't mean what a normal ROE reading means. Lowe's own balance sheet labels this section "Shareholders' Deficit" rather than equity.
Has Home Depot's Return on Invested Capital improved or worsened since 2021?
It has worsened in nearly every year since 2021, falling from 58.06% to 24.70% as of the quarter ended May 3, 2026, even as its Price-to-Earnings Ratio rose from 20.62x to 23.15x over the same window.
Which retailer carries the lowest leverage by Net Debt-to-EBITDA?
Tractor Supply Company carries the lowest Net Debt-to-EBITDA ratio of the three at 0.92x, though it started the five-year window in a net cash position and has since moved toward modest net debt.
When did Home Depot, Lowe's, and Tractor Supply last file their 10-Q?
Home Depot filed its Q1 FY2026 10-Q on May 27, 2026 (period ending May 3, 2026); Lowe's filed on May 28, 2026 (period ending May 1, 2026); Tractor Supply filed on May 7, 2026 (period ending March 28, 2026).
Wall Street's data. Main Street's price.
Institutional terminals charge thousands a year for as-filed accuracy. GeminIQ gives you the same thing for a fraction of the cost: financials built directly from raw SEC EDGAR filings, not third-party APIs, with full XBRL traceability back to the original 10-K or 10-Q. No normalized guesswork, just calculated metrics, charts, screeners, and watchlists built on numbers exactly as the company reported them. Start researching now at GeminIQ.com.
All financial figures cited in this article reference The Home Depot, Inc.'s Q1 FY2026 10-Q (filed May 27, 2026, period ending May 3, 2026). All SEC filings are publicly available at SEC EDGAR.
All financial figures cited in this article reference Lowe's Companies, Inc.'s Q1 FY2026 10-Q (filed May 28, 2026, period ending May 1, 2026). All SEC filings are publicly available at SEC EDGAR.
All financial figures cited in this article reference Tractor Supply Company's Q1 FY2026 10-Q (filed May 7, 2026, period ending March 28, 2026). All SEC filings are publicly available at SEC EDGAR.
Disclaimer: The content in this blog is for educational and entertainment purposes only and does not constitute financial, legal, or tax advice. Investing involves risk, including the loss of principal. The views expressed are my own and not intended as financial advice or a guarantee of future performance.