
How to Check Revenue Growth Deceleration in 4 Steps

By Chad Hartman
Published · Last updated
Financial media reports revenue growth as a single number each quarter — up or down against the same period last year — and moves on to the next name on the earnings calendar. The number that actually matters sits one layer beneath that headline: not the growth rate itself, but whether it is accelerating or decelerating from the quarter before it. GeminIQ's own study of what happens when revenue growth slows found a specific point where that shift has historically lined up with weaker forward returns across the filing universe — a base-rate association, not a prediction. This guide builds the exact check from GeminIQ's pre-calculated Revenue Growth metric. Then it runs that check live against four companies' most recently filed numbers.
Quick Reference
| Input | Definition |
|---|---|
| Revenue Growth (TTM, 1Y) | GeminIQ's pre-calculated year-over-year change in trailing-twelve-month revenue |
| Point Change | Current quarter's Revenue Growth minus the prior quarter's Revenue Growth, in percentage points |
| Decel Threshold | A single-quarter Point Change of -20 points or more |
| Null Zone | A single-quarter Point Change between -5 and +5 points |
| Universe Base Rate | +2.36% median 3-month post-filing return across 76,908 filings |
Table of Contents
- The Two Inputs This Check Needs
- The Threshold: A 20-Point Drop in the Growth Rate, Not the Level
- Step 1: Pull the Trailing Revenue Growth Trend
- Step 2: Compute the Point Change
- Step 3: Weigh the Change Against the Level
- Step 4: Compare Against the Threshold
- Four Current Filings: MercadoLibre, Eaton, Broadcom, Enphase
- Frequently Asked Questions
The Two Inputs This Check Needs
GeminIQ's pre-calculated Revenue Growth metric measures trailing-twelve-month revenue against the same period one year earlier, built from each company's as-filed Revenues tag rather than a normalized aggregator feed. Deceleration is not a negative number — it is a shrinking positive one, or in extreme cases a positive one turning negative outright. A company growing revenue at 45% and then 34% a year later is still growing. The deceleration is the 11-point gap between those two readings, not the level either one represents on its own.
The Threshold: A 20-Point Drop in the Growth Rate, Not the Level
GeminIQ's own filing data study on revenue growth deceleration tested this question against 76,908 quarterly filings, each carrying a measurable Point Change and a clean three-month post-filing return. A single-quarter Point Change of -20 points or more placed a filing in a bucket whose median subsequent return fell below the universe base rate of +2.36%. A Point Change of -5 points or less looked statistically indistinguishable from any other quarter in the sample. The study's own framing is worth repeating here: followed by, never predicts. This is a historical association measured across a large sample, not a forecast for any single stock.
Step 1: Pull the Trailing Revenue Growth Trend
Open a company in GeminIQ's Calculated Metrics view and pull its Revenue Growth reading across the last eight to twelve quarters. Every reading is already TTM-based, which removes the seasonal noise a single quarter's calendar mix would otherwise introduce.
Step 2: Compute the Point Change
Subtract each quarter's Revenue Growth reading from the reading that follows it. That single column of differences — this quarter's percentage minus last quarter's — is the entire computation. There is no smoothing, no adjustment, and no second input.
Step 3: Weigh the Change Against the Level
A large Point Change means little without the level it is falling from. A company whose growth rate drops from 44% to 24% over a year is decelerating sharply and still compounding faster than almost any mature business ever does. A company whose growth rate drops from 15% to -34% is a different animal entirely — the Point Change measures the size of the move, but only the level tells you which side of zero the business landed on.
Step 4: Compare Against the Threshold
Set the most recent Point Change against the two reference points from the Quick Reference table above: a single-quarter drop of 20 points or more, and a drop of 5 points or less. Anything landing between the two carries no established base-rate association in either direction.
Four Current Filings: MercadoLibre, Eaton, Broadcom, Enphase
Three of the four companies below show clean, unflagged readings in their most recent quarter. The fourth carries two of the most extreme Point Changes in this entire dataset, earlier in its filing history — proof the threshold is a real, occasionally-triggered signal and not just a hypothetical bucket in a study.
MercadoLibre (MELI)
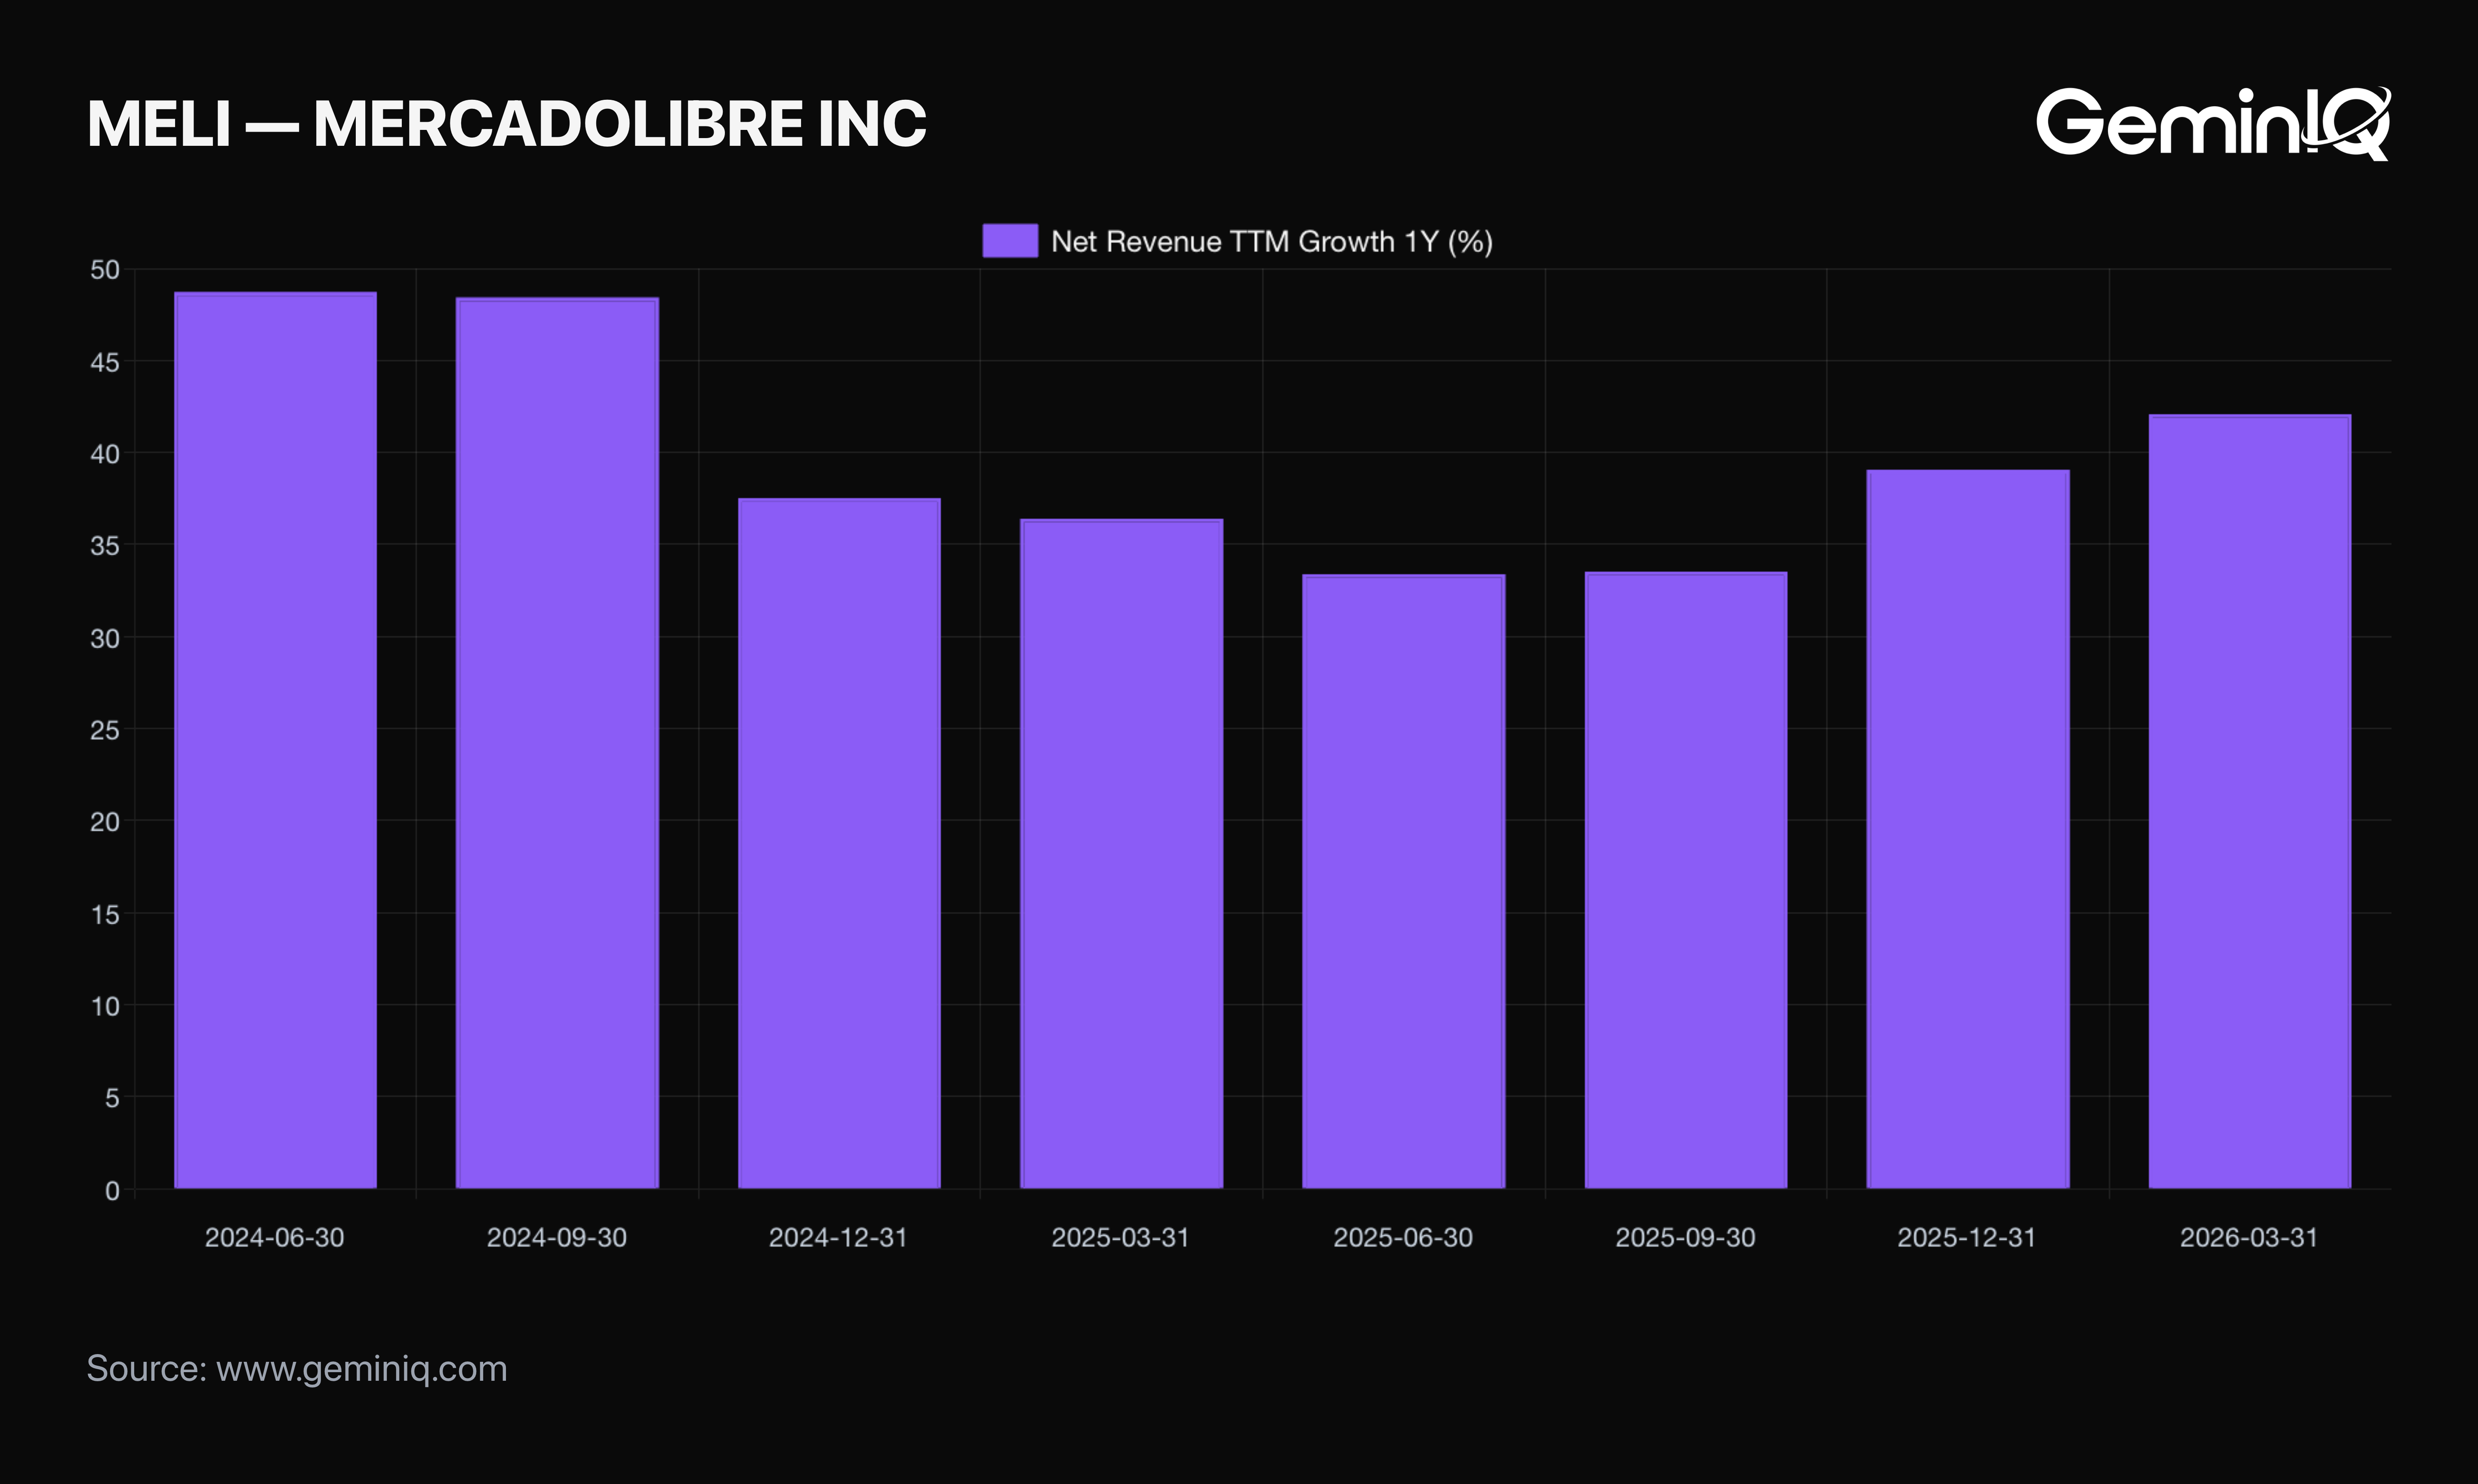
MercadoLibre's TTM Revenue Growth reads 42.11% for the quarter ended March 31, 2026 (filed May 8, 2026), up +3.05 points from the prior quarter. Growth did decelerate over the prior year, from a peak of 45.71% in June 2024 down to a trough of 34.52% in June 2025. But the sharpest single-quarter Point Change across that entire stretch was only -8.12 points — well inside the null-to-flagged range. Growth has since climbed back for two consecutive quarters.
Eaton (ETN)
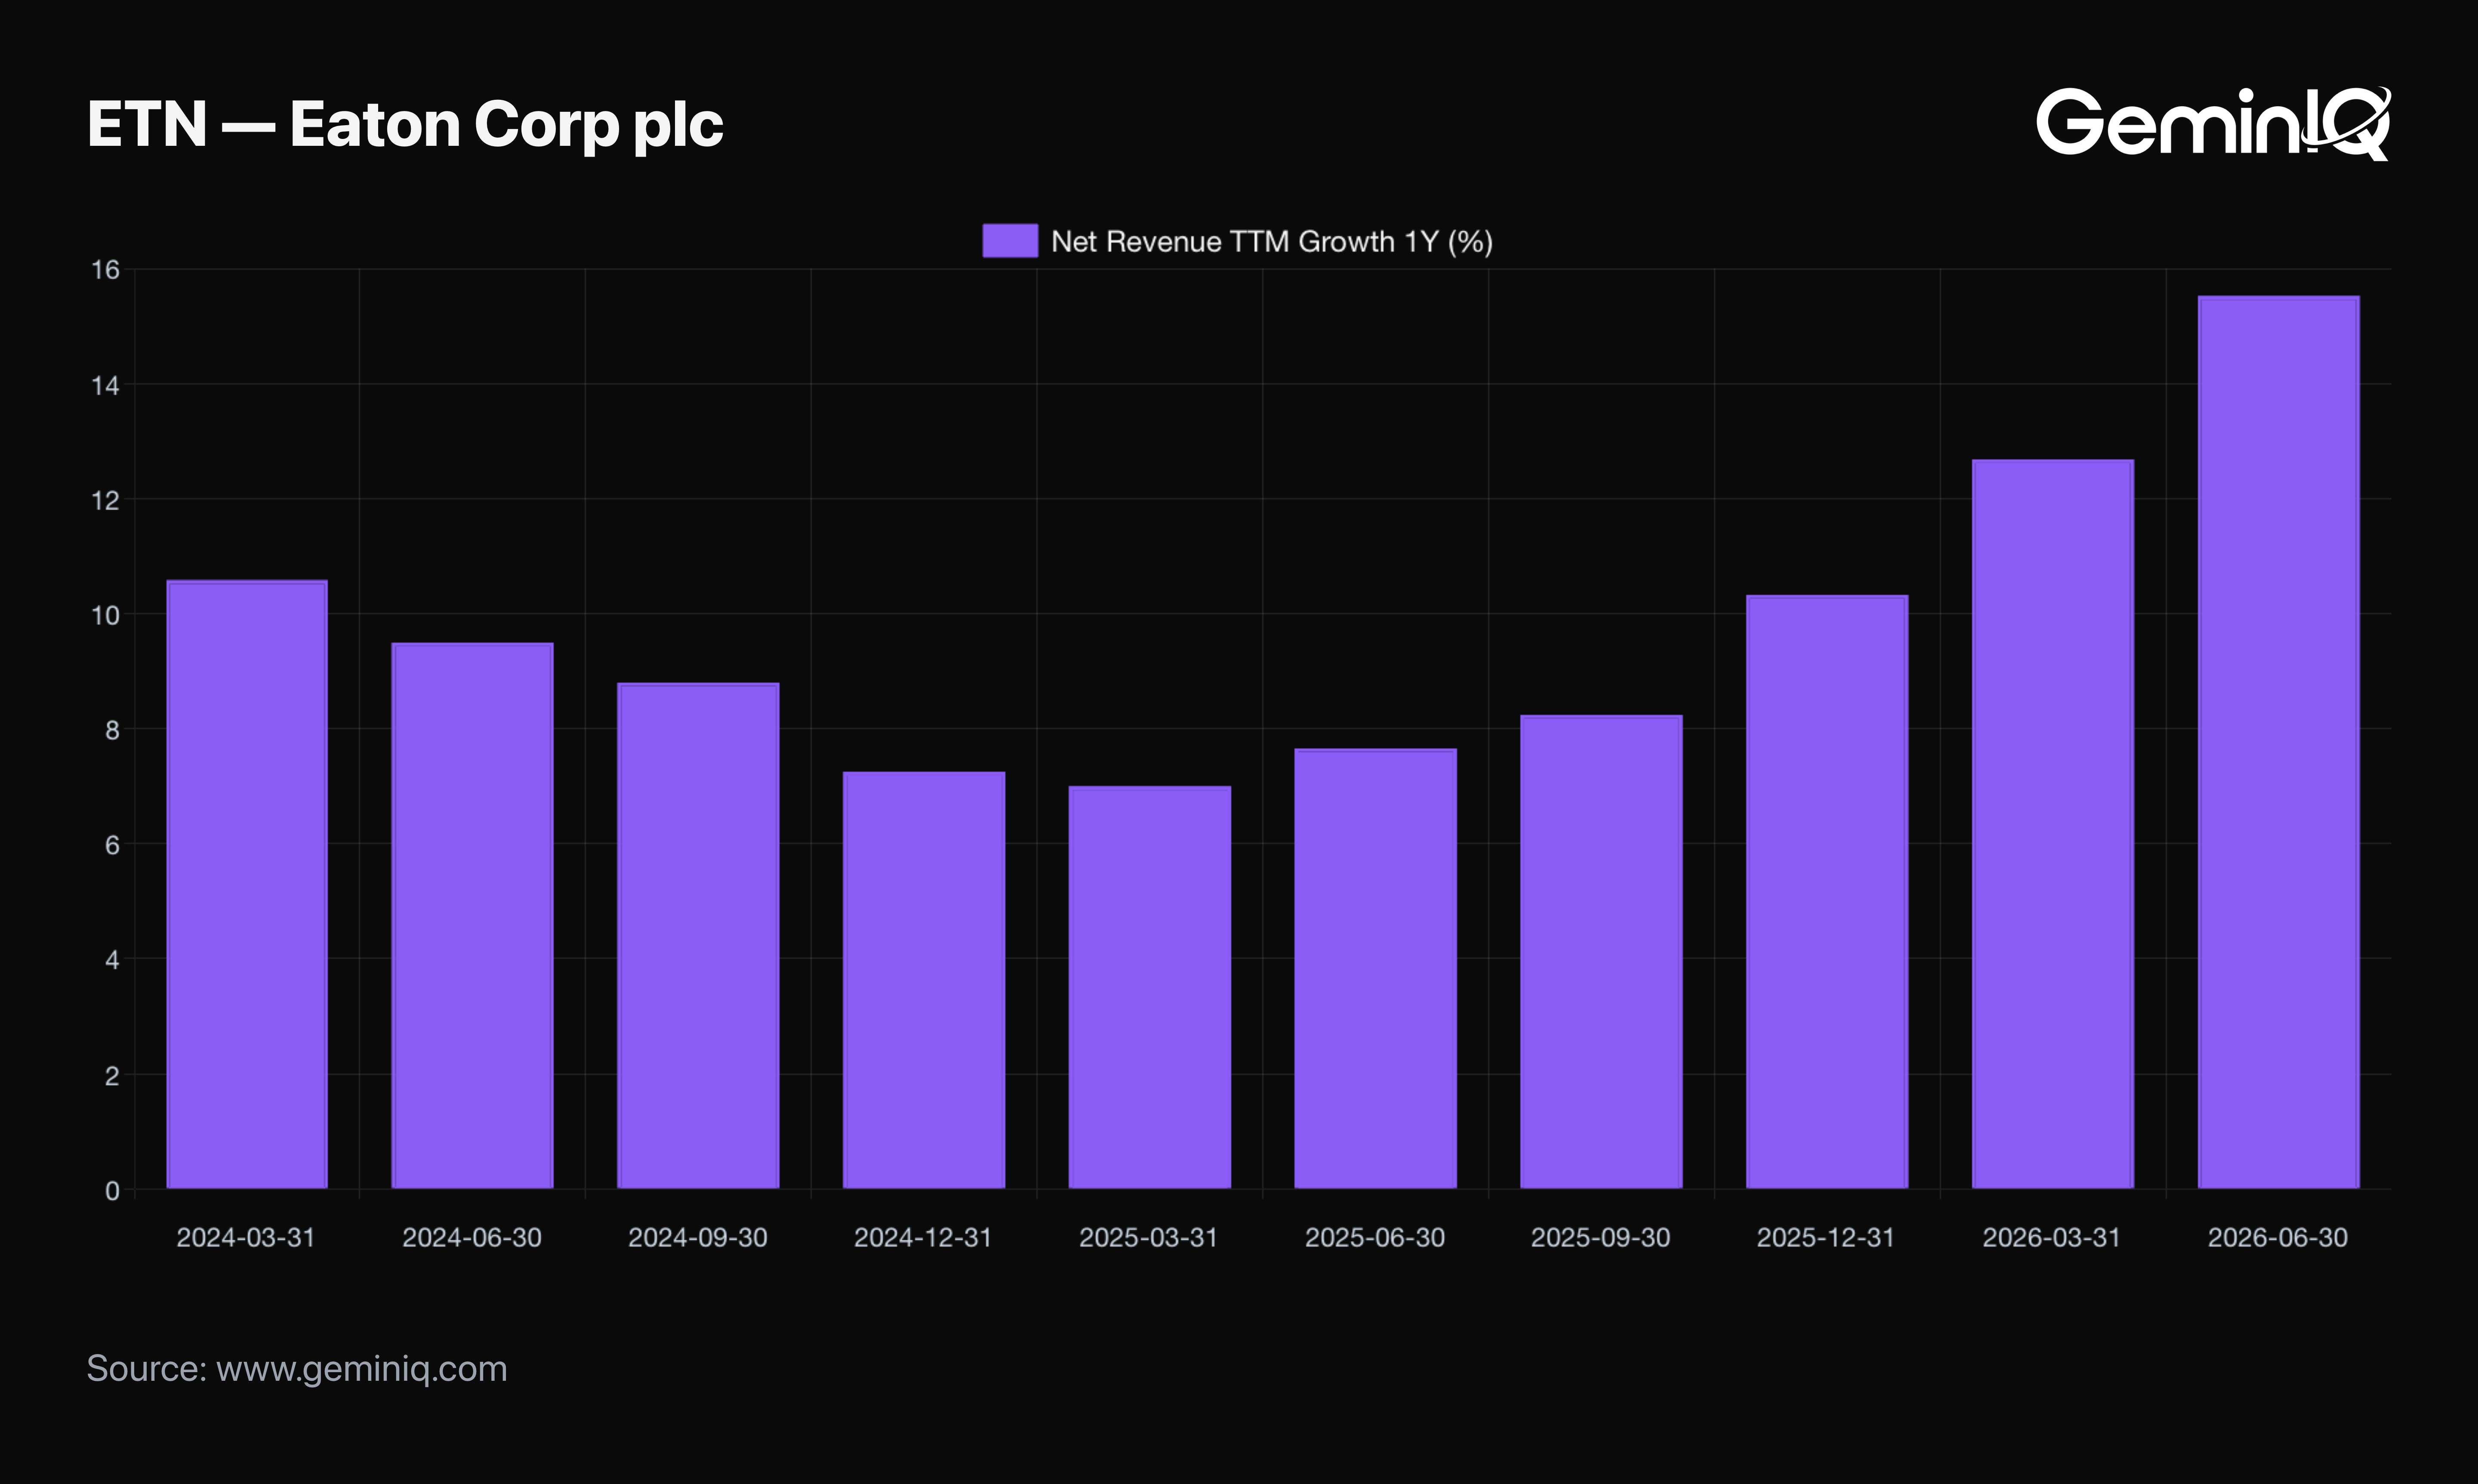
Eaton's TTM Revenue Growth reads 15.53% for the quarter ended June 30, 2026 (filed July 31, 2026), up +2.84 points on the quarter — the fifth straight quarterly increase off a trough of 7.00% in March 2025. No quarter in this stretch of Eaton's history produced a Point Change larger than roughly 2.4 points in either direction. It's a growth rate that moves gradually, nowhere near the scale needed to trip the 20-point threshold.
Broadcom (AVGO)
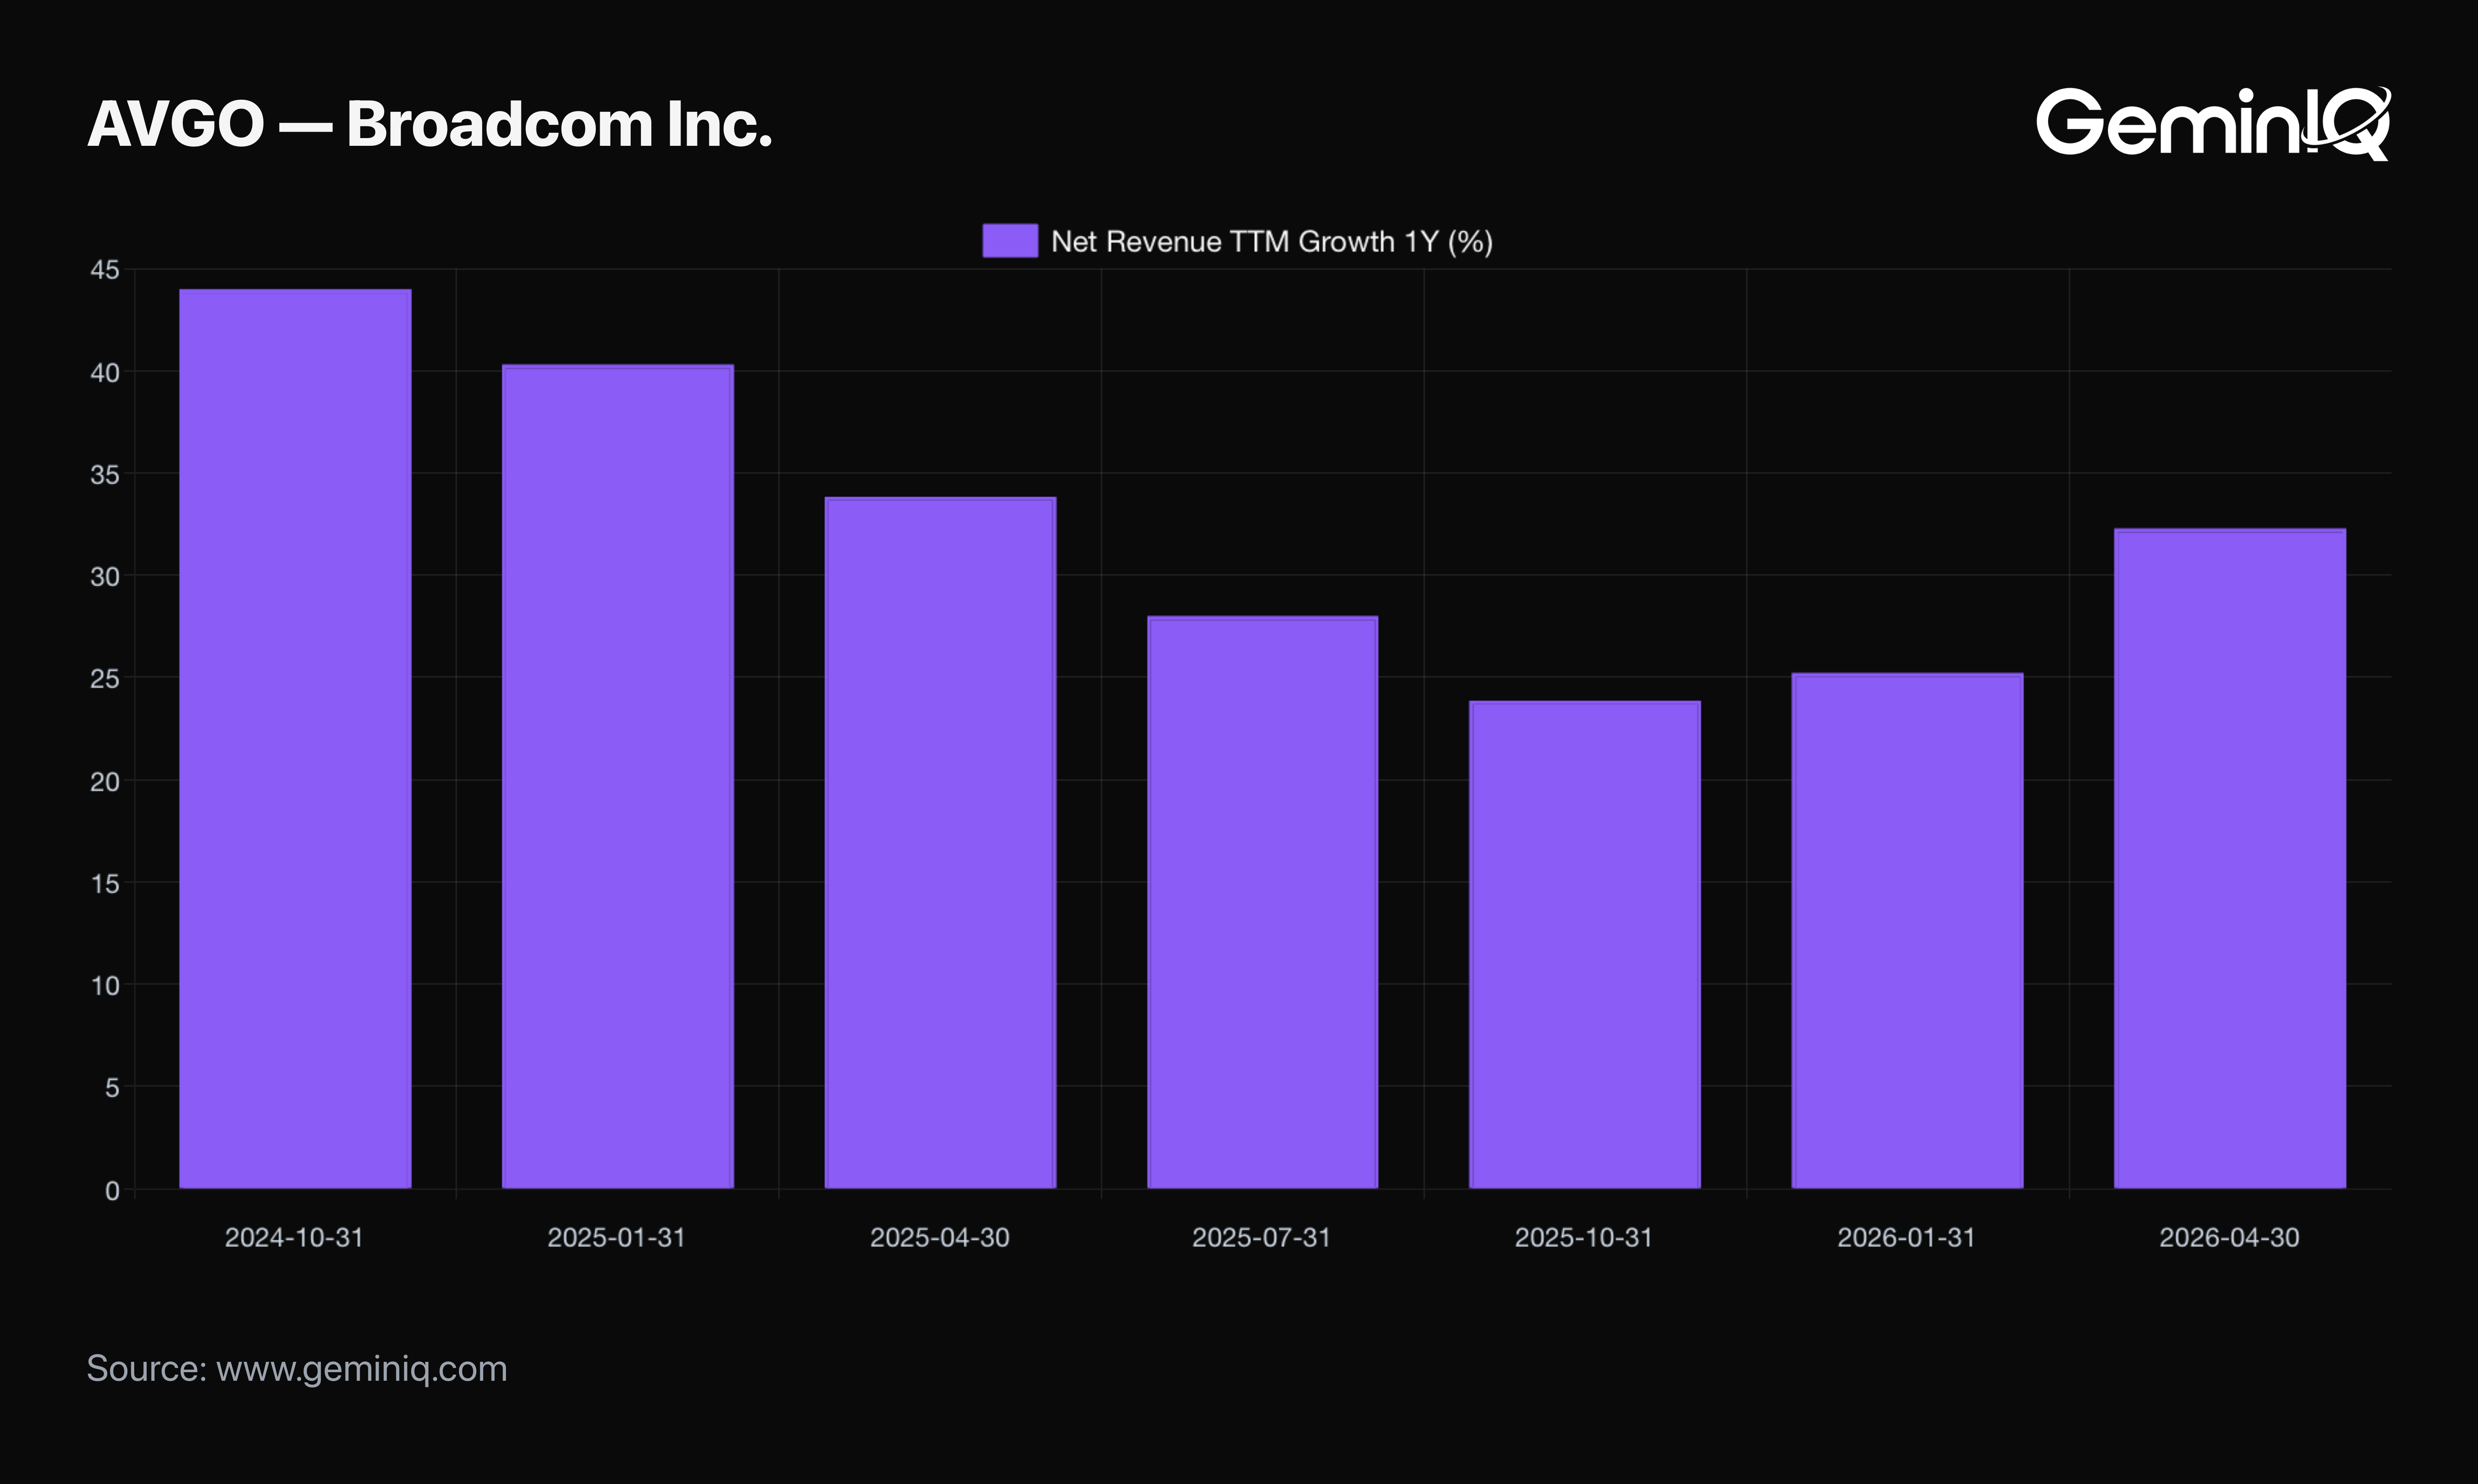
Broadcom's TTM Revenue Growth reads 32.29% for the quarter ended April 30, 2026 (filed June 9, 2026), up +7.07 points on the quarter — but the more instructive reading sits earlier in the series. Growth fell from a peak of 43.99% in October 2024 to a trough of 23.87% in October 2025 across four consecutive quarters of decline. No single one of those four quarters produced a Point Change past -20 points on its own — the sharpest was -6.45 points. Yet the cumulative four-quarter decline totaled just over 20 points. That is exactly the scenario Step 3 warns about: a business that shed roughly half its growth rate over a year without a single quarter's reading ever tripping the flagged threshold by itself.
Enphase Energy (ENPH)
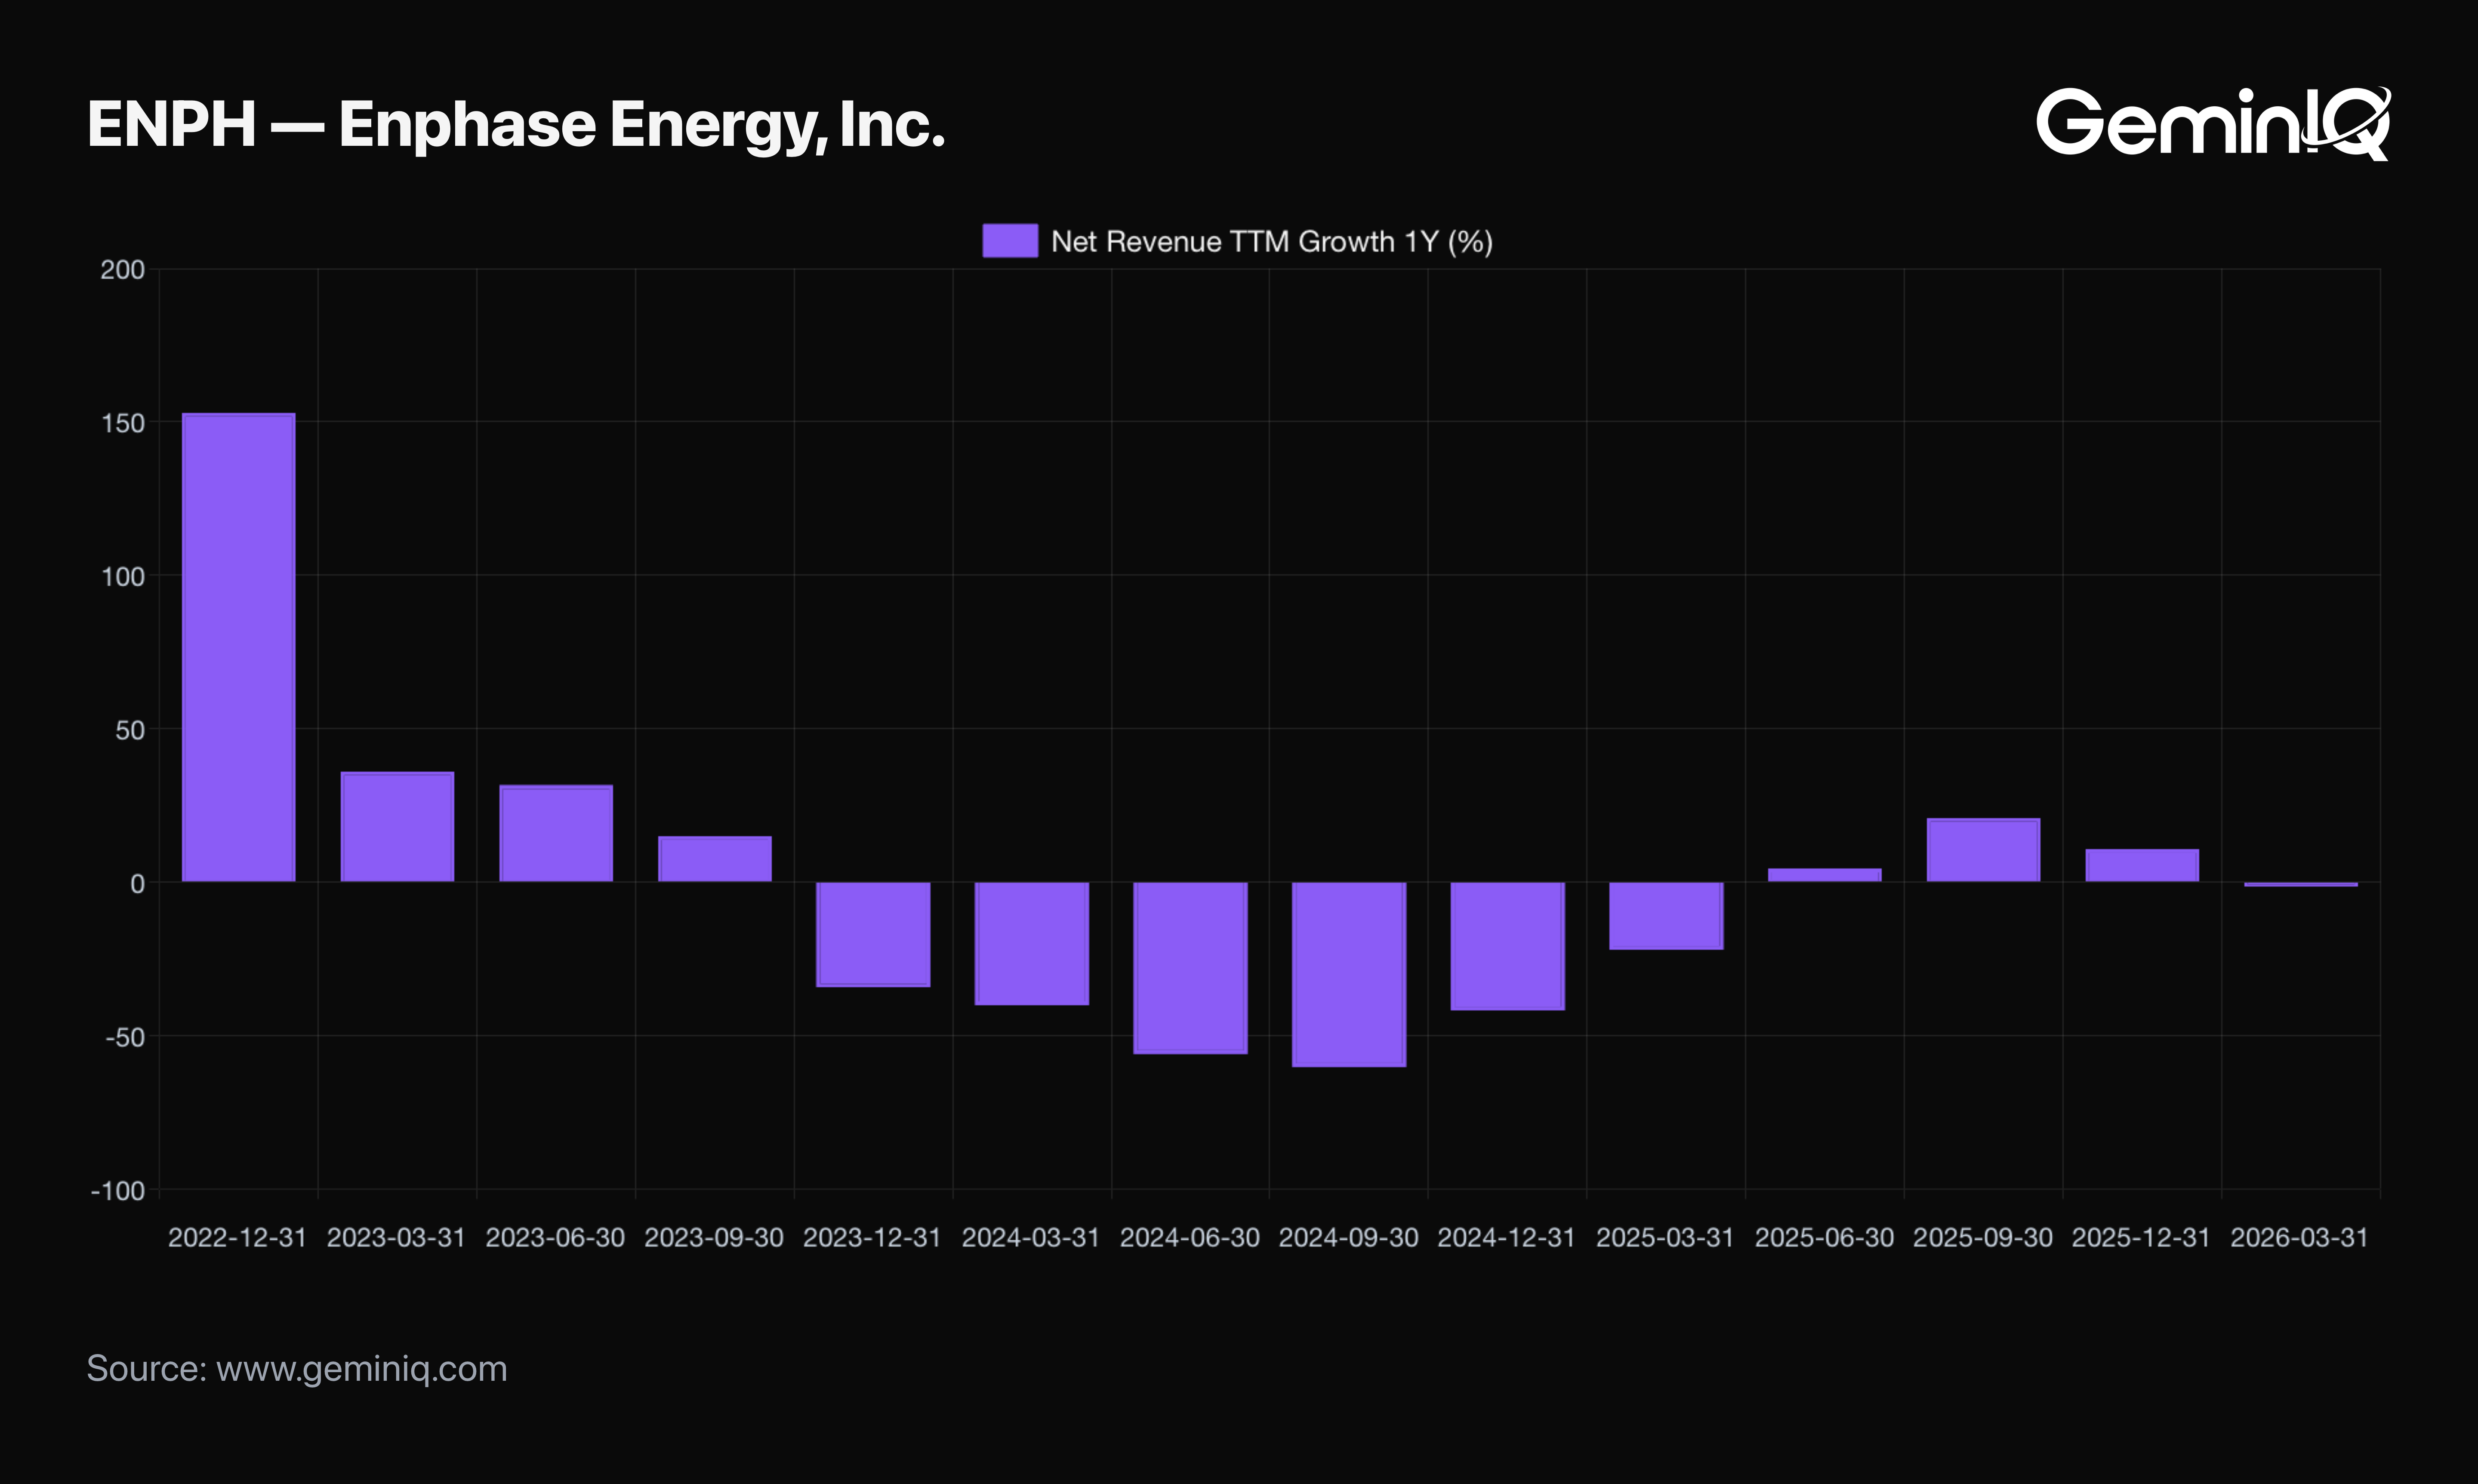
Enphase Energy is the company this check exists for. Its TTM Revenue Growth reads -1.64% for the quarter ended March 31, 2026 (filed April 28, 2026) — modest, and not itself a flagged reading. Three years earlier, though, Enphase produced two of the most extreme Point Changes in this metric's history. Growth fell from 153.02% in December 2022 to 36.09% in March 2023, a single-quarter Point Change of -116.93 points — nearly six times the flagged threshold on its own. Three quarters later, growth crossed from positive to negative outright, falling from 14.97% to -34.49%, a Point Change of -49.45 points. Growth kept falling to a trough of -60.36% by September 2024, then spent the next six quarters climbing back to nearly flat.
Frequently Asked Questions
Can a company decelerate without any single quarter tripping the threshold?
Yes, and it is the way a real slowdown most easily hides from this check. Broadcom's TTM Revenue Growth fell from a peak of 43.99% in October 2024 to a trough of 23.87% in October 2025 across four consecutive quarters of decline. The sharpest single-quarter Point Change in that stretch was only -6.45 points — nowhere near the flagged threshold — yet the cumulative four-quarter decline totaled just over 20 points. A business can shed roughly half its growth rate over a year without one filing ever tripping the threshold by itself, which is why the column of differences from Step 2 is worth reading across a full year rather than one row at a time.
How often does a filing actually trip the 20-point deceleration threshold?
Rarely, by design. The underlying study found the flagged bucket to be a minority of the 76,908 filings in the universe. Most quarters fall in the range between the null zone and the threshold, where no return association has been established either way. Enphase Energy's 2023 filings, above, show what the flagged end of that distribution actually looks like.
Does a decelerating growth rate mean a company is in trouble?
Not automatically. Broadcom's growth rate fell by roughly half over a year without ever going negative, and was reaccelerating again by its most recent filing. Enphase's growth did go negative, for close to a full year, after two of the most extreme single-quarter Point Changes in this dataset. The direction of the level — not just the size of the drop — is what separates a business that is compounding more slowly from one that is shrinking.
Can this check be run on a company outside the four covered here?
Yes. The computation only needs GeminIQ's Revenue Growth reading for the last several quarters of any company in the Calculated Metrics view — the same two-input subtraction applies to any name in the database.
Related Reading
- Revenue Growth Slowdown: What History Shows About Stock Returns — the full universe study this threshold comes from, including the bucket analysis and base-rate methodology.
Wall Street's data. Main Street's price.
Institutional terminals charge thousands a year for as-filed accuracy. GeminIQ gives you the same thing for a fraction of the cost: financials built directly from raw SEC EDGAR filings, not third-party APIs, with full XBRL traceability back to the original 10-K or 10-Q. No normalized guesswork, just calculated metrics, charts, screeners, and watchlists built on numbers exactly as the company reported them. Start researching now at GeminIQ.com.
All financial figures cited in this article reference MercadoLibre, Inc.'s Q1 FY2026 10-Q (filed May 8, 2026, period ending March 31, 2026). All SEC filings are publicly available at SEC EDGAR.
All financial figures cited in this article reference Eaton Corporation plc's Q2 FY2026 10-Q (filed July 31, 2026, period ending June 30, 2026). All SEC filings are publicly available at SEC EDGAR.
All financial figures cited in this article reference Broadcom Inc.'s Q2 FY2026 10-Q (filed June 9, 2026, period ending April 30, 2026). All SEC filings are publicly available at SEC EDGAR.
All financial figures cited in this article reference Enphase Energy, Inc.'s Q1 FY2026 10-Q (filed April 28, 2026, period ending March 31, 2026). All SEC filings are publicly available at SEC EDGAR.
Disclaimer: The content in this blog is for educational and entertainment purposes only and does not constitute financial, legal, or tax advice. Investing involves risk, including the loss of principal. The views expressed are my own and not intended as financial advice or a guarantee of future performance.