
Revenue Growth Slowdown: What 76,908 Filings Show

By Chad Hartman
Published · Last updated
Across 76,908 as-filed 10-K and 10-Q filings from December 2004 through June 2026, quarters where the revenue growth rate fell by more than 50 points were followed by a median three-month return of -1.79% — 4.15 points below the universe base rate of +2.36%. The gradient holds across all nine buckets, but the total spread between the worst bucket and the best is roughly four and a half percentage points, not a cliff.
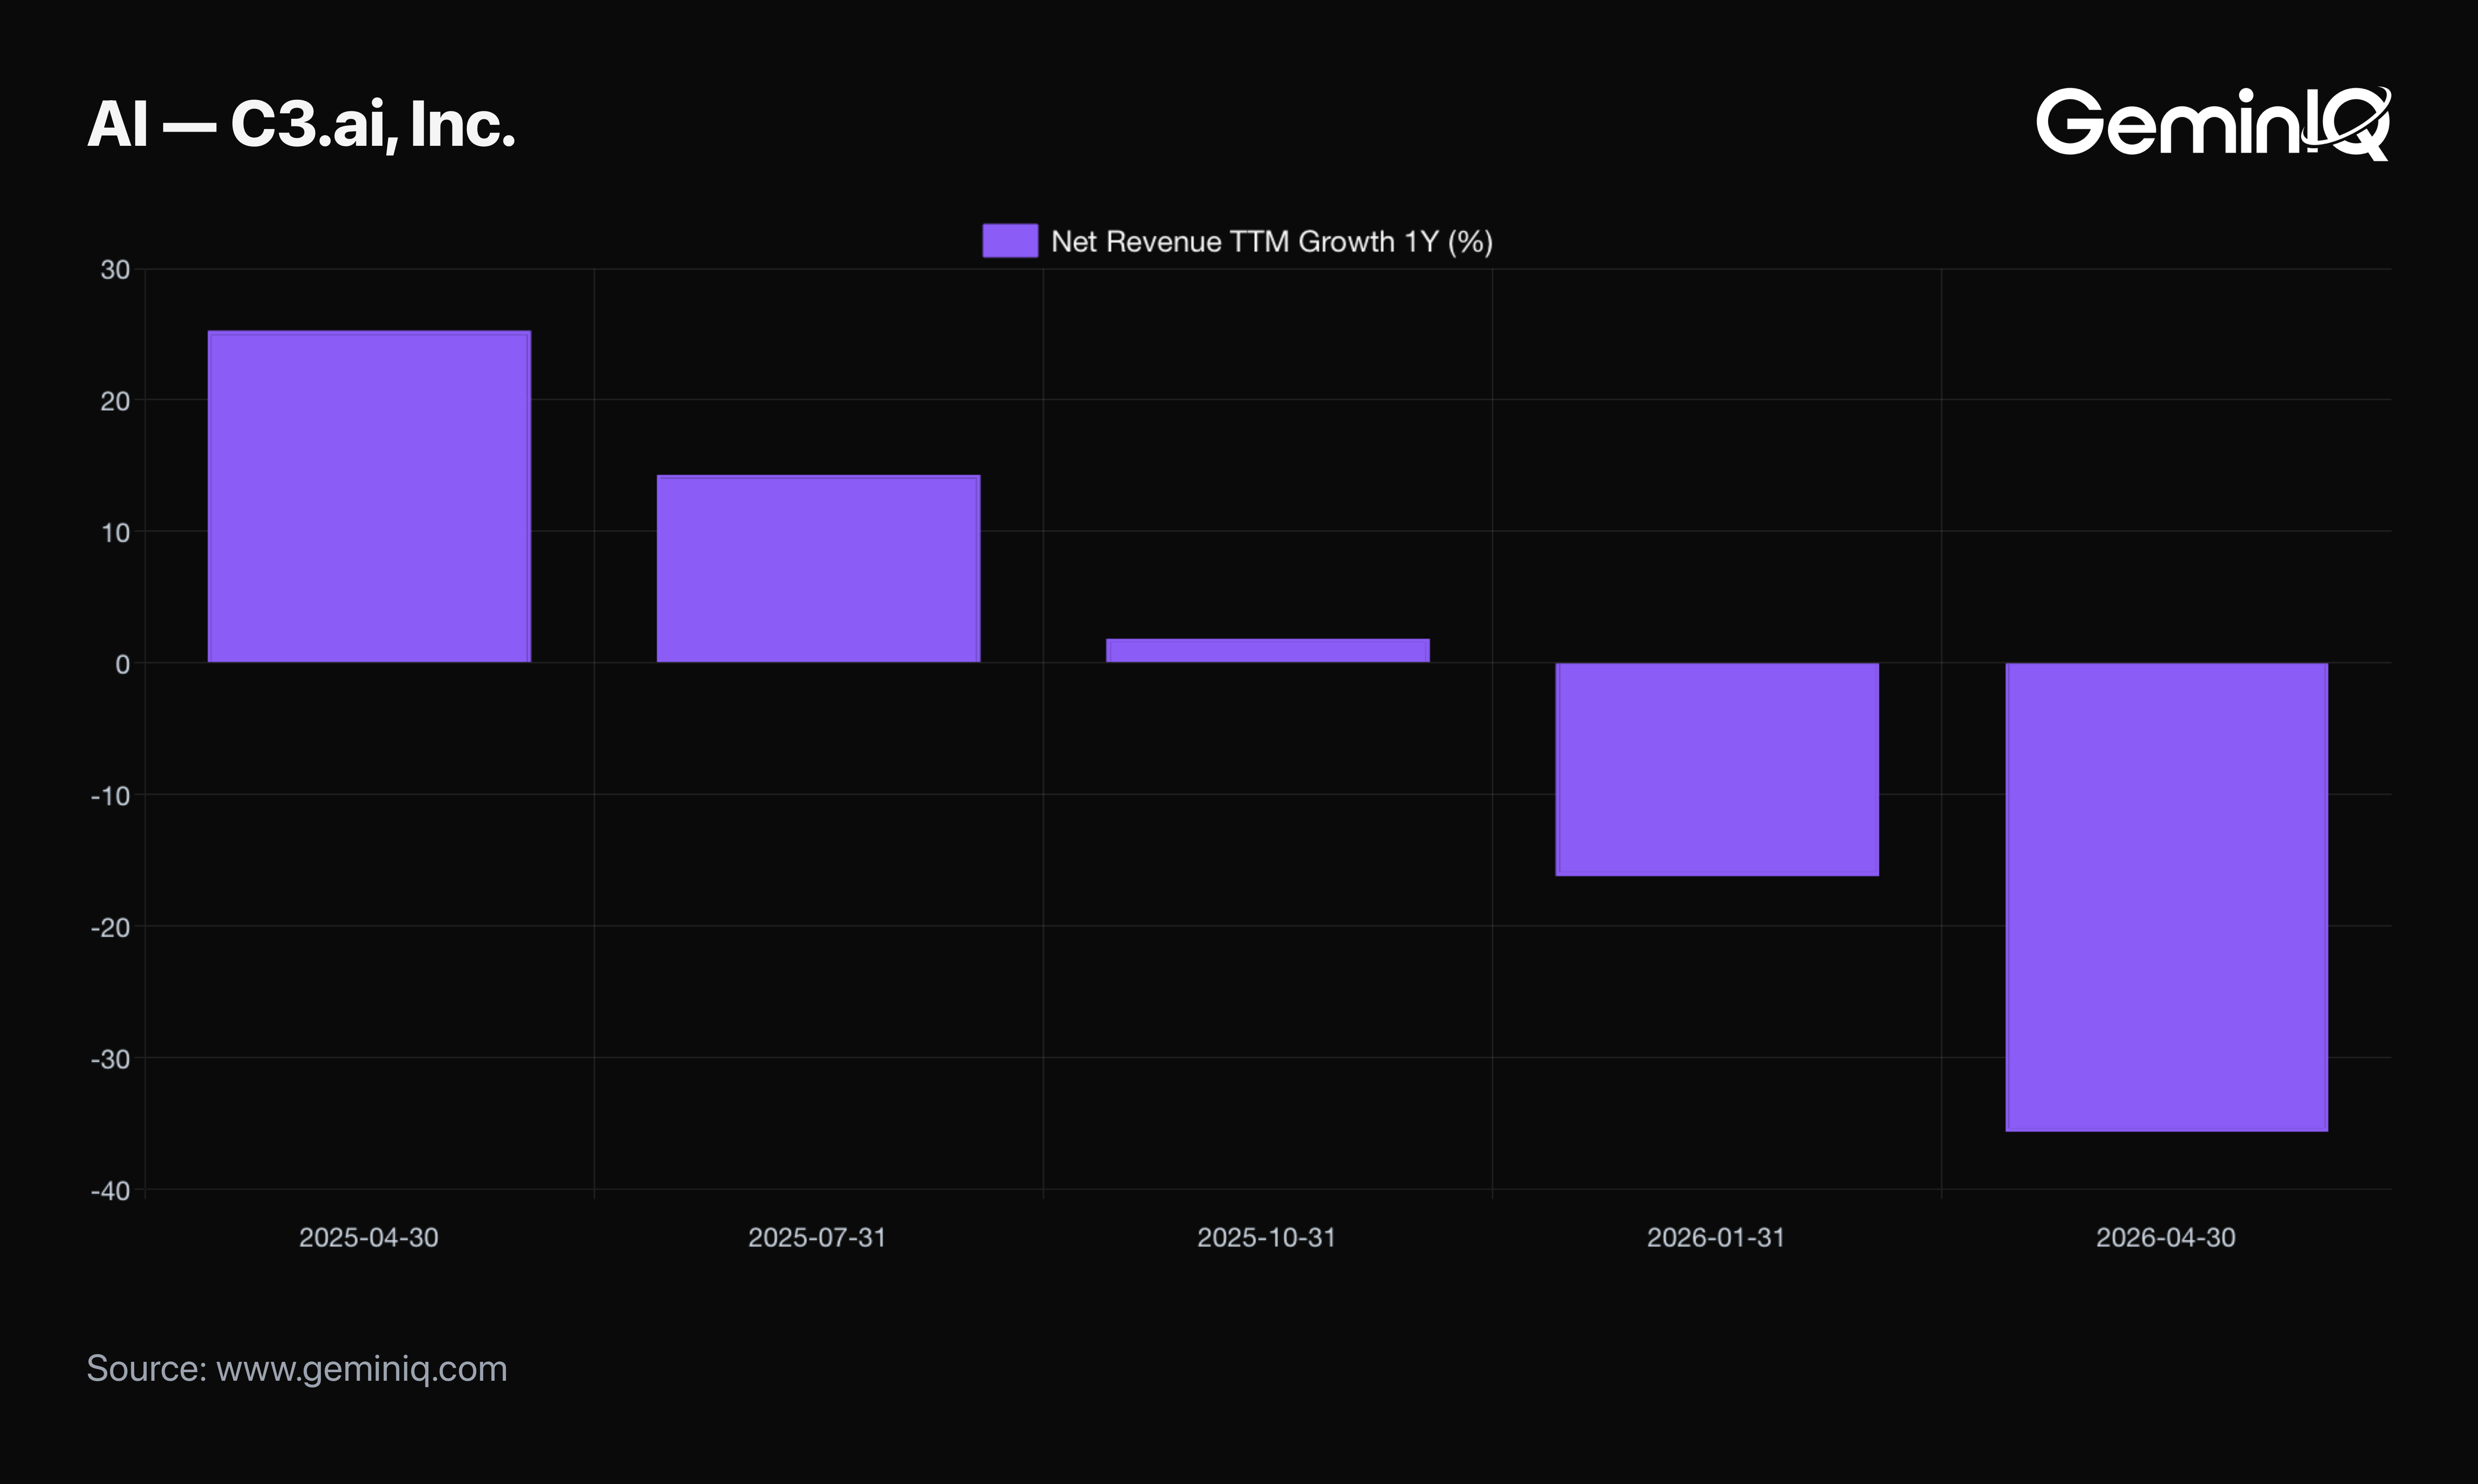
C3.ai spent seven consecutive quarters accelerating. Its Revenue Growth climbed from 5.51% to 25.27%, quarter after quarter, right through the FY2025 10-K filed on June 23, 2025. Then the next 10-Q landed on September 9, 2025 and the same figure read 14.34% — a drop of 10.93 points in a single filing. Three months later the stock was down 8.20%. The quarter after that, Revenue Growth fell to 1.84%, and the three months following that filing took 50.41% off the share price. By the FY2026 10-K, trailing revenue had fallen from $389.056 Million to $250.268 Million and Revenue Growth read -35.67%.
That is the story every growth investor thinks they already understand: growth slows, stock falls. But one company proves nothing. The question worth answering is what happens on average, across every company that ever posted a slowdown — and whether the size of the slowdown matters, or whether the market has already priced it by the time the filing hits EDGAR.
This study reads every 10-K and 10-Q in GeminIQ's as-filed database from December 2004 through June 2026 — 390,915 company-quarters across 15,064 companies, extracted directly from SEC EDGAR XBRL with no aggregator in between. The bucket analysis below runs on the 76,908 quarterly filings that carry both a measurable change in growth rate and a clean three-month post-filing return, joined to how each stock actually traded in the three months after its filing date.
What Followed a Revenue Growth Slowdown
Filings where the revenue growth rate fell sharply were followed by weaker three-month returns than filings where it held steady or improved. The relationship is monotonic across the middle of the distribution: the further the growth rate dropped, the worse the subsequent median return, with no bucket breaking the sequence between a 50-point collapse and a 5-point improvement.
But the magnitude is smaller than the narrative suggests, and that is the more useful finding. The gap between the worst bucket and the best is roughly four and a half percentage points of median three-month return. That is a real tilt in the odds. It is not a verdict on any individual stock, and this is a historical association measured over the 2004–2026 sample window, not a forecast.
Three-Month Returns by Size of the Slowdown
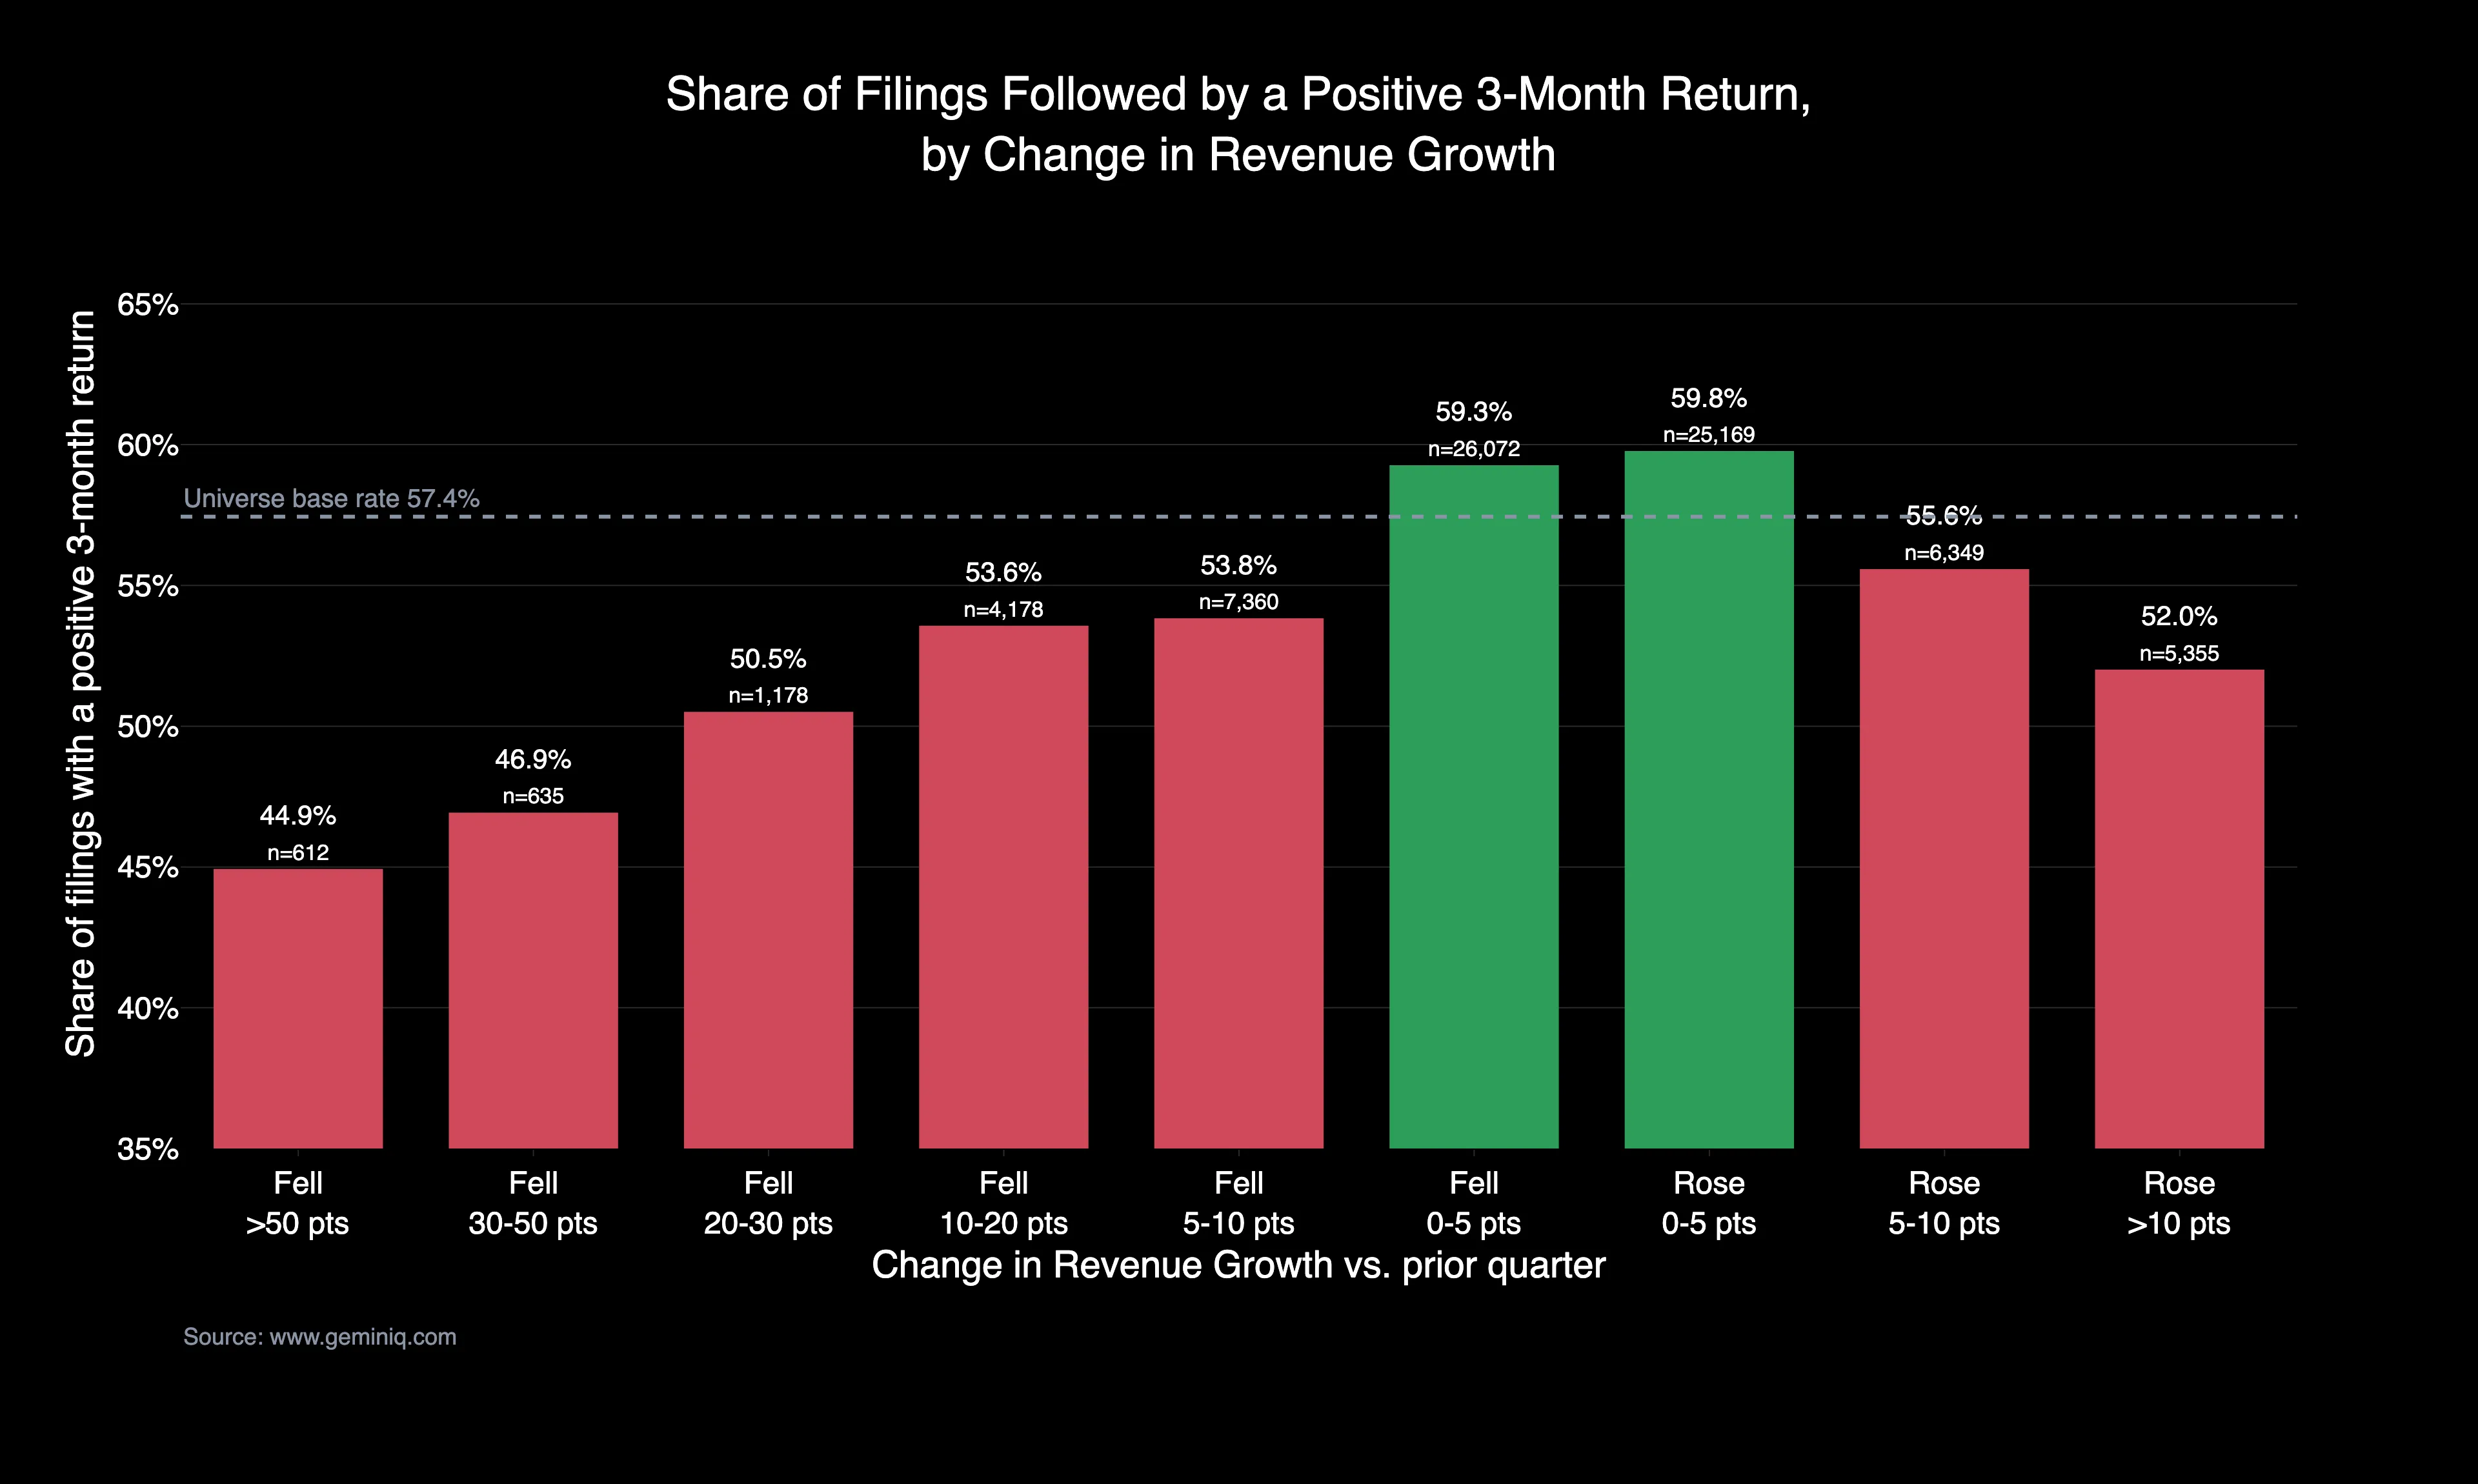
The gradient runs the full length of the table. Filings whose growth rate collapsed by more than 50 points posted a median three-month return of -1.79% and were positive less than half the time. Filings whose growth rate barely moved posted +2.79% and were positive 59.3% of the time. Every bucket is measured against the universe base rate — the median three-month return across all 76,908 filings, which was +2.36%, with a mean of +3.49%. Returns are cumulative from each filing's filed date, trimmed at the top and bottom 1%, and never compounded.
| Change in Revenue Growth | Filings | Median 3-Mo Return | vs. Base Rate | Share Positive |
|---|---|---|---|---|
| Fell more than 50 pts | 612 | -1.79% | -4.15 pts | 44.9% |
| Fell 30–50 pts | 635 | -1.12% | -3.48 pts | 46.9% |
| Fell 20–30 pts | 1,178 | +0.49% | -1.88 pts | 50.5% |
| Fell 10–20 pts | 4,178 | +1.50% | -0.87 pts | 53.6% |
| Fell 5–10 pts | 7,360 | +1.48% | -0.89 pts | 53.8% |
| Fell 0–5 pts | 26,072 | +2.79% | +0.43 pts | 59.3% |
| Rose 0–5 pts | 25,169 | +2.83% | +0.47 pts | 59.8% |
| Rose 5–10 pts | 6,349 | +1.92% | -0.44 pts | 55.6% |
| Rose more than 10 pts | 5,355 | +0.96% | -1.40 pts | 52.0% |
The smallest bucket carries 612 filings, comfortably above the 200-filing floor this series requires before drawing any conclusion, and the largest carries 26,072.
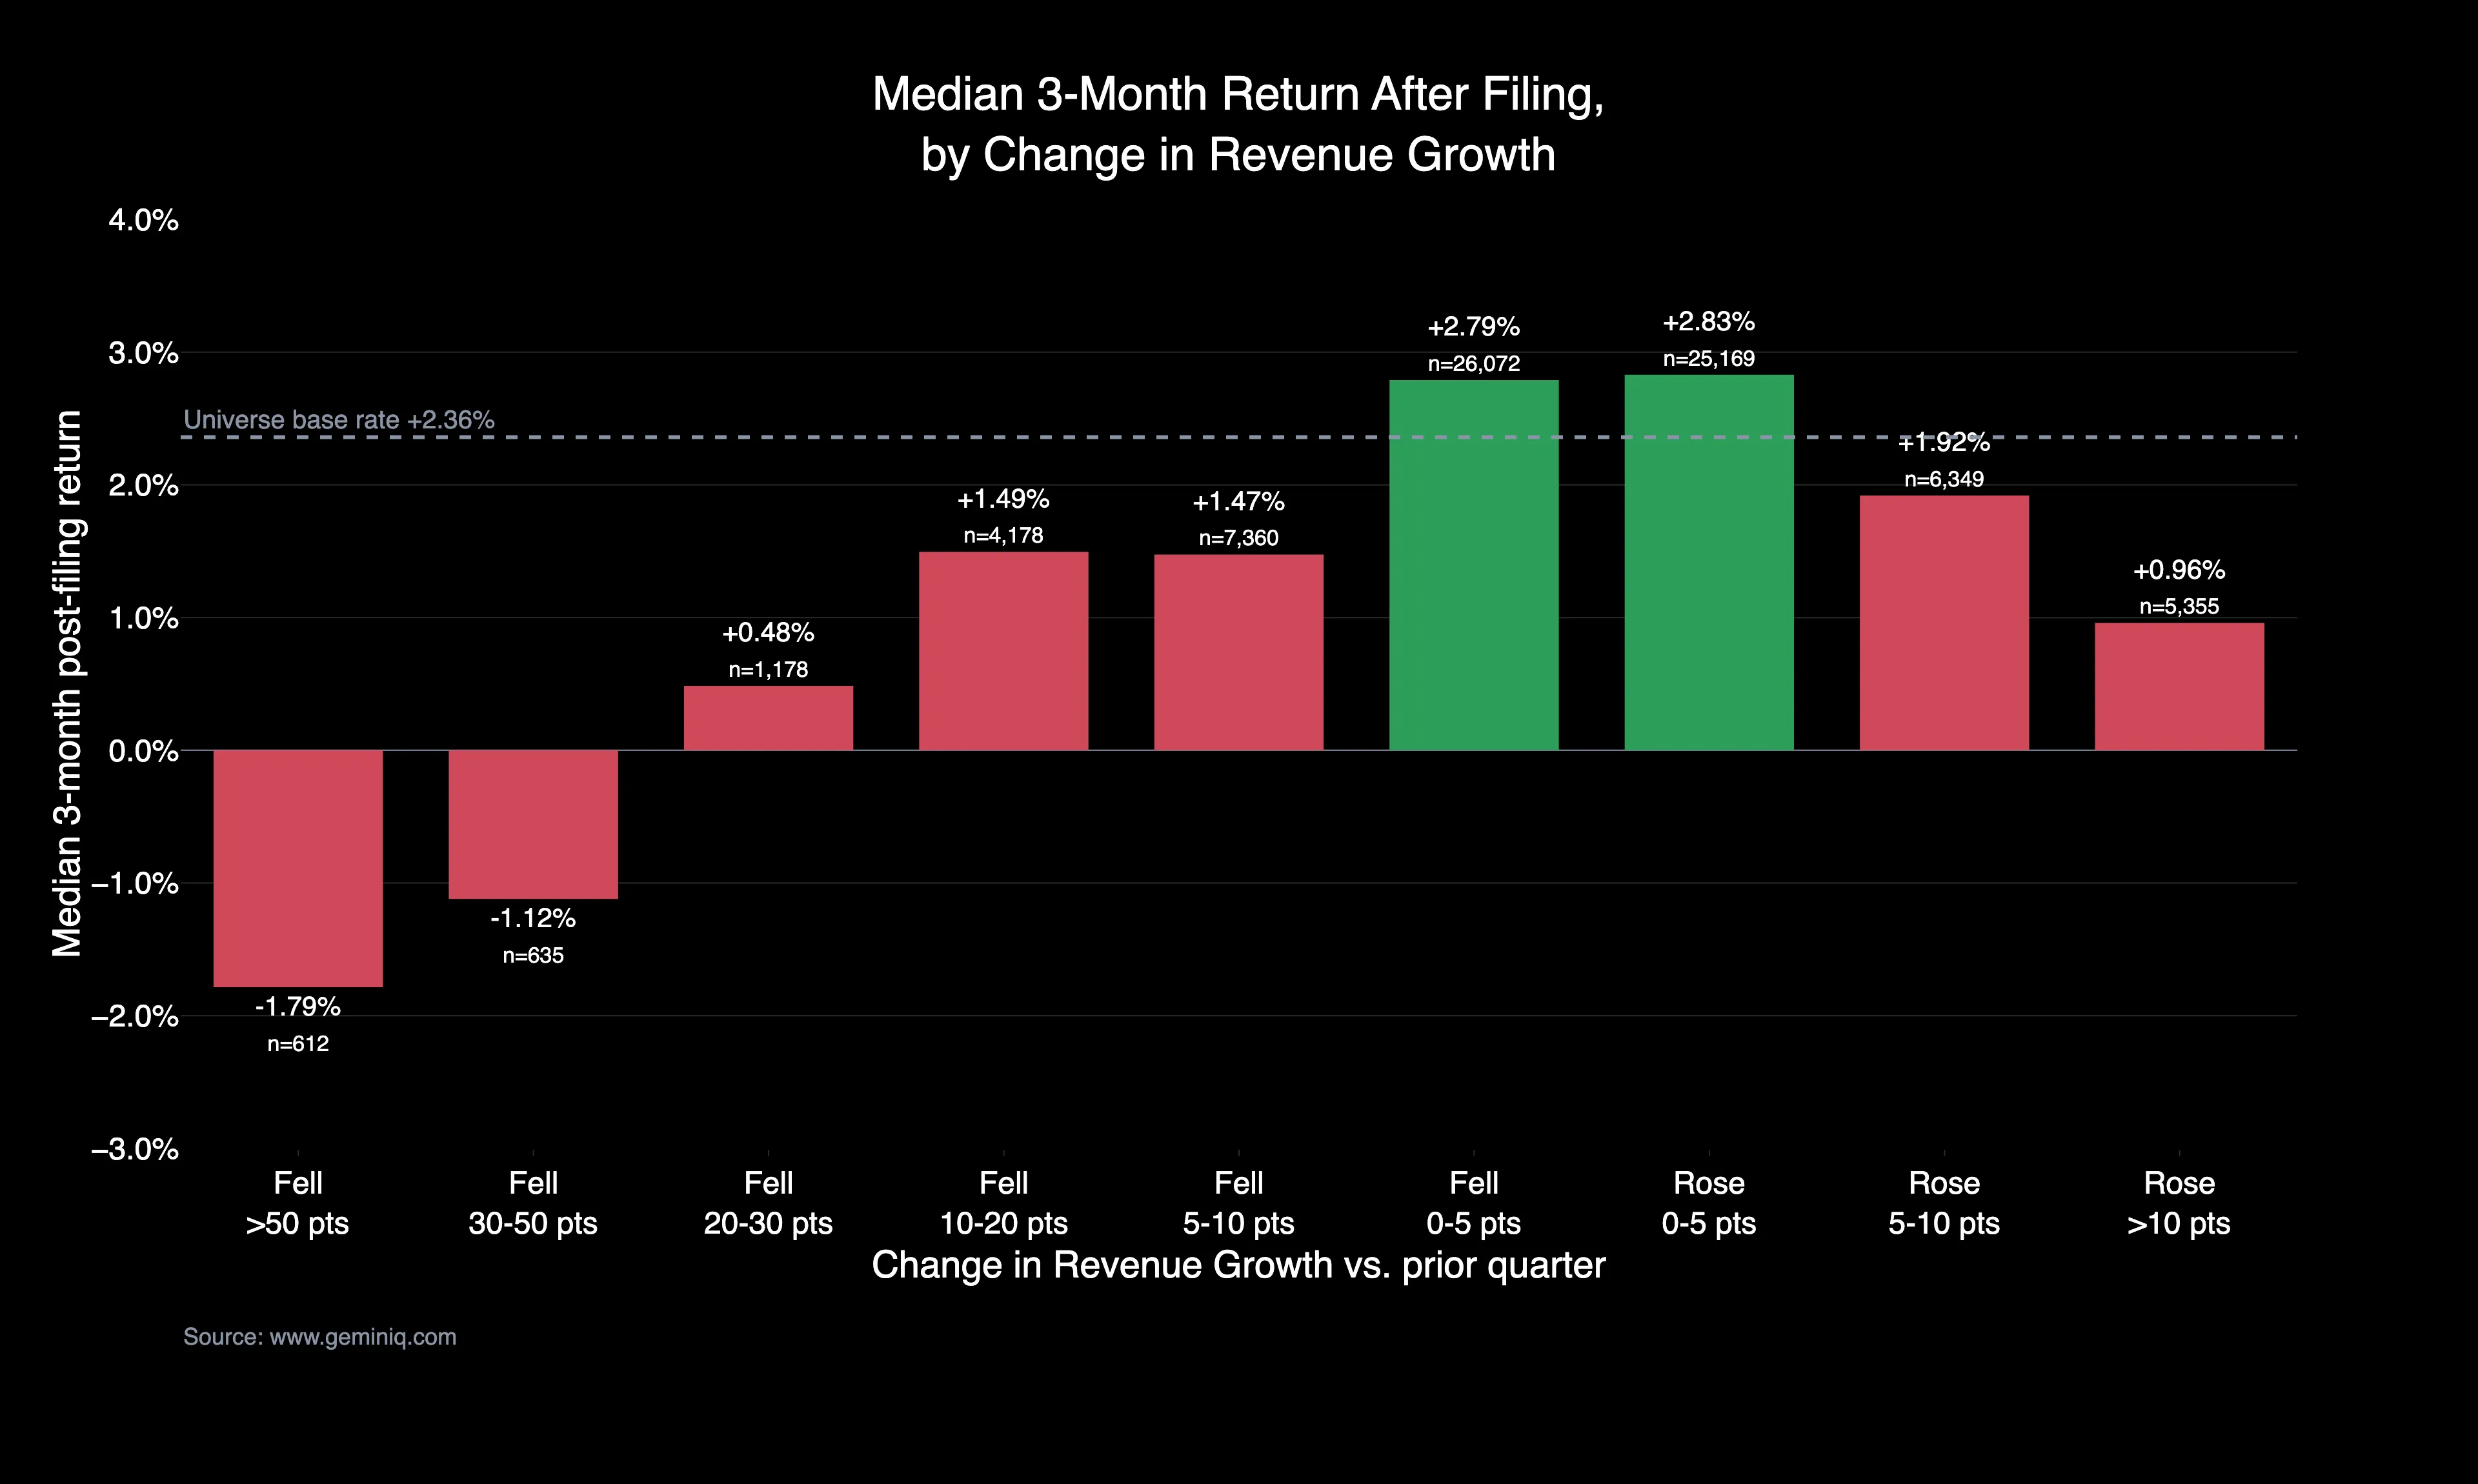
Two things in that table deserve more attention than the headline. The first is how little a modest slowdown cost. A company whose growth rate slipped 5 to 10 points still posted a median +1.48% over the next three months and was positive 53.8% of the time — barely distinguishable from the universe. The panic that attaches to a single soft quarter is not supported by what followed one.
The second is the bottom row. Filings where growth accelerated by more than 10 points returned a median +0.96%, worse than every bucket from a 5-point decline upward and 1.40 points below the base rate. The market rewards improvement right up until improvement becomes extreme, at which point the filing is arriving into a price that already assumed it.
C3.ai and Micron: Same Deceleration, Opposite Outcomes
C3.ai sits near the edge of this distribution, and its filings track the gradient almost exactly. Its Revenue Growth fell 10.93 points, then 12.50 points, then 18.06 points, then 19.45 points across four consecutive filings — a company sliding down the table one row at a time. Trailing revenue went from $389.056 Million to $250.268 Million over the same stretch. The market's reaction was not uniform, though. The three months after the September 2025 10-Q cost 8.20%. The three months after the December filing cost 50.41%. The three months after the March 2026 filing gained 16.31%. Same direction of travel in the filings, three completely different outcomes.
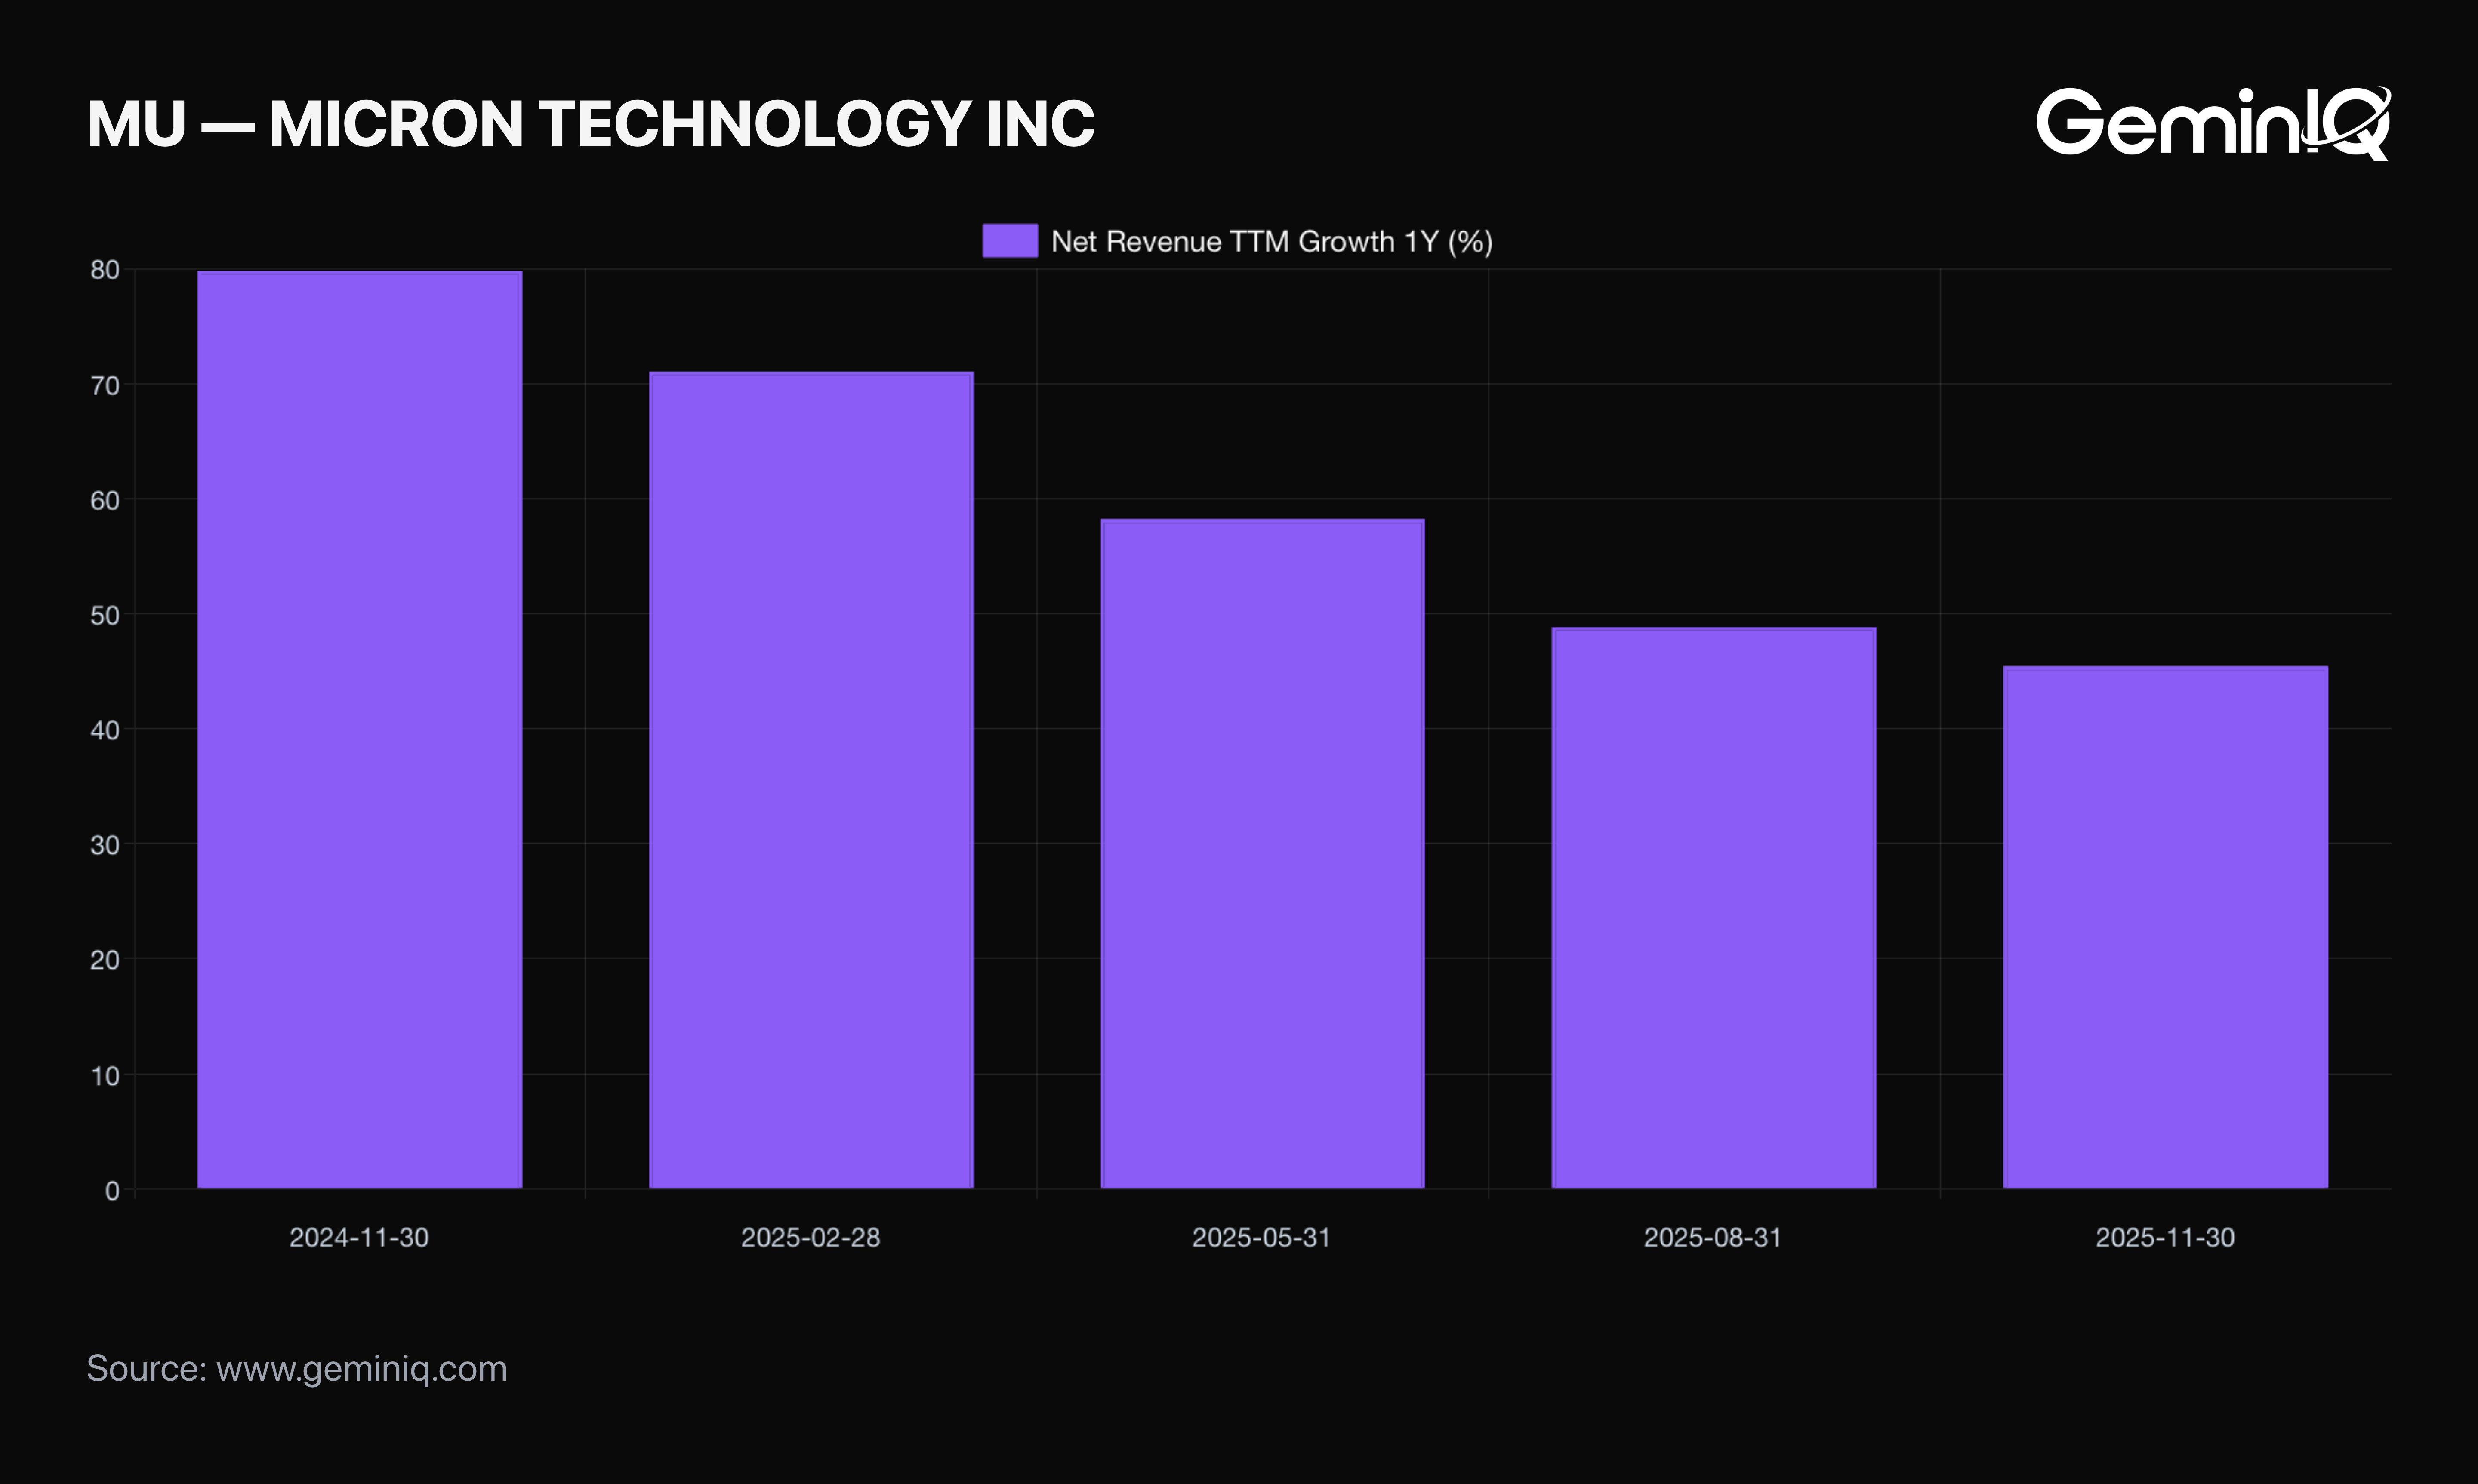
Then there is Micron, which ran the same play and got the opposite result. Micron's Revenue Growth peaked at 79.80% in its November 2024 quarter and then decelerated for four straight filings — 71.05%, 58.22%, 48.85%, 45.43%. On the table above, every one of those quarters lands in a bucket with a negative expected tilt. What actually followed each of those four filings was +14.76%, +24.90%, +41.57%, and +49.04% over the subsequent three months. A memory cycle decelerating from an extraordinary peak is still a business compounding at 45%, and the market priced the level rather than the derivative.
That contrast is the honest reading of this study. A bucket of 612 filings has a median. Your holding has an outcome.
How Revenue Growth Deceleration Was Measured
Growth is measured with GeminIQ's pre-calculated Revenue Growth metric — trailing-twelve-month revenue against the same period a year earlier, built from the as-filed Revenues tag in each company's XBRL. Deceleration is the change in that metric from one filing to the next. Nothing here is recalculated from a normalized third-party feed, which matters more than it sounds: when an aggregator reclassifies revenue items during normalization, the base changes and every growth rate built on it changes with it.
The screens are aggressive by design. Fiscal years where a company's quarterly revenue series fails an internal reconciliation are excluded entirely, along with the following year, because a single mis-tagged quarter fabricates a growth cliff a year later and a false deceleration the quarter after that. Two separate checks confirmed the result. Rebuilding the growth rate independently from raw XBRL tags reproduced the same curve. Re-measuring every return against other filings from the same calendar quarter — which strips out market direction entirely — preserved the gradient. That second test earned its keep, because it dissolved a different pattern in the twelve-month annual data that turned out to be recession timing rather than a real effect. The full ruleset is documented in our filing data study methodology, and the broader question of what filing quality does to subsequent returns is covered in how stocks react after earnings.
How to Check a Slowdown in Your Own Holdings
You can run this on anything you own in about ninety seconds. Open a company in Calculated Metrics and pull Revenue Growth across its last eight quarters. Write down the change from each quarter to the next — that single column of differences is the entire study. If the most recent change is a drop of 20 points or more, the filing sits in a bucket whose median three-month return was below the universe base rate of +2.36%. If it is a drop of 5 points or less, history says that quarter was nearly indistinguishable from any other filing.
Then do the part most people skip and check the level, not just the change. Micron's growth rate fell 34 points across four filings and never once dropped below 45%. C3.ai's fell 46 points and went negative. Same direction, entirely different businesses. The change in the growth rate tells you what the market is about to reprice. The level tells you what you actually own. You need the as-filed Financial Statements to see both, and the Price Variance view to see what the market did with them last time.
Four Current Filings: MercadoLibre, Eaton, Broadcom, Enphase
Three of the four companies below show clean, unflagged readings in their most recent quarter. The fourth carries two of the most extreme Point Changes in this entire dataset, earlier in its filing history — proof the 20-point threshold from the table above is a real, occasionally-triggered signal and not just a hypothetical bucket.
MercadoLibre (MELI)
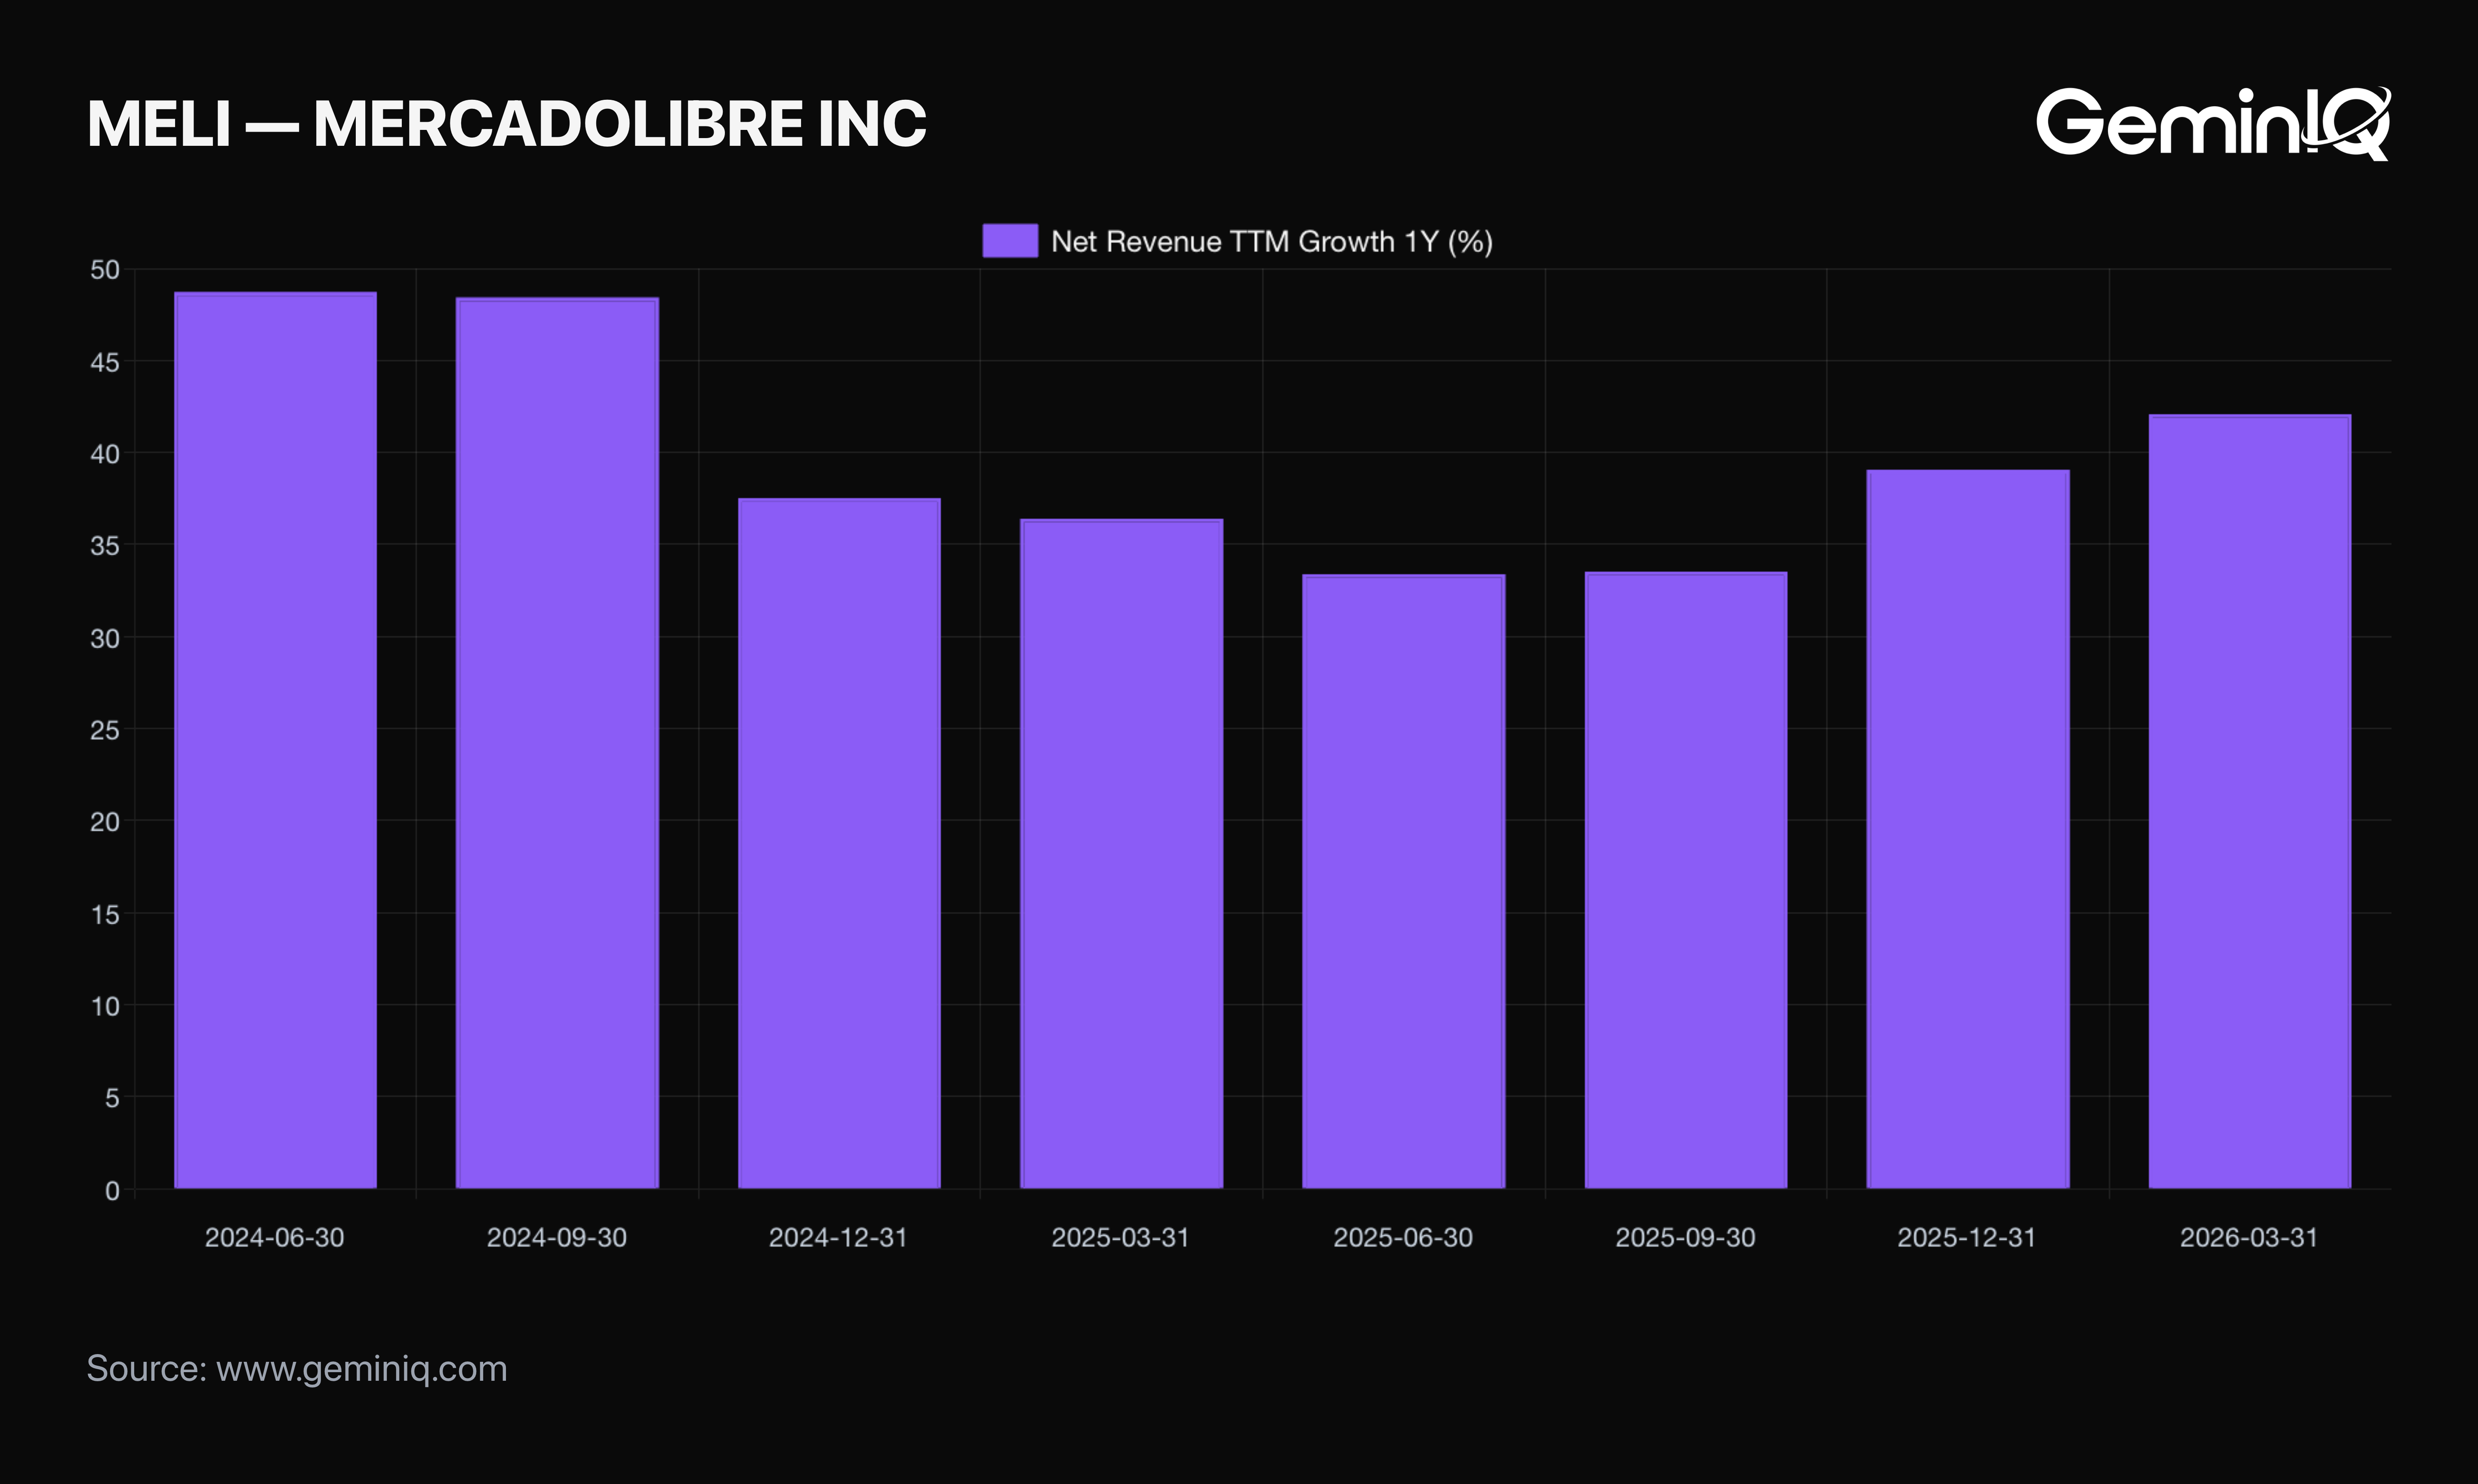
MercadoLibre's TTM Revenue Growth reads 42.11% for the quarter ended March 31, 2026 (filed May 8, 2026), up +3.05 points from the prior quarter. Growth did decelerate over the prior year, from a peak of 45.71% in June 2024 down to a trough of 34.52% in June 2025. But the sharpest single-quarter Point Change across that entire stretch was only -8.12 points — well inside the null-to-flagged range. Growth has since climbed back for two consecutive quarters.
Eaton (ETN)
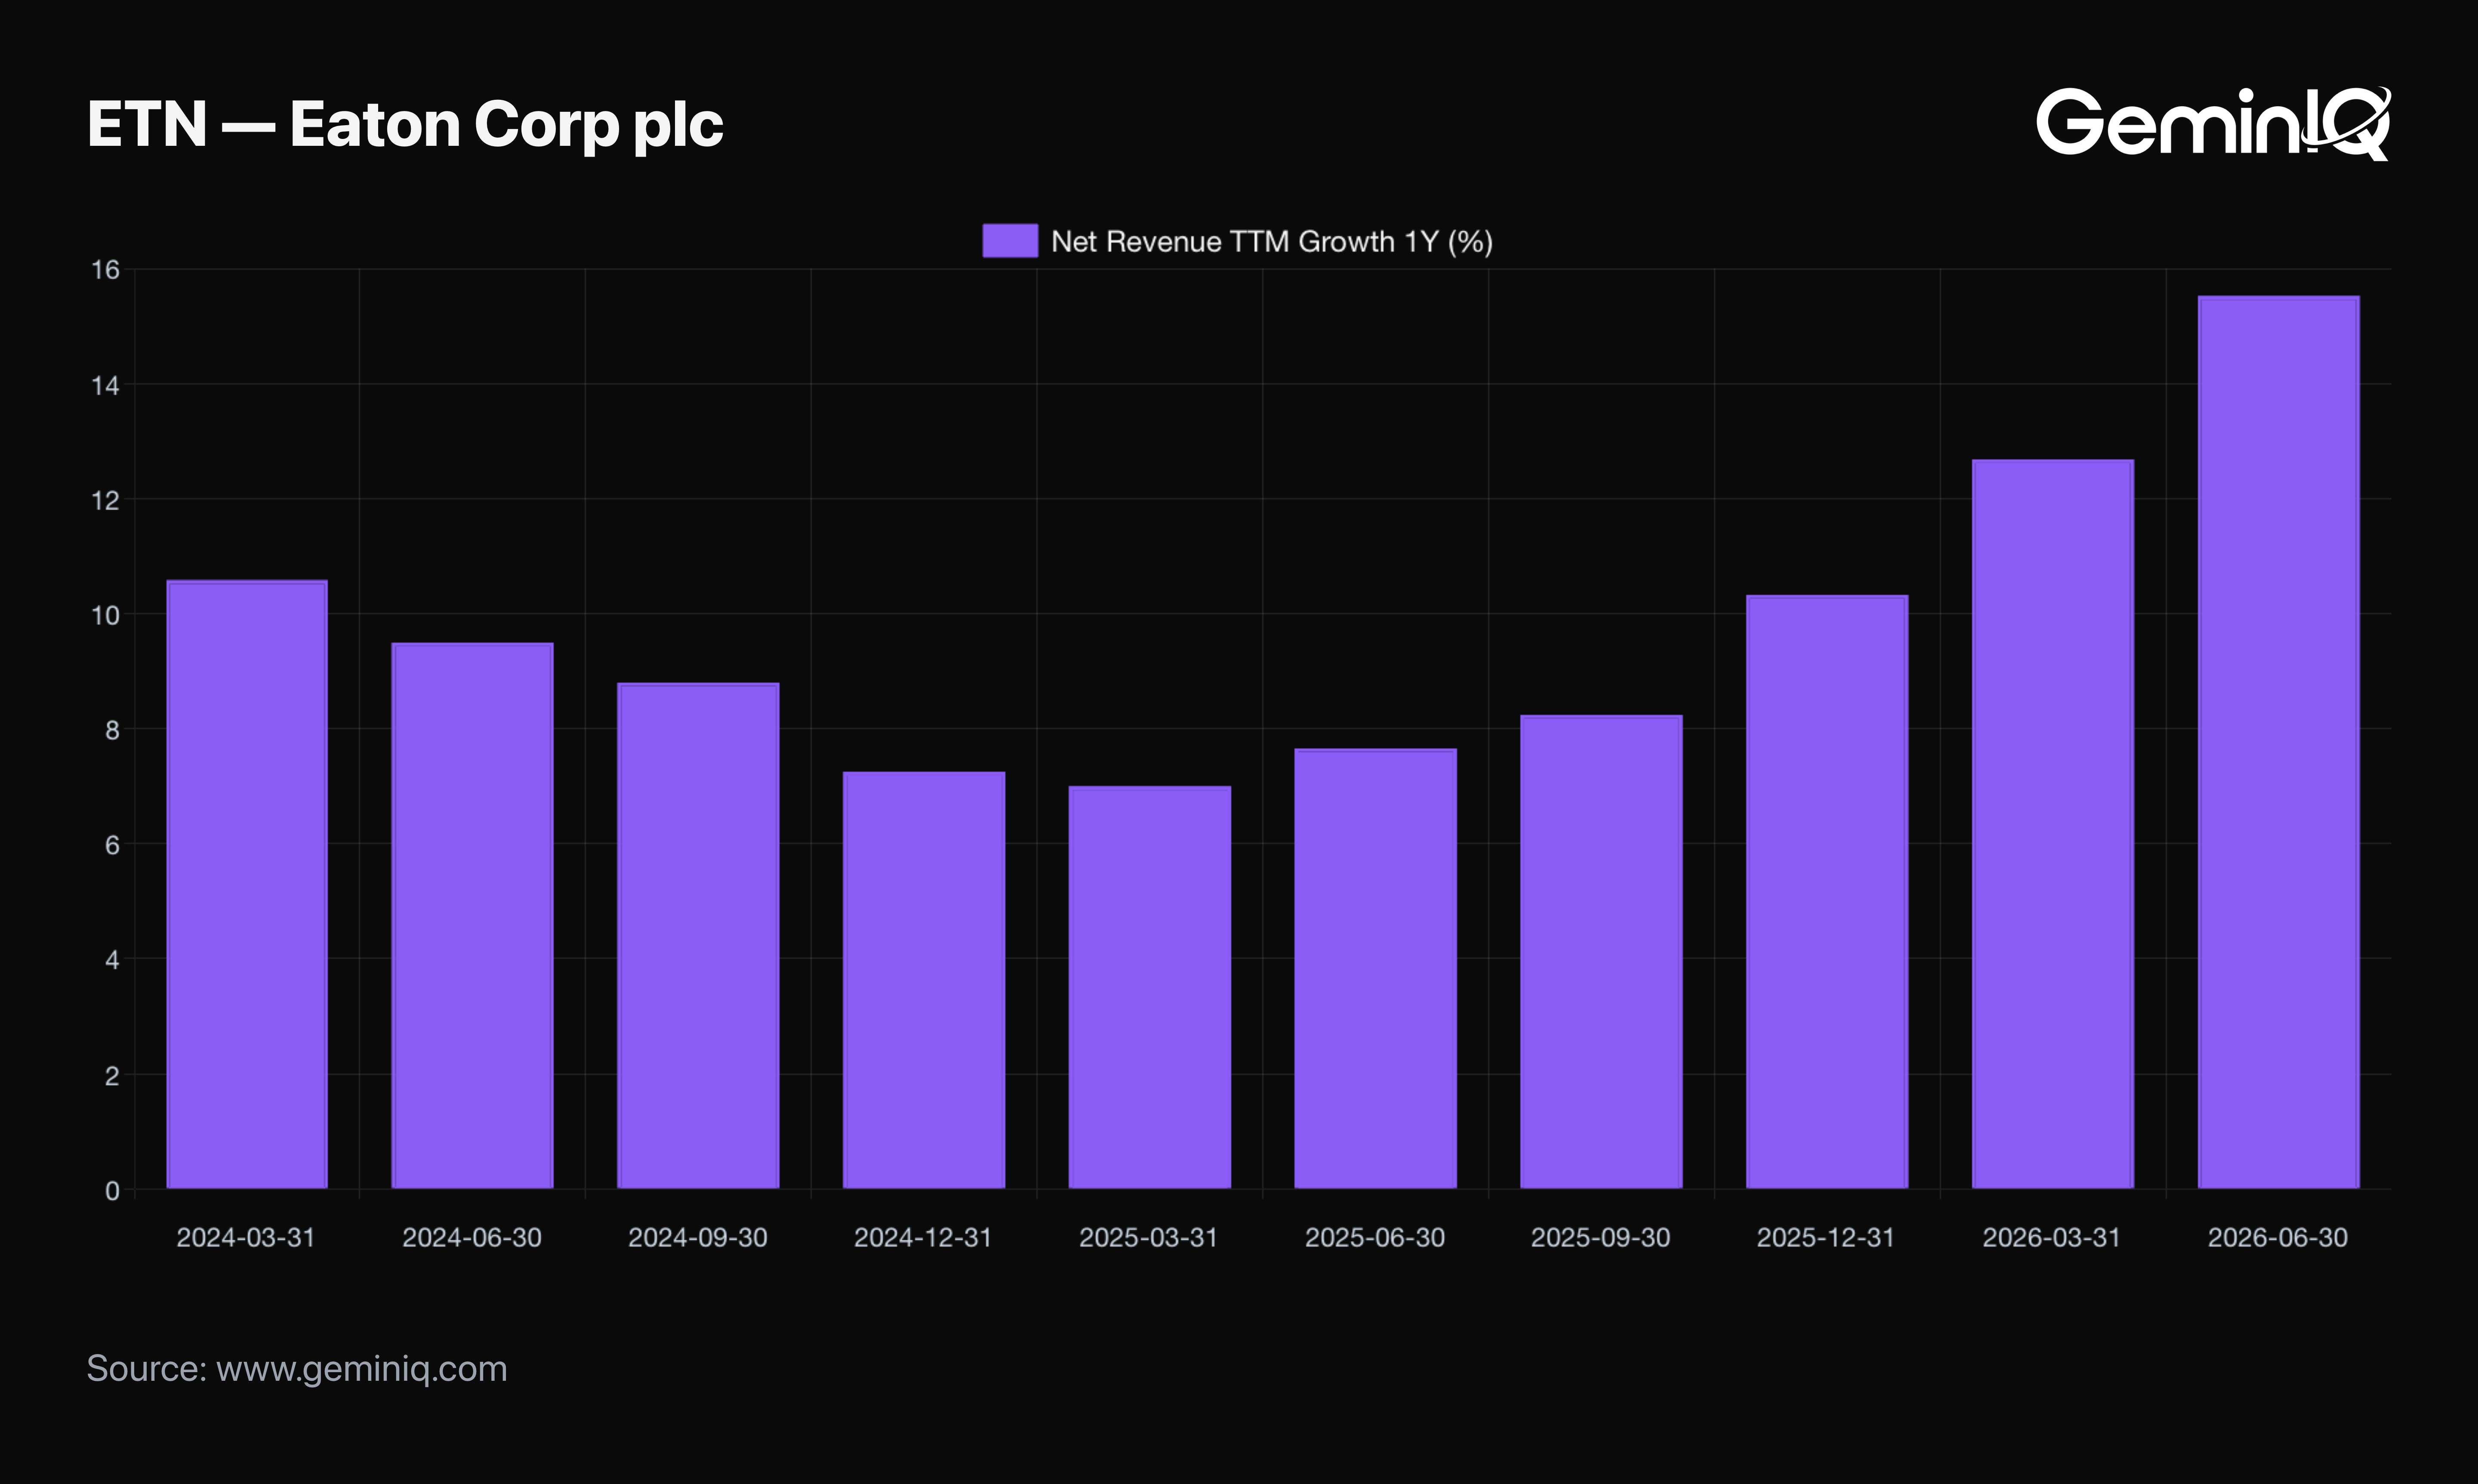
Eaton's TTM Revenue Growth reads 15.53% for the quarter ended June 30, 2026 (filed July 31, 2026), up +2.84 points on the quarter — the fifth straight quarterly increase off a trough of 7.00% in March 2025. No quarter in this stretch of Eaton's history produced a Point Change larger than roughly 2.4 points in either direction. It's a growth rate that moves gradually, nowhere near the scale needed to trip the 20-point threshold.
Broadcom (AVGO)
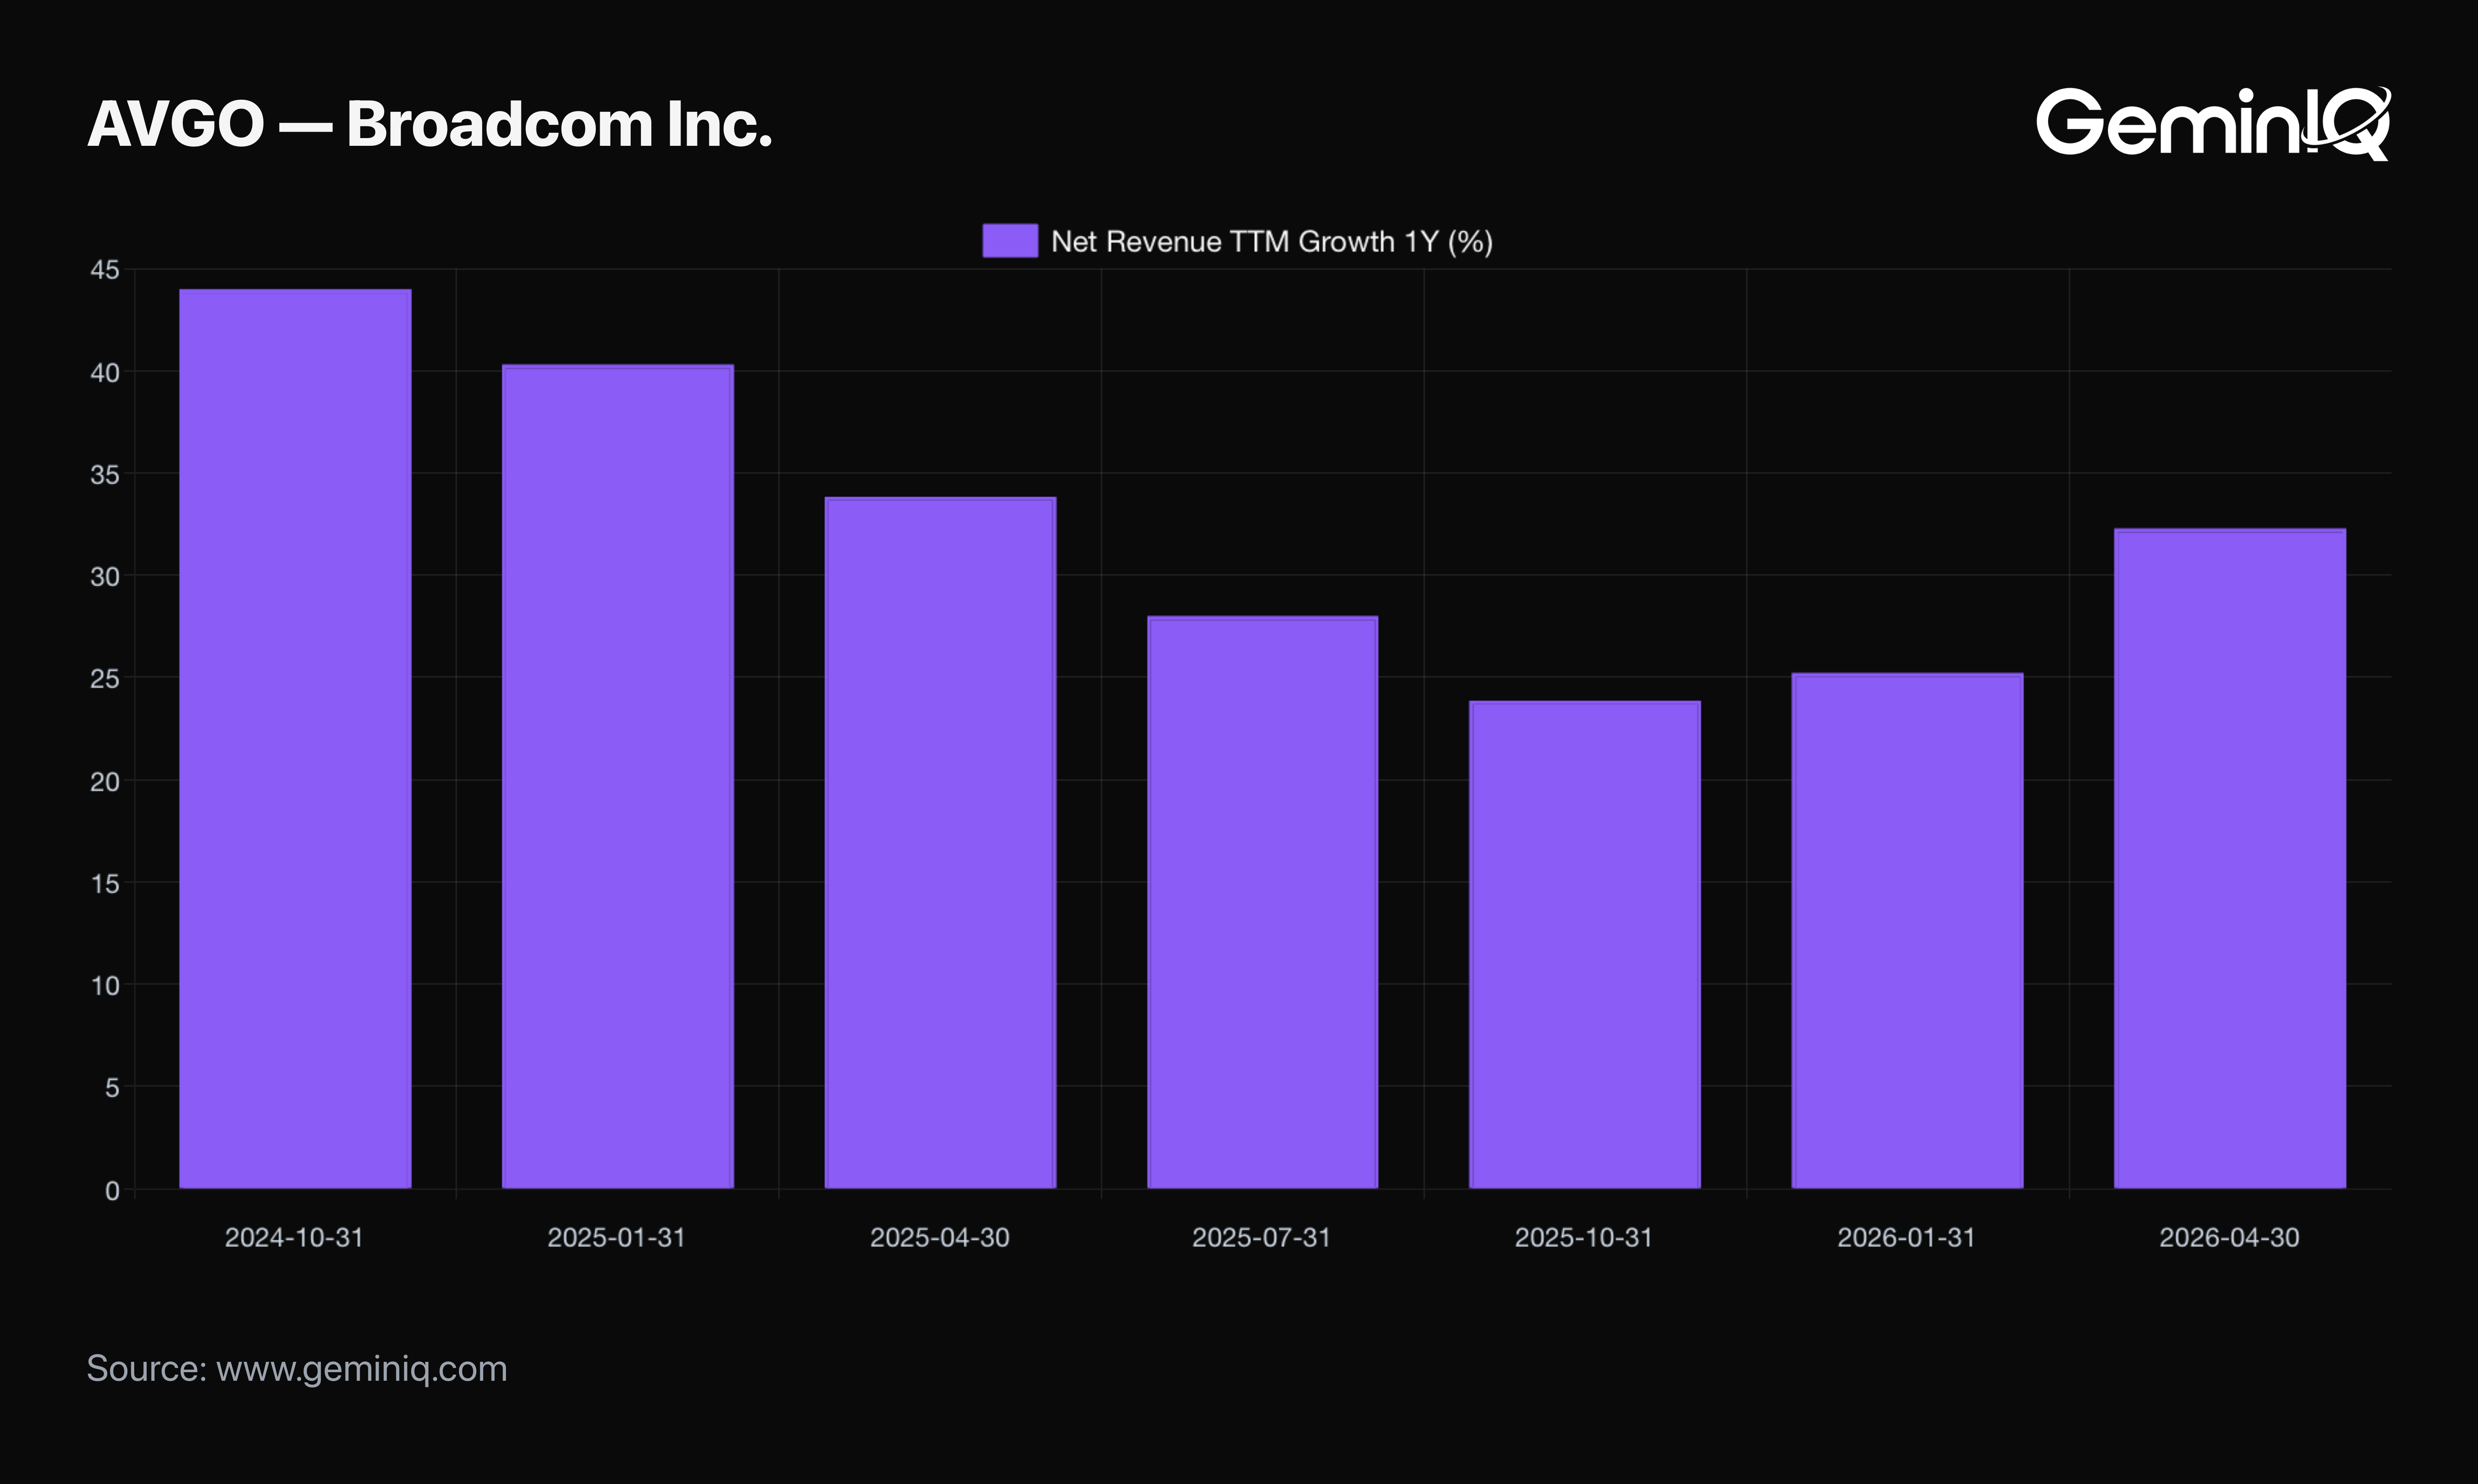
Broadcom's TTM Revenue Growth reads 32.29% for the quarter ended April 30, 2026 (filed June 9, 2026), up +7.07 points on the quarter — but the more instructive reading sits earlier in the series. Growth fell from a peak of 43.99% in October 2024 to a trough of 23.87% in October 2025 across four consecutive quarters of decline. No single one of those four quarters produced a Point Change past -20 points on its own — the sharpest was -6.45 points. Yet the cumulative four-quarter decline totaled just over 20 points. That is exactly why the level and the full-year trend matter, not one quarter's change: a business that shed roughly half its growth rate over a year without a single quarter's reading ever tripping the flagged threshold by itself.
Enphase Energy (ENPH)
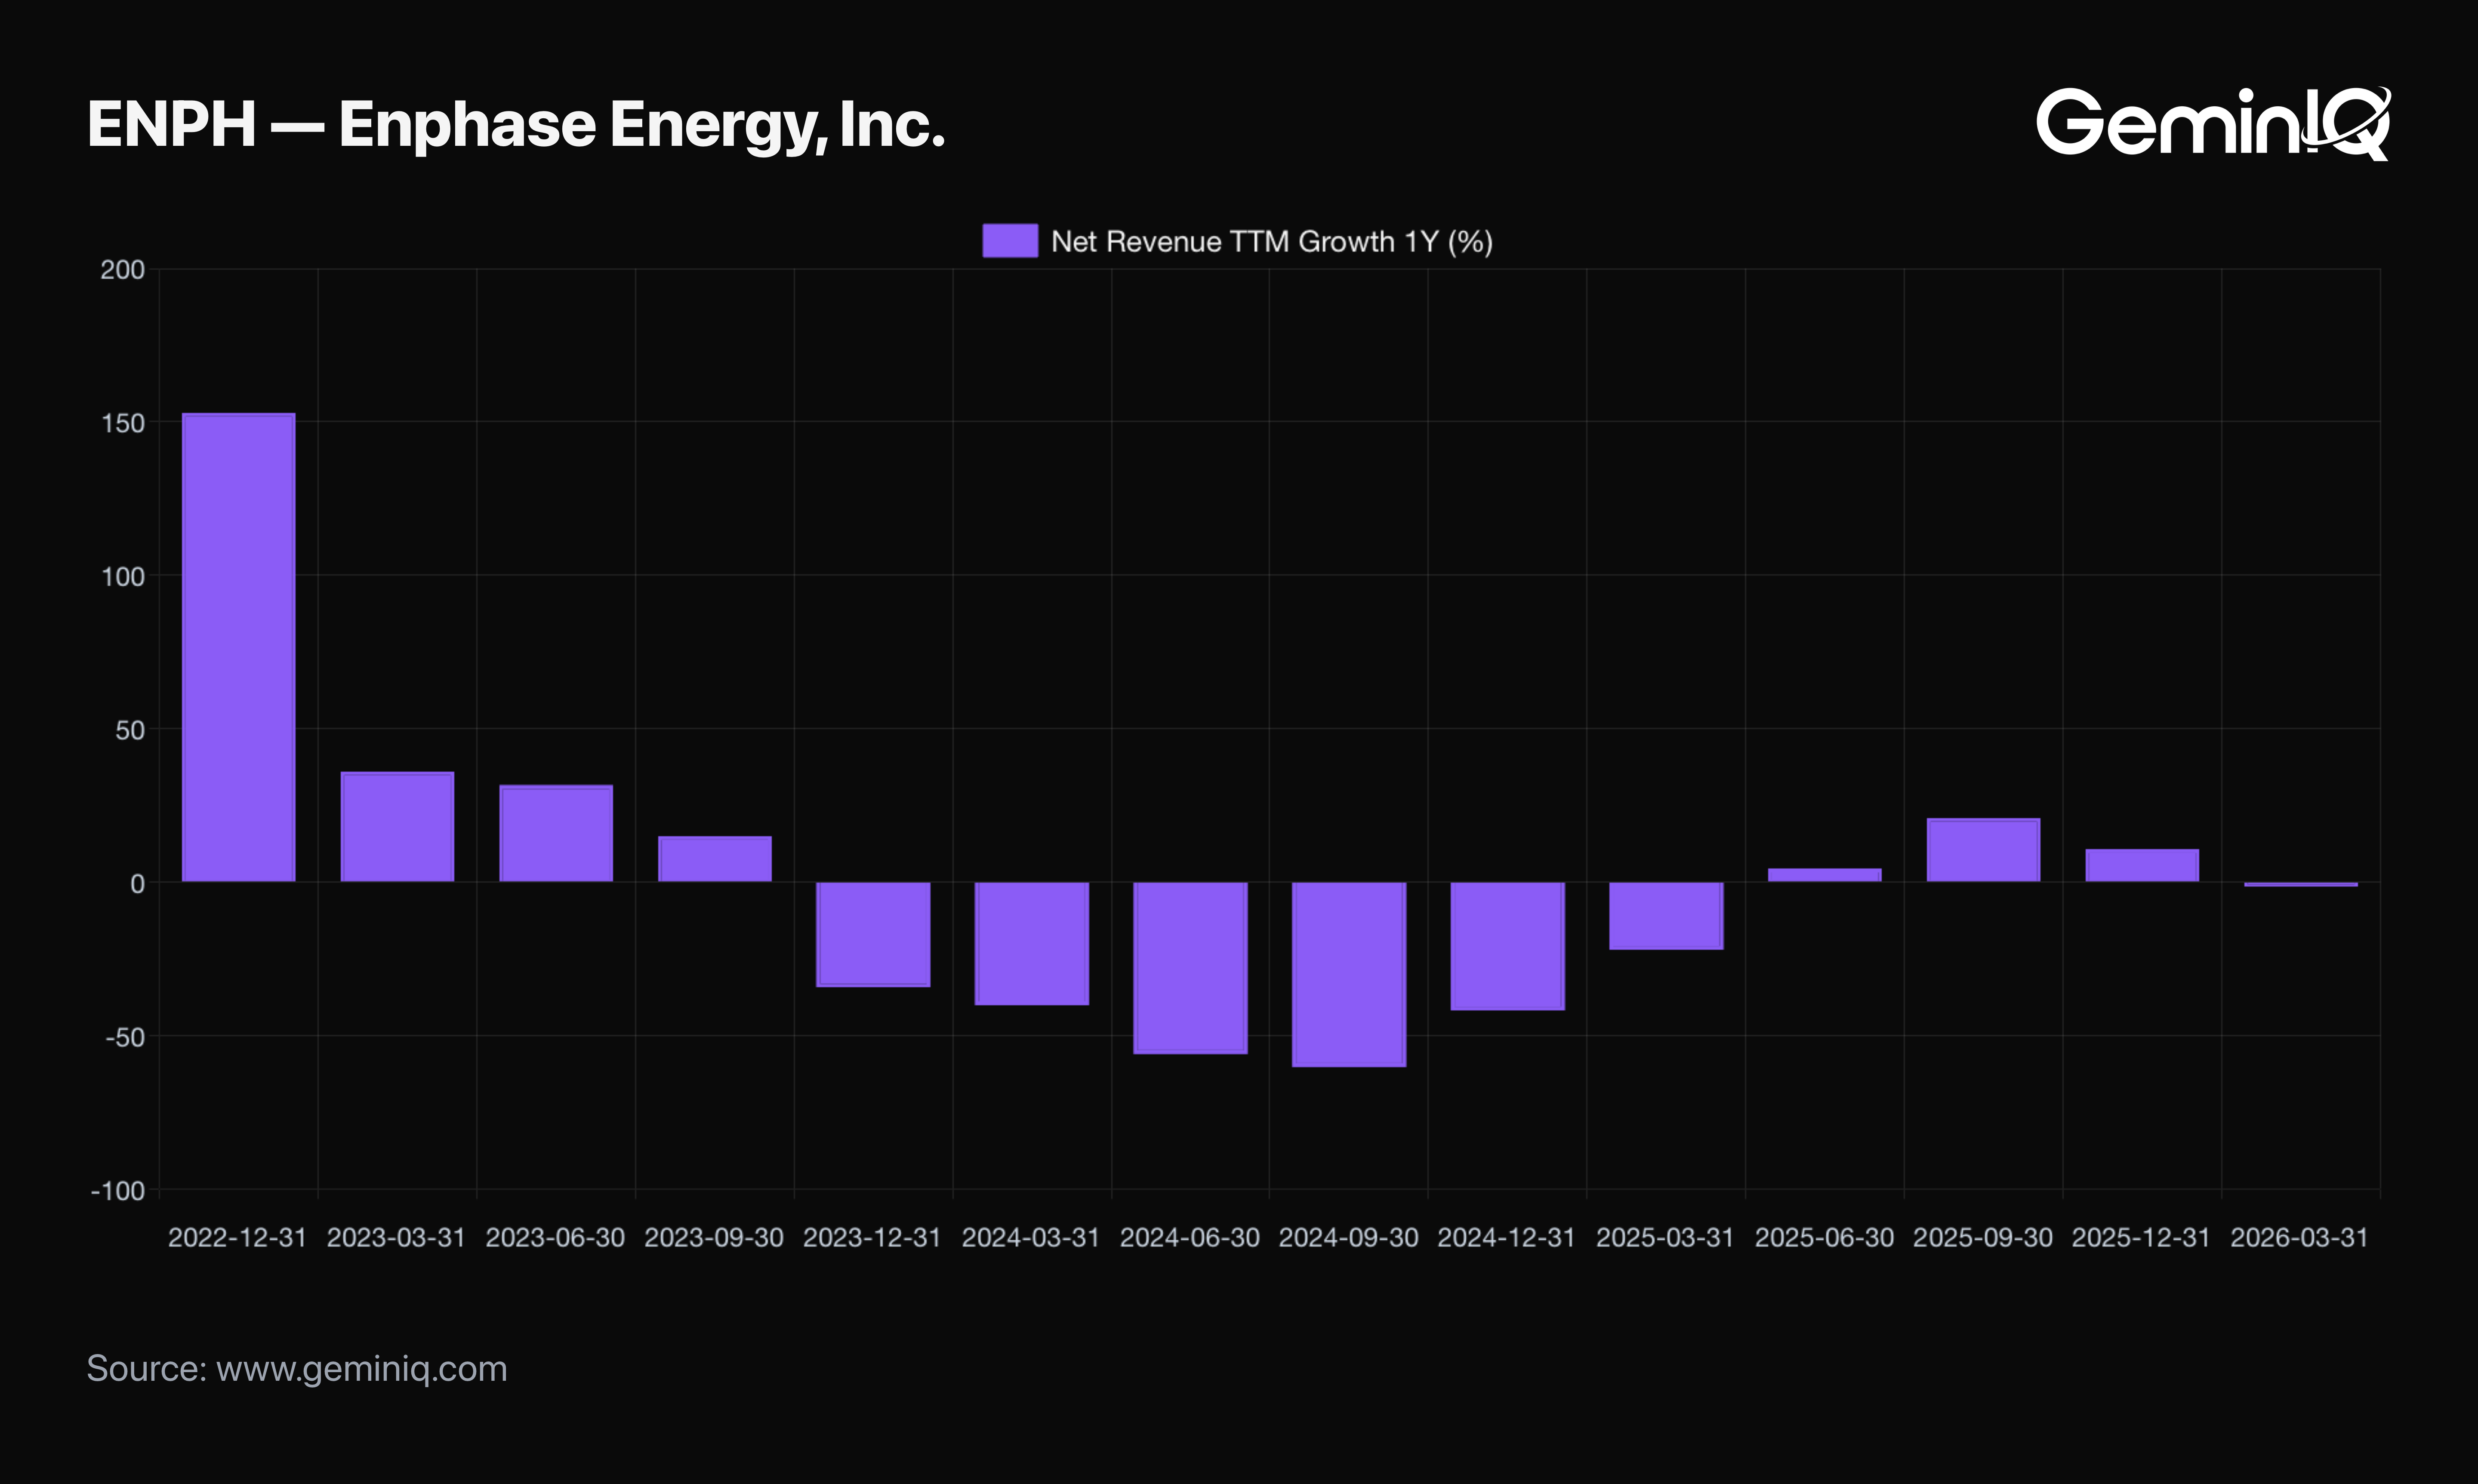
Enphase Energy is the company this check exists for. Its TTM Revenue Growth reads -1.64% for the quarter ended March 31, 2026 (filed April 28, 2026) — modest, and not itself a flagged reading. Three years earlier, though, Enphase produced two of the most extreme Point Changes in this metric's history. Growth fell from 153.02% in December 2022 to 36.09% in March 2023, a single-quarter Point Change of -116.93 points — nearly six times the flagged threshold on its own. Three quarters later, growth crossed from positive to negative outright, falling from 14.97% to -34.49%, a Point Change of -49.45 points. Growth kept falling to a trough of -60.36% by September 2024, then spent the next six quarters climbing back to nearly flat.
Frequently Asked Questions
How many filings does this study cover?
The bucket analysis covers 76,908 quarterly filings with both a measurable change in Revenue Growth and a clean three-month post-filing return, drawn from a database of 390,915 company-quarters across 15,064 companies filed between December 2004 and June 2026.
Does a revenue growth slowdown predict a stock decline?
No. This study measures historical association across a sample, not prediction. Quarters with a sharp growth-rate decline were followed by weaker median returns than the universe base rate over the 2004–2026 window. That is a statement about what happened in a large sample, not a forecast for any individual company, and the Micron case in this post is one of thousands where the association did not hold.
Can a company decelerate without any single quarter tripping the threshold?
Yes, and it is the way a real slowdown most easily hides from this check. Broadcom's TTM Revenue Growth fell from a peak of 43.99% in October 2024 to a trough of 23.87% in October 2025 across four consecutive quarters of decline. The sharpest single-quarter Point Change in that stretch was only -6.45 points — nowhere near the flagged threshold — yet the cumulative four-quarter decline totaled just over 20 points. A business can shed roughly half its growth rate over a year without one filing ever tripping the threshold by itself, which is why the column of differences is worth reading across a full year rather than one row at a time.
What is the sample size for the sharpest deceleration bucket?
612 filings across 383 companies. That clears the 200-filing minimum this series requires before any conclusion is drawn from a bucket, though it is the smallest group in the study and the least precisely measured.
Why measure growth on trailing-twelve-month revenue instead of a single quarter?
Quarterly revenue is seasonal — a retailer's fourth quarter dwarfs its first every year. Trailing-twelve-month revenue sums four quarters, which removes the seasonal distortion and makes the growth rate comparable across periods and across companies. It also proved far more robust to filing-level tagging faults during this study's data validation.
Why does the study use a three-month window rather than twelve?
A 10-Q carries roughly three months of post-filing reaction before the next filing supersedes it; only a 10-K carries a full twelve. Since the quarter-over-quarter change in growth rate is measured on quarterly filings, three months is the window those filings actually support.
Wall Street's data. Main Street's price.
Institutional terminals charge thousands a year for as-filed accuracy. GeminIQ gives you the same thing for a fraction of the cost: financials built directly from raw SEC EDGAR filings, not third-party APIs, with full XBRL traceability back to the original 10-K or 10-Q. No normalized guesswork, just calculated metrics, charts, screeners, and watchlists built on numbers exactly as the company reported them. Start researching now at GeminIQ.com.
All financial figures cited in this article reference MercadoLibre, Inc.'s Q1 FY2026 10-Q (filed May 8, 2026, period ending March 31, 2026). All SEC filings are publicly available at SEC EDGAR.
All financial figures cited in this article reference Eaton Corporation plc's Q2 FY2026 10-Q (filed July 31, 2026, period ending June 30, 2026). All SEC filings are publicly available at SEC EDGAR.
All financial figures cited in this article reference Broadcom Inc.'s Q2 FY2026 10-Q (filed June 9, 2026, period ending April 30, 2026). All SEC filings are publicly available at SEC EDGAR.
All financial figures cited in this article reference Enphase Energy, Inc.'s Q1 FY2026 10-Q (filed April 28, 2026, period ending March 31, 2026). All SEC filings are publicly available at SEC EDGAR.
Data Appendix: Universe of 15,064 companies and 390,915 company-quarters filed December 2004 through June 2026, drawn from each company's as-filed 10-K and 10-Q filings, publicly available on SEC EDGAR. Growth is GeminIQ's pre-calculated Revenue Growth metric (trailing-twelve-month revenue versus the same period one year prior, built from the as-filed Revenues tag); deceleration is the change in that metric between consecutive filings. The bucket analysis uses the 76,908 quarterly filings carrying both a computable change and a three-month post-filing return. Fiscal years failing an internal quarterly-revenue reconciliation were excluded along with the following year; filings from financial-sector issuers, non-operating partnerships and trusts, and periods with a detected acquisition are flagged in the underlying extract. Post-filing returns are cumulative from each filing's filed date, winsorized at the top and bottom 1%, and never compounded; universe base rate +3.49% mean / +2.36% median across the 76,908 filings. Results were confirmed against an independently reconstructed growth measure and against returns re-measured relative to same-calendar-quarter filing cohorts. Methodology: filing data study methodology.
Disclaimer: The content in this blog is for educational and entertainment purposes only and does not constitute financial, legal, or tax advice. Investing involves risk, including the loss of principal. The views expressed are my own and not intended as financial advice or a guarantee of future performance.