
Stock Compensation Exceeds Free Cash Flow

By Chad Hartman
Published · Last updated
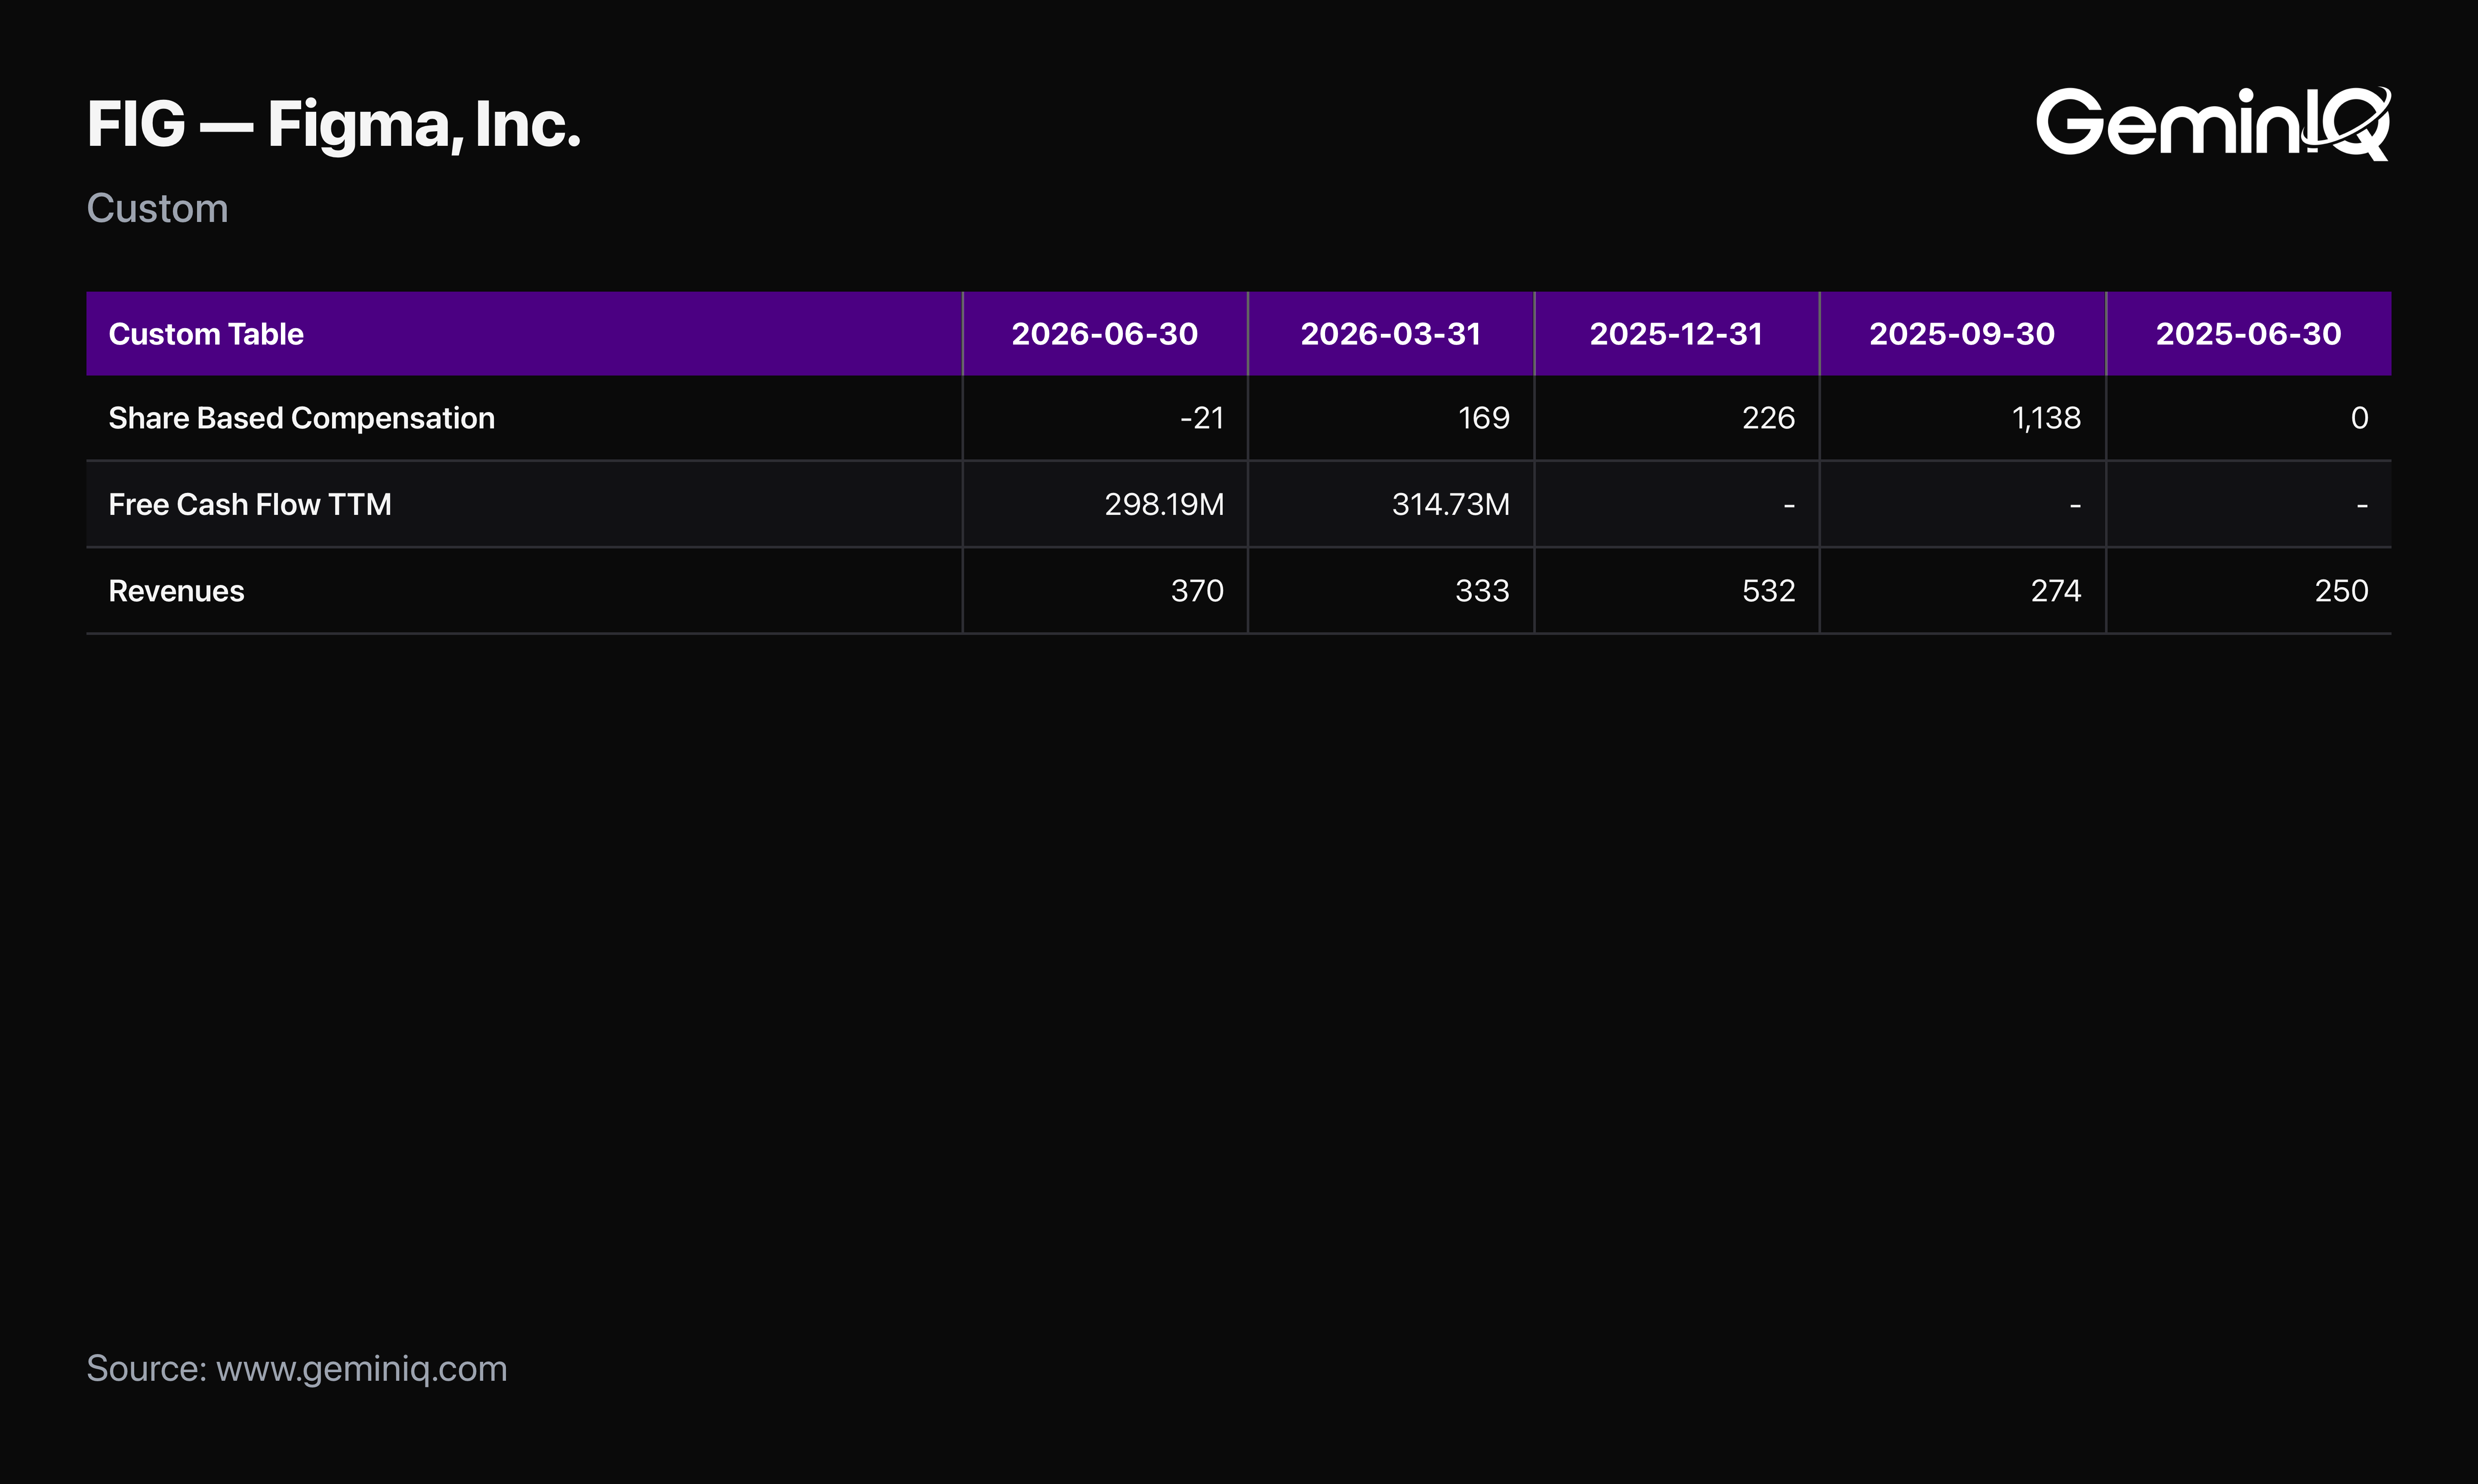
Figma paid out $1.555 Billion in trailing-twelve-month stock-based compensation — more than the company's entire $1.510 Billion in trailing revenue, even though free cash flow is still positive. Stock-based compensation gets added back on the cash flow statement because it isn't a cash outflow. That accounting treatment is accurate. It also means a company can report cash flow figures that look far healthier than the actual economic cost being handed to employees in newly issued shares, a gap that stays invisible to anyone reading only the free cash flow line.
This leaderboard reads GeminIQ's calculated Stock Compensation and Free Cash Flow figures across GeminIQ's current cross-sectional filing snapshot — 6,095 companies with data through at least February 2025 — restricted to companies with at least $100 Million in trailing revenue, stock compensation equal to at least 2% of that revenue, free cash flow not driven to an extreme by unrelated capital-intensive capex, and the Finance, Insurance & Real Estate sector excluded, since a bank or asset manager's cash flow statement isn't comparable to an operating company's. 723 companies meet that bar. 262 of them — 36.2% — currently show stock compensation exceeding free cash flow outright.
The Ranking
| Rank | Company | Ticker | Stock Compensation (TTM) | Free Cash Flow (TTM) | Excess |
|---|---|---|---|---|---|
| 1 | Amazon.com Inc | AMZN | $19.314 Billion | -$11.625 Billion | $30.939 Billion |
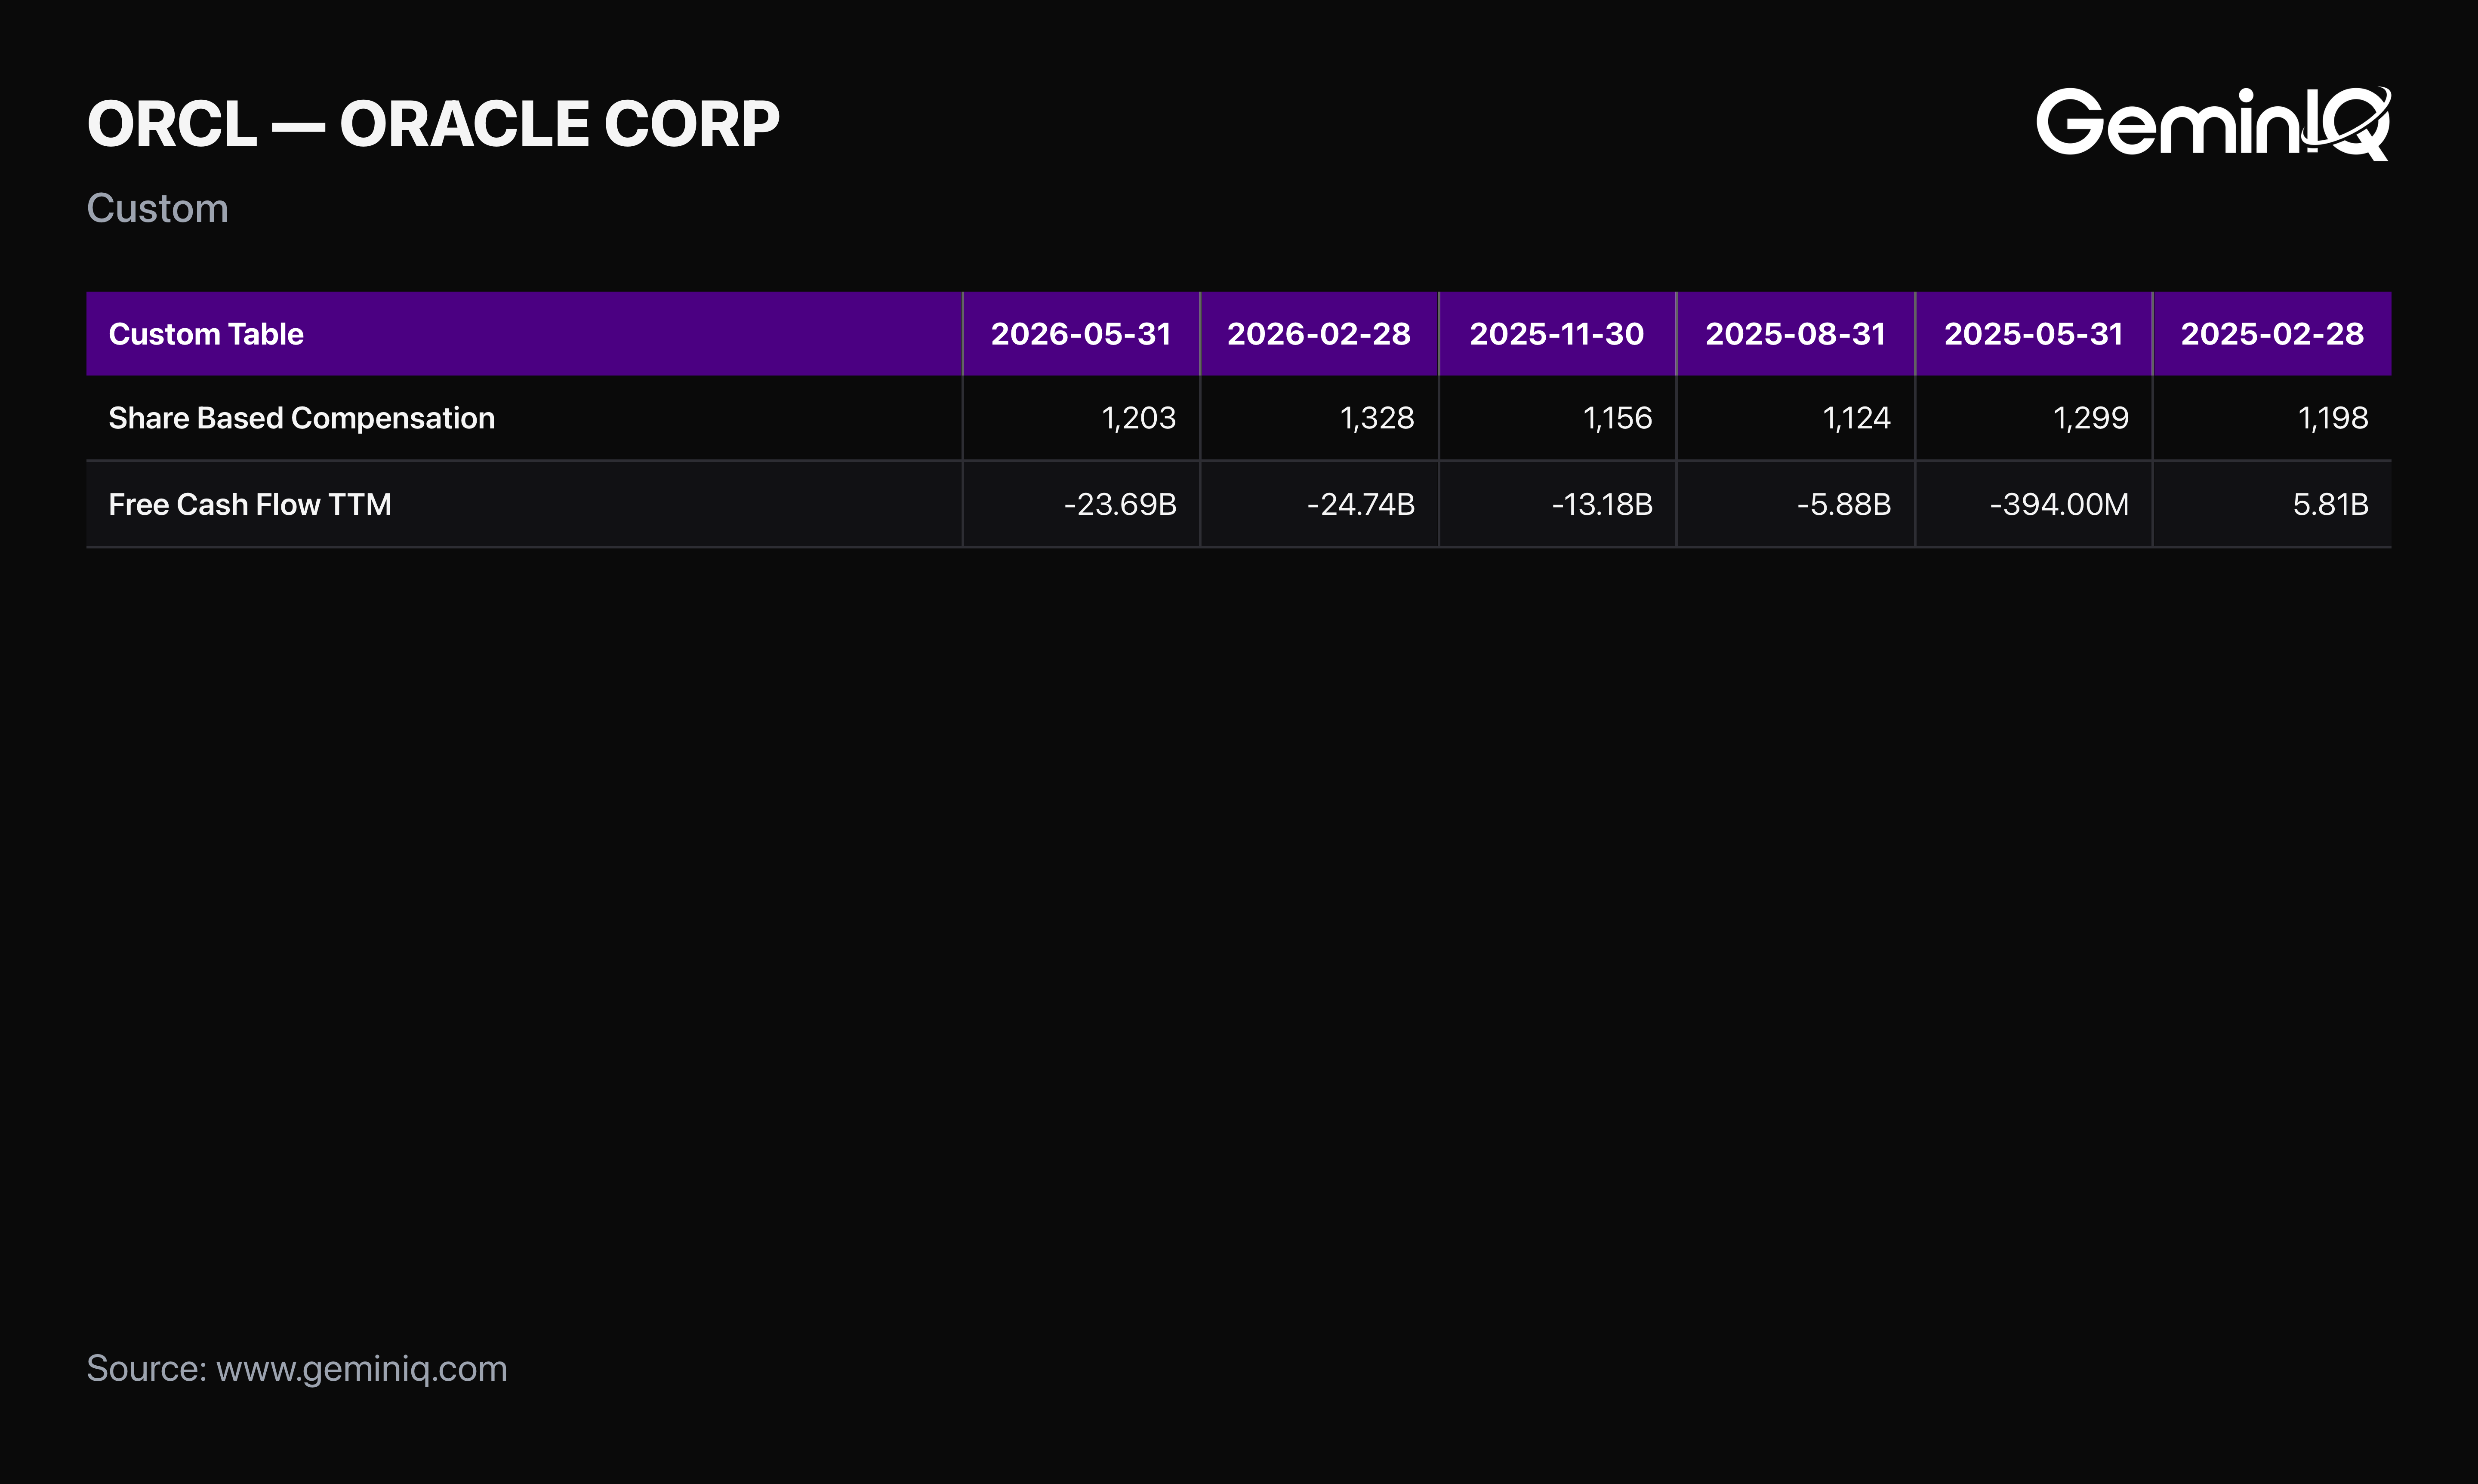
| 2 | Oracle Corp | ORCL | $4.811 Billion | -$23.686 Billion | $28.497 Billion |
| 3 | Figma, Inc. | FIG | $1.555 Billion | $0.298 Billion | $1.256 Billion |
| 4 | Coherent Corp. | COHR | $0.186 Billion | -$1.023 Billion | $1.210 Billion |
| 5 | StubHub Holdings, Inc. | STUB | $1.517 Billion | $0.513 Billion | $1.004 Billion |
| 6 | Axon Enterprise, Inc. | AXON | $0.633 Billion | $0.133 Billion | $0.500 Billion |
| 7 | fuboTV Inc. | FUBO | $0.066 Billion | -$0.409 Billion | $0.475 Billion |
| 8 | Rocket Lab Corp | RKLB | $0.090 Billion | -$0.379 Billion | $0.469 Billion |
| 9 | Snowflake Inc. | SNOW | $1.623 Billion | $1.170 Billion | $0.453 Billion |
| 10 | Tempus AI, Inc. | TEM | $0.186 Billion | -$0.263 Billion | $0.449 Billion |
| 11 | Guardant Health, Inc. | GH | $0.191 Billion | -$0.241 Billion | $0.432 Billion |
| 12 | Liberty Global Ltd. | LBTYA | $0.168 Billion | -$0.255 Billion | $0.422 Billion |
| 13 | Sunrun Inc. | RUN | $0.105 Billion | -$0.315 Billion | $0.420 Billion |
| 14 | Hinge Health, Inc. | HNGE | $0.662 Billion | $0.272 Billion | $0.390 Billion |
| 15 | Confluent, Inc. | CFLT | $0.397 Billion | $0.061 Billion | $0.337 Billion |
Figma: Stock Compensation Larger Than Total Revenue
Figma is the most striking ratio on this list, not the largest dollar figure. Trailing stock compensation of $1.555 Billion is larger than the company's entire trailing revenue of $1.510 Billion — stock compensation equal to 102.9% of everything Figma brought in. Free cash flow is still positive, at $0.298 Billion, which is precisely what makes the comparison worth making: a company can look cash-flow-positive while its stock-compensation expense alone would have erased more than the entire top line.
Oracle: The Largest Free Cash Flow Deficit on the List
Oracle carries the widest free cash flow deficit of any company in this leaderboard: negative $23.686 Billion, against $4.811 Billion in stock compensation — 7.1% of trailing revenue. Oracle's free cash flow figure reflects a company spending well beyond its operating cash generation, and the stock-compensation line is a real, ongoing cost layered on top of that gap rather than a rounding error inside it.
Snowflake: A Smaller Gap, at a Company That's Already Cash-Flow Positive
Snowflake shows the pattern at a more mature scale: $1.623 Billion in stock compensation, still exceeding $1.170 Billion in free cash flow despite Snowflake generating meaningfully positive cash flow on $5.033 Billion in trailing revenue. Stock compensation here runs 32.2% of revenue — high enough that even solidly healthy free cash flow doesn't fully cover it.
Amazon: The Largest Dollar Gap, on a Different Comparison Than Its Buyback Record
Amazon tops this leaderboard by dollar scale rather than by ratio — stock compensation is a modest 2.5% of trailing revenue, but free cash flow is running negative $11.625 Billion over the same trailing twelve months, wide enough that the $19.314 Billion stock-compensation figure alone exceeds the entire cash shortfall. This is a different comparison than Amazon's decade-long stock-comp-versus-buyback record covered in GeminIQ's stock buybacks vs. stock compensation study: this leaderboard measures stock compensation against free cash flow, not against repurchase spending, and Amazon lands at the top of this one for a different reason — sheer scale, not an absent buyback program.
The Method
Stock Compensation and Free Cash Flow are both GeminIQ calculated figures, built directly from as-filed cash flow statement data on a trailing-twelve-month basis. The universe excludes the Finance, Insurance & Real Estate sector, where operating and free cash flow are structurally different concepts, and excludes companies whose free cash flow is deeply negative relative to revenue for reasons unrelated to stock compensation — chiefly heavy, ongoing capital expenditure in capital-intensive industries like utilities and infrastructure buildout — so the ranking isolates the stock-compensation effect rather than mixing it with an unrelated capex story.
Check Your Holdings
Pull up any position's Stock Compensation and Free Cash Flow figures on GeminIQ's Financial Statements view and compare the two directly. A company where stock compensation regularly runs close to or above free cash flow is diluting shareholders at a pace the cash flow statement alone won't show — a method for spotting that gap, not a verdict on any individual company's prospects.
Frequently Asked Questions
What does it mean when stock compensation exceeds free cash flow?
It means the non-cash stock-based compensation expense a company reports is larger than the actual cash left over after operating expenses and capital spending. Free cash flow figures typically add stock compensation back as a non-cash item, which can make cash flow look stronger than the total economic cost — including dilution to existing shareholders — actually is.
How many companies in GeminIQ's data show stock compensation exceeding free cash flow?
262 companies, out of a 723-company universe restricted to companies with meaningful stock compensation (at least 2% of trailing revenue) and free cash flow not distorted by unrelated heavy capital spending — 36.2% of that universe.
Is a high stock-compensation-to-free-cash-flow ratio always a red flag?
Not automatically. Early-stage, high-growth companies frequently pay a larger share of compensation in equity while still building toward sustained free cash flow, and the pattern is common across recent technology-sector IPOs. It is a data point worth checking directly rather than a standalone verdict — the more useful question is whether the ratio is improving or worsening as the company matures.
Why exclude the Finance, Insurance & Real Estate sector from this ranking?
Because operating cash flow at a bank, insurer, or asset manager reflects the ordinary movement of customer deposits, loans, and investment positions rather than the kind of operating cash generation a free cash flow comparison is designed to measure, making the figure not comparable to an operating company's.
Wall Street's data. Main Street's price.
Institutional terminals charge thousands a year for as-filed accuracy. GeminIQ gives you the same thing for a fraction of the cost: financials built directly from raw SEC EDGAR filings, not third-party APIs, with full XBRL traceability back to the original 10-K or 10-Q. No normalized guesswork, just calculated metrics, charts, screeners, and watchlists built on numbers exactly as the company reported them. Start researching now at GeminIQ.com.
Data Appendix: Universe drawn from GeminIQ's calculated Stock Compensation and Free Cash Flow metrics across GeminIQ's current cross-sectional filing snapshot of 6,095 companies, restricted to companies with at least $100 Million in trailing revenue and stock compensation equal to at least 2% of revenue, excluding the Finance, Insurance & Real Estate sector (723 companies), built from as-filed 10-K and 10-Q data publicly available on SEC EDGAR. Methodology: How GeminIQ Builds Filing Data Studies.
Disclaimer: The content in this blog is for educational and entertainment purposes only and does not constitute financial, legal, or tax advice. Investing involves risk, including the loss of principal. The views expressed are my own and not intended as financial advice or a guarantee of future performance.