
Stock Buybacks vs. Stock Compensation: Running in Place

By Chad Hartman
Published · Last updated
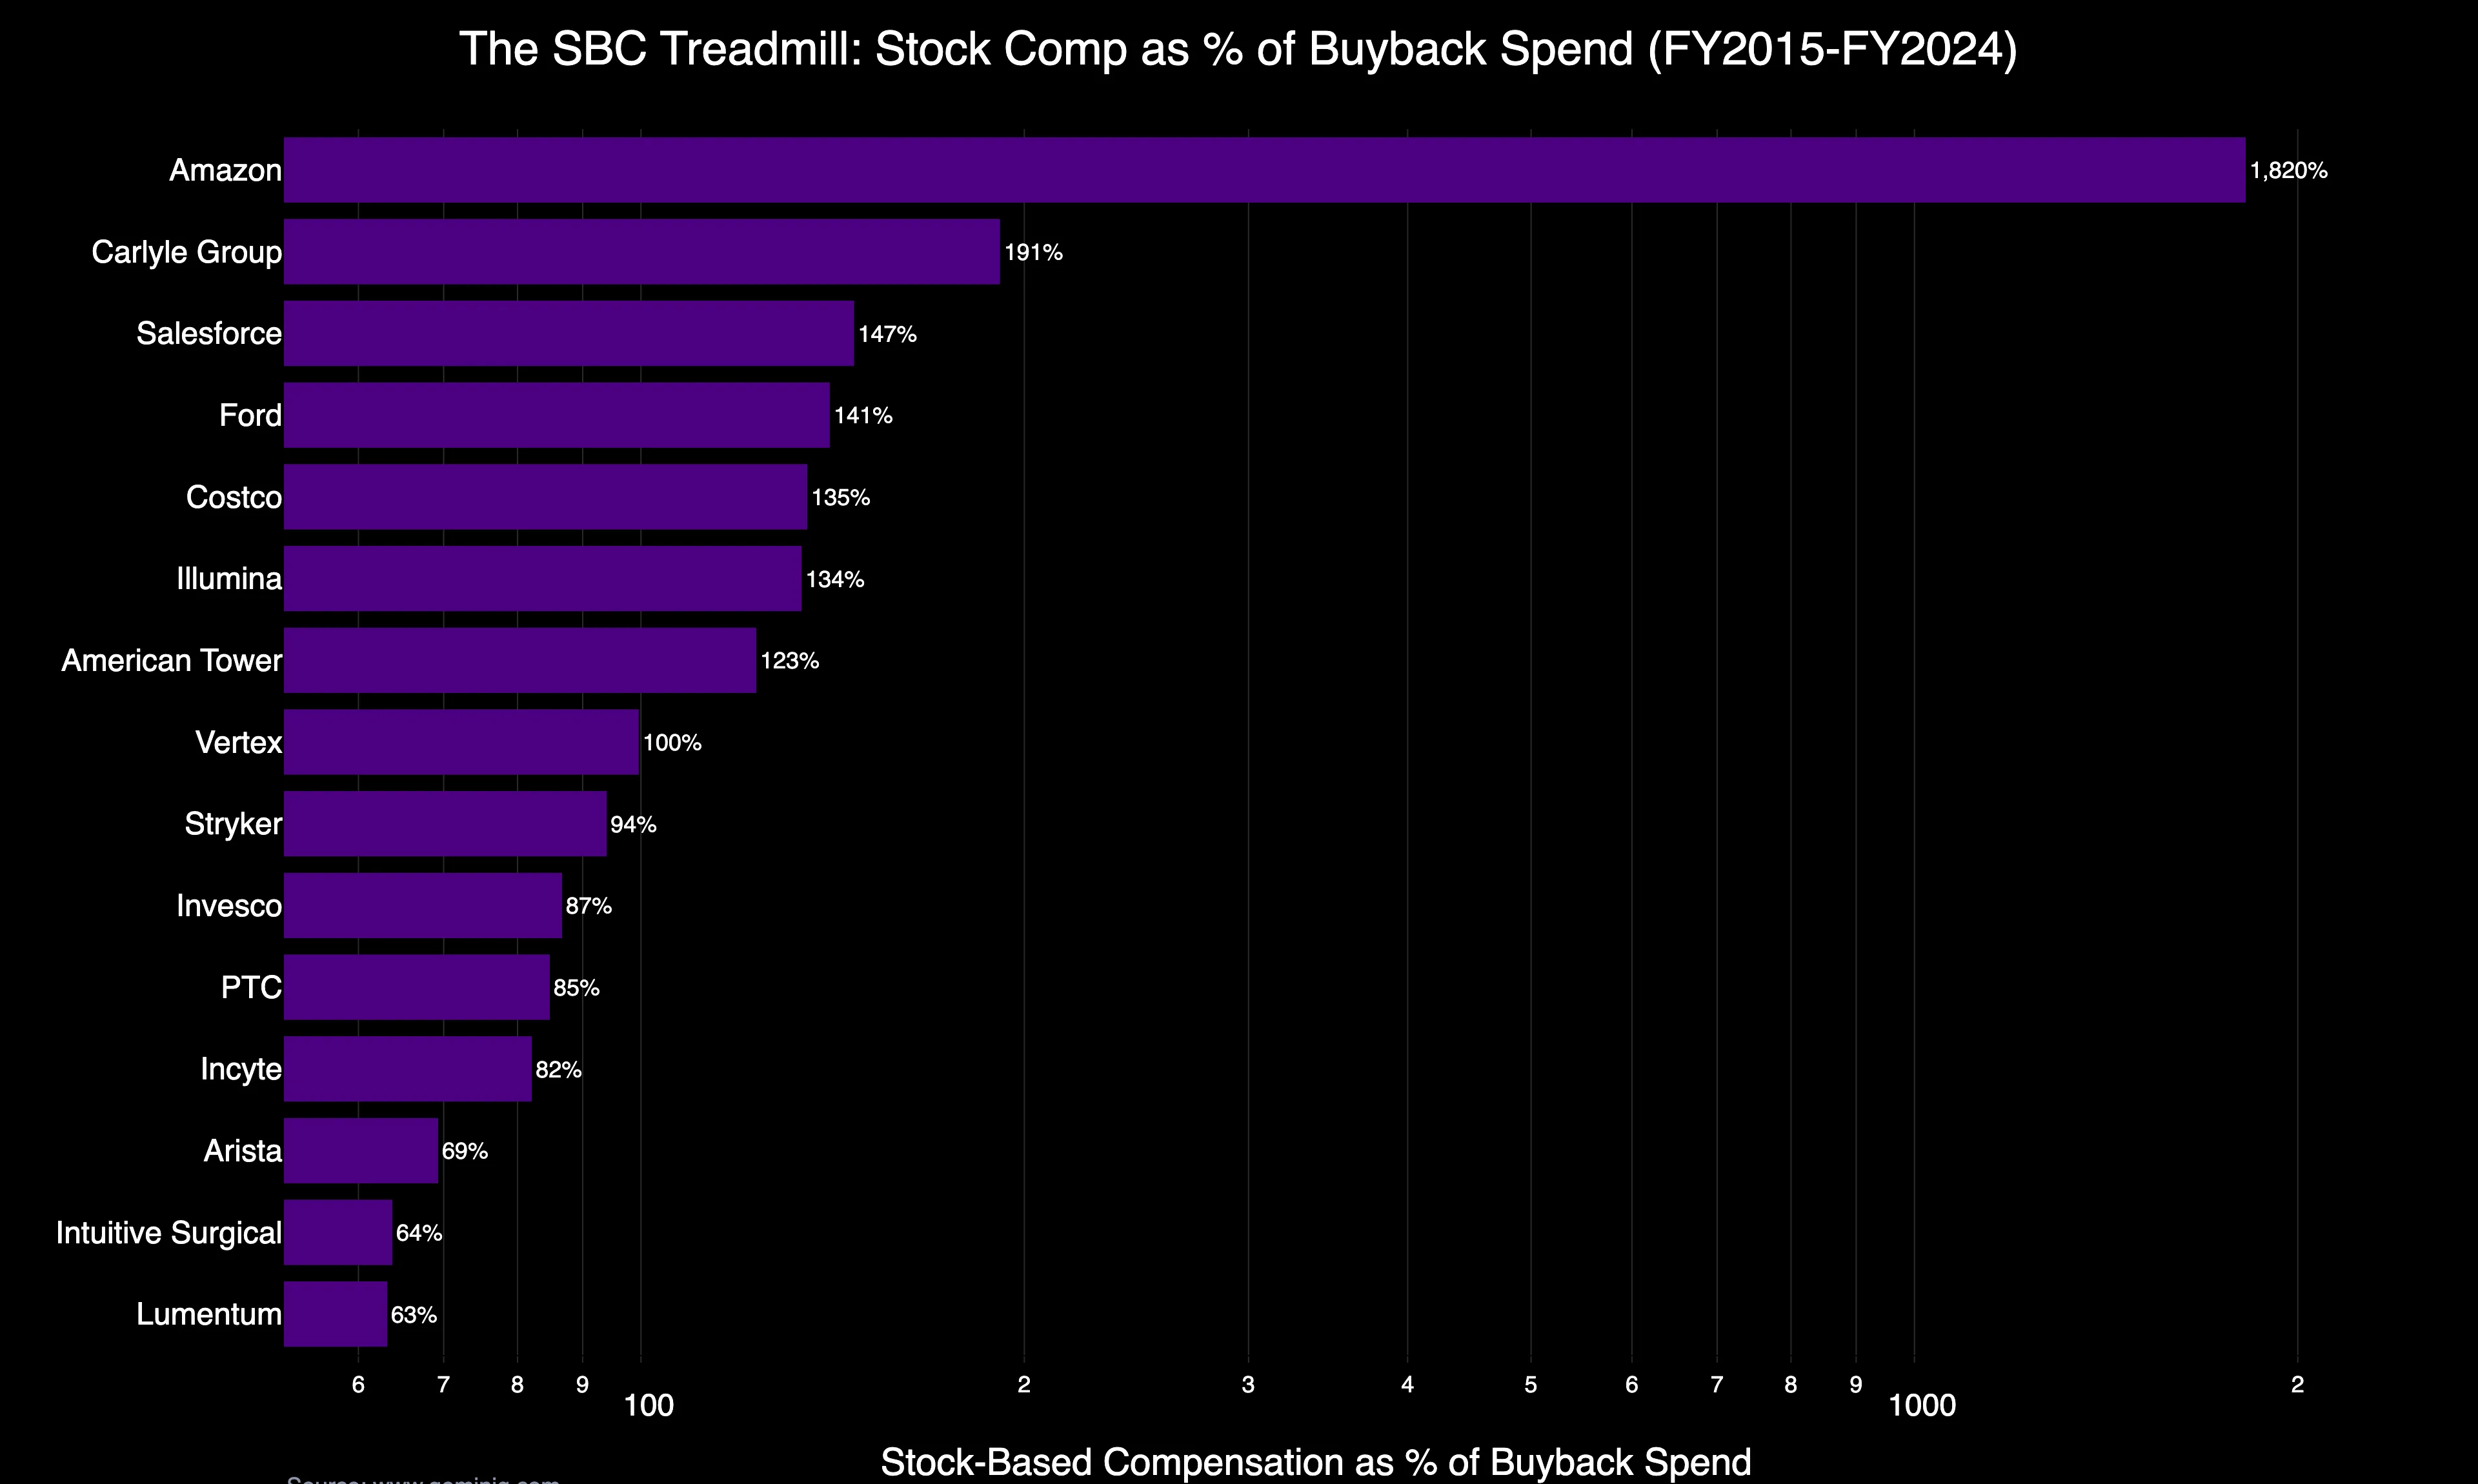
Every buyback press release implies the same promise: fewer shares outstanding, a more concentrated ownership stake for whoever holds on. Stock buybacks vs. stock compensation is the fight actually happening underneath that promise, and GeminIQ's as-filed data shows it going the wrong way for a specific, named group of companies. Screening a decade of 10-K filings turns up fifty-four companies that spent $1 billion or more repurchasing their own stock while diluted shares stayed flat or climbed anyway — not because the buybacks were fake, but because stock-based compensation was issuing new shares just as fast, or faster, than the buyback was retiring them. The company leading the list spent $6.0 Billion on buybacks against $109.2 Billion in stock comp.
This study reads the FY2015–FY2024 10-K filings of every company in GeminIQ's as-filed database with a complete ten-year filing history — 3,053 companies. From that universe, 614 companies spent more than $1 billion on buybacks over the decade; 126 of them saw diluted shares stay flat or rise anyway. This ranking excludes any company where a single fiscal year drove a 15%-or-larger jump in diluted shares — that pattern belongs to a stock-for-stock acquisition, not equity compensation, and folding the two together would misattribute the cause. What's left is 54 companies where the dilution reads as compensation-driven, ranked below by stock-based compensation as a percentage of buyback spend.
The Leaderboard
Standard financial media coverage of a buyback announcement stops at the headline dollar figure. But standard financial media doesn't read the footnotes — specifically, the Share Based Compensation line sitting two rows below Payments For Repurchase Of Common Stock on the same cash flow statement. The fifteen companies below spent the most on repurchases while handing back the most through equity awards.
| Rank | Company | Buyback Spend (10-Yr) | Stock Comp (10-Yr) | SBC as % of Buyback | Diluted Share Change |
|---|---|---|---|---|---|
| 1 | Amazon | $6.00 Billion | $109.21 Billion | 1,820% | +12.4% |
| 2 | Carlyle Group | $1.33 Billion | $2.55 Billion | 191% | +23.2% |
| 3 | Salesforce | $11.62 Billion | $17.08 Billion | 147% | +57.7% |
| 4 | Ford Motor Company | $2.05 Billion | $2.88 Billion | 141% | +0.3% |
| 5 | Costco | $4.52 Billion | $6.11 Billion | 135% | +0.5% |
| 6 | Illumina | $2.15 Billion | $2.88 Billion | 134% | +6.7% |
| 7 | American Tower | $1.09 Billion | $1.35 Billion | 123% | +10.7% |
| 8 | Vertex Pharmaceuticals | $4.11 Billion | $4.09 Billion | 99.6% | +6.9% |
| 9 | Stryker | $1.55 Billion | $1.46 Billion | 94% | +1.2% |
| 10 | Invesco | $1.75 Billion | $1.52 Billion | 87% | +6.6% |
| 11 | PTC | $1.49 Billion | $1.26 Billion | 85% | +4.1% |
| 12 | Incyte | $2.00 Billion | $1.65 Billion | 82% | +12.4% |
| 13 | Arista Networks | $2.28 Billion | $1.58 Billion | 69% | +12.1% |
| 14 | Intuitive Surgical | $5.93 Billion | $3.78 Billion | 64% | +6.1% |
| 15 | Lumentum Holdings | $1.16 Billion | $0.73 Billion | 63% | +14.5% |
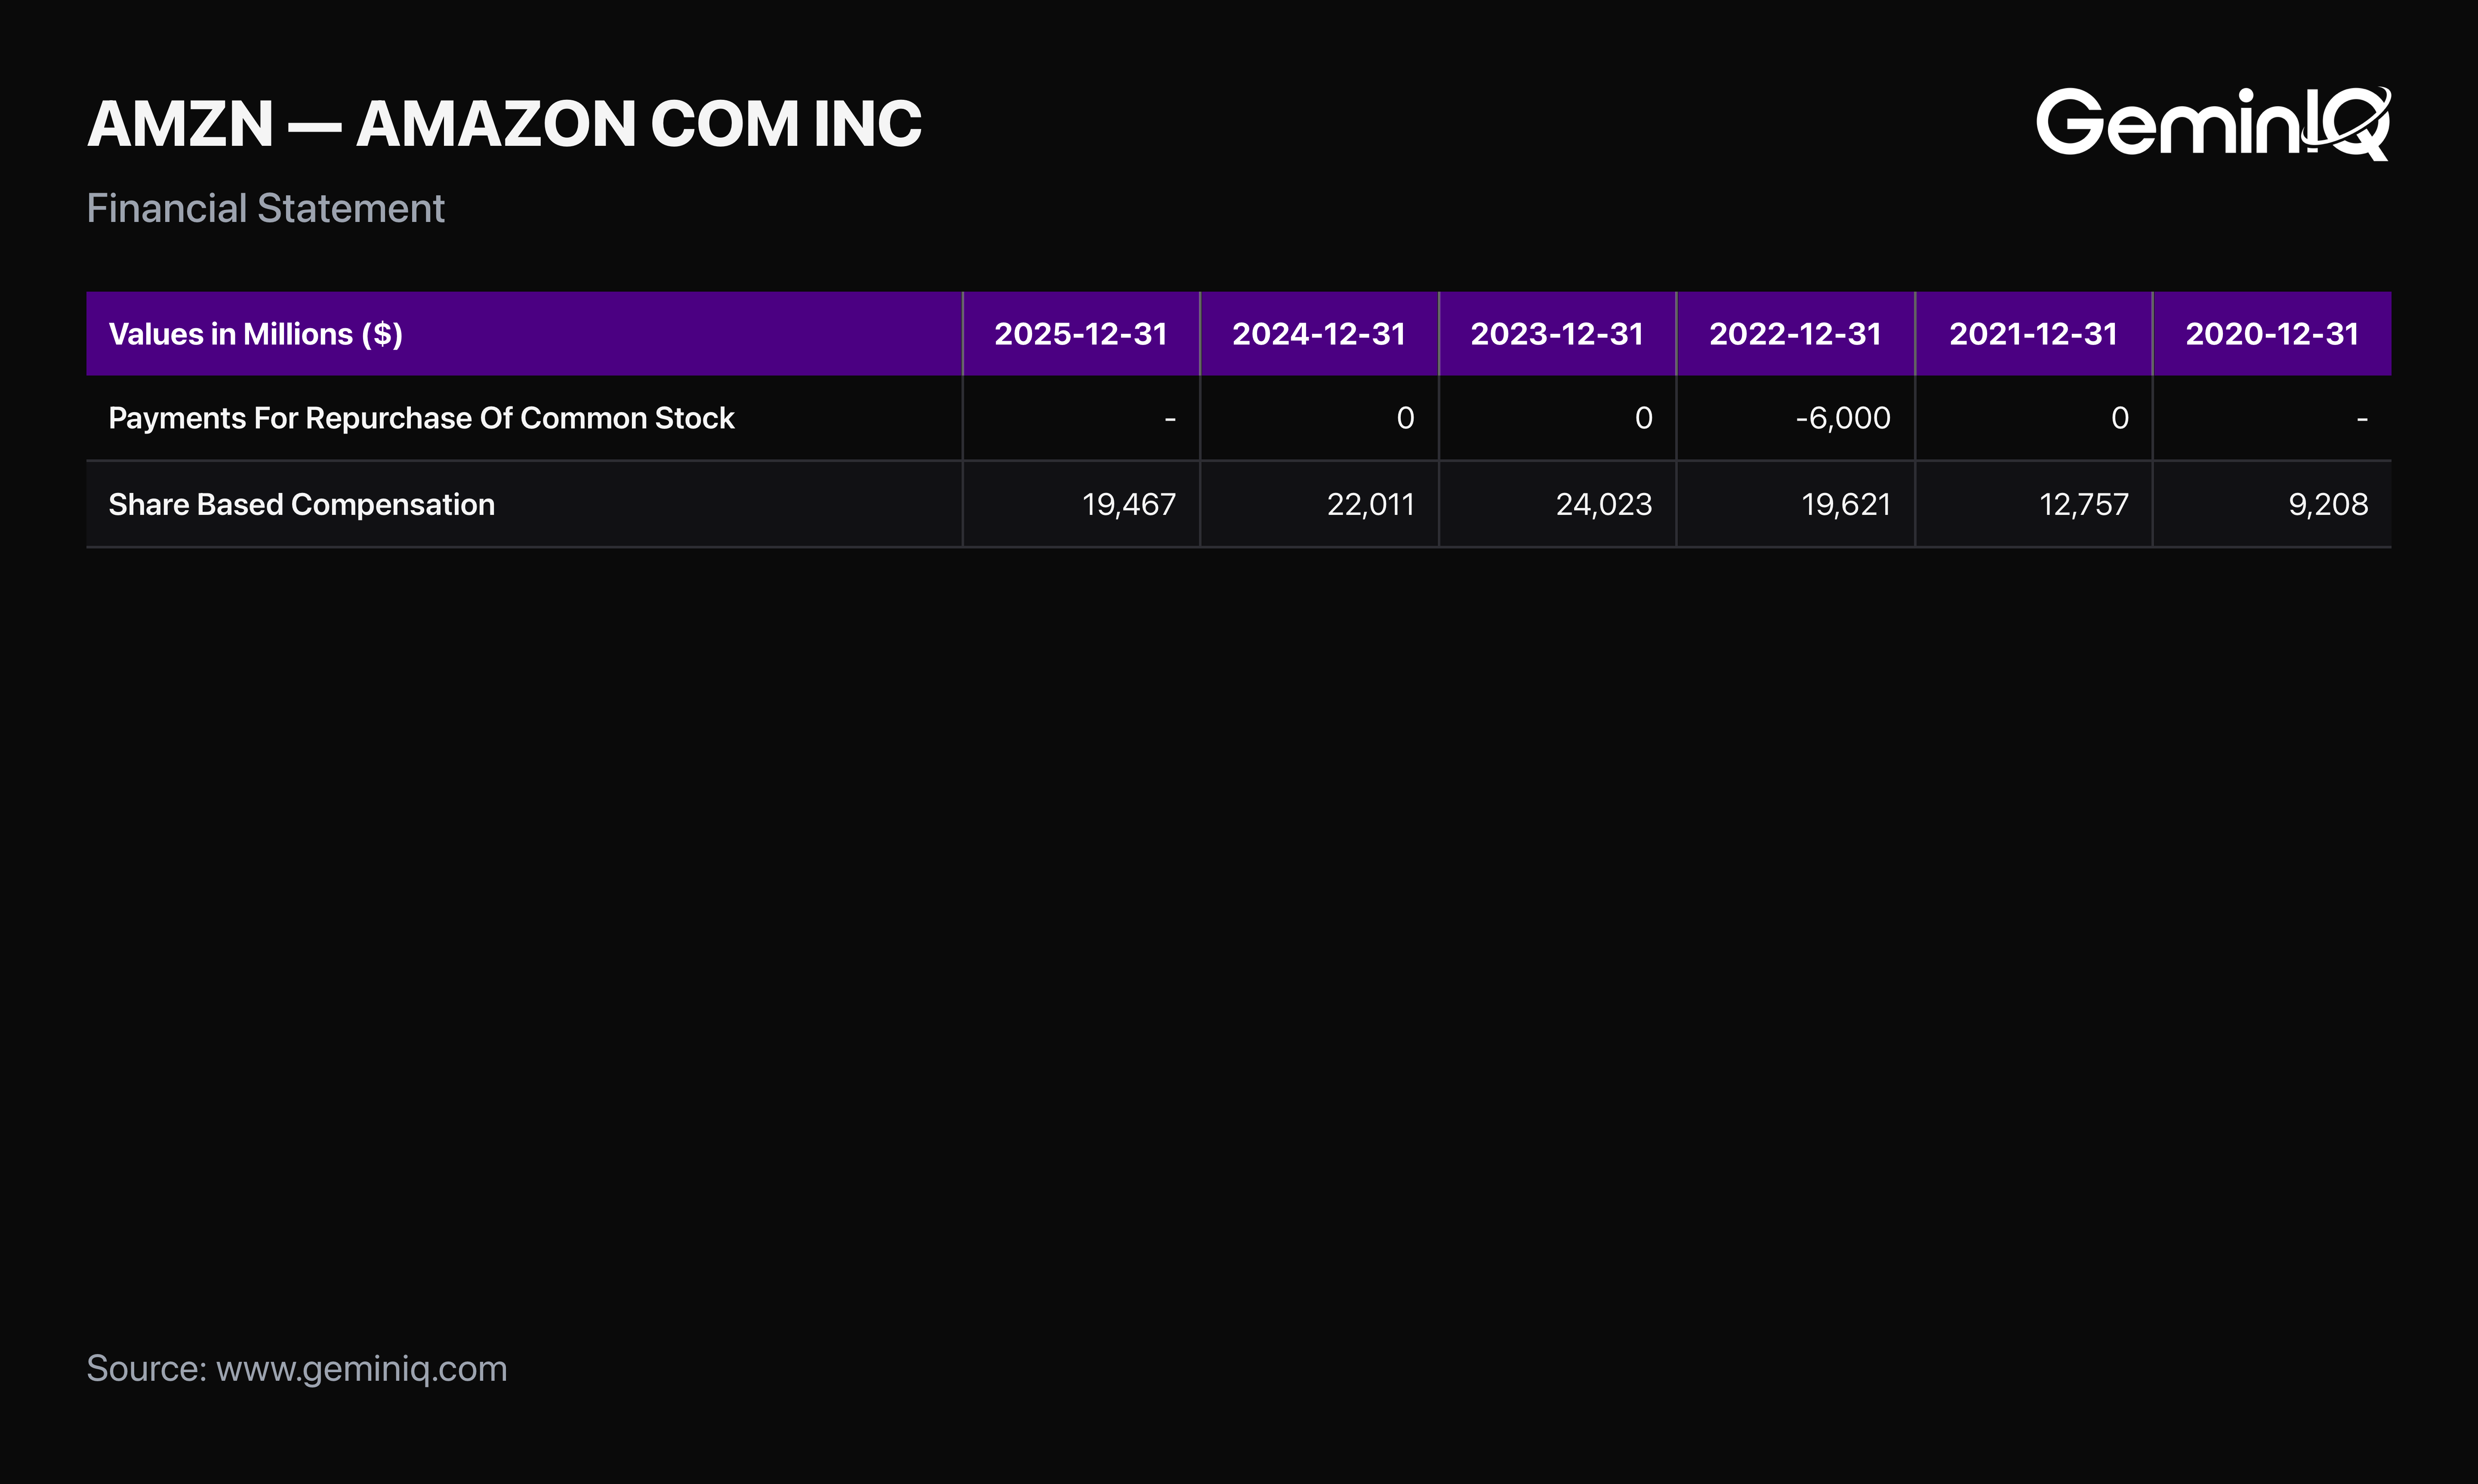
Amazon: One Buyback in Ten Years, $109 Billion in Stock Comp
Amazon tops this list, but not because a buyback program spiraled out of control. It tops the list because there was barely a buyback program at all. Across the ten fiscal years in this study, Amazon's 10-K reports a nonzero Payments For Repurchase Of Common Stock figure exactly once.
The Filing Data: FY2022 shows $6.0 Billion in buybacks — the only year in the decade with a real number on that line. Every other year from FY2015 through FY2024, the figure is effectively zero. Share Based Compensation, meanwhile, climbed in nine of those ten years, reaching a peak of $24.0 Billion in FY2023 before easing slightly to $22.0 Billion in FY2024, and totaling $109.2 Billion across the full window.
The GeminIQ Edge: Weighted average diluted shares climbed from 9.54 Billion in FY2015 to 10.72 Billion in FY2024, a 12.4% increase, while the one-time buyback barely registered against it. GeminIQ's Stock-Based Compensation to Revenue metric shows the dollar figure isn't even accelerating relative to the business: 2.7% of revenue in FY2015, peaking at 4.2% in FY2023 before easing to 3.45% in FY2024 — low for a mature technology company by GeminIQ's own benchmark. The story here isn't stock comp overwhelming an active repurchase program, or stock comp spiraling as a share of the business. It's stock comp compounding for a decade in the near-total absence of a buyback program to offset it.
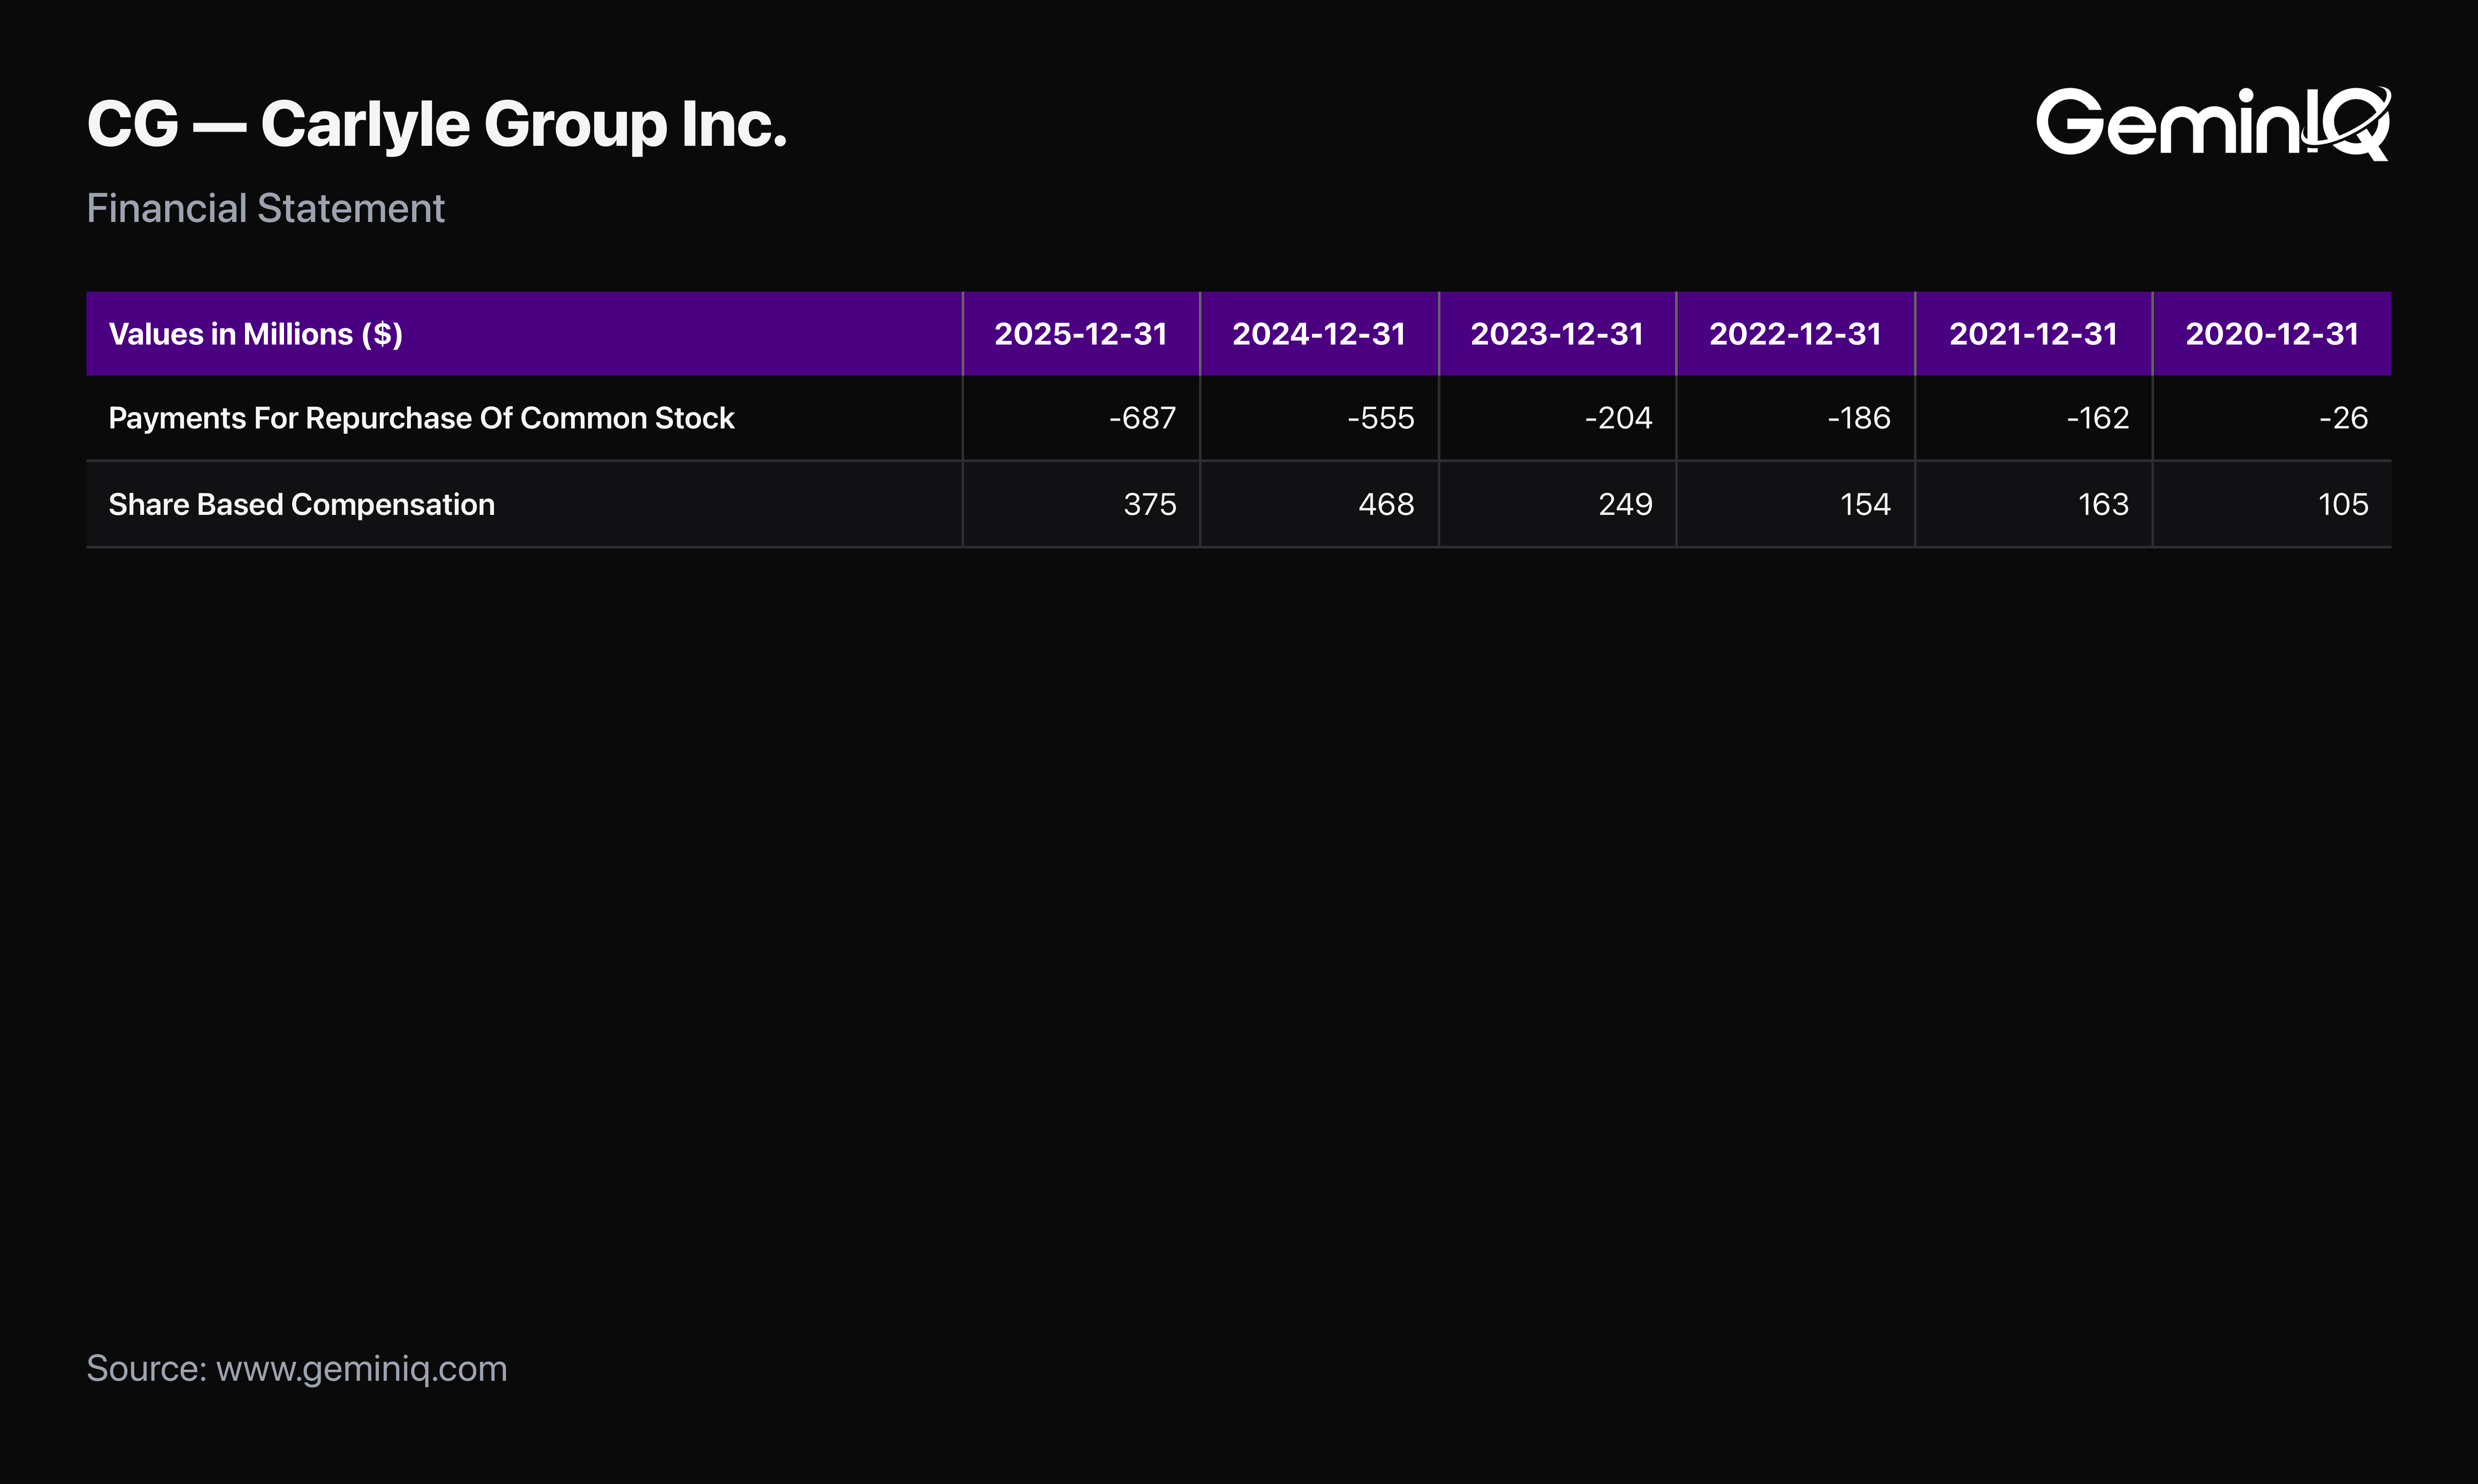
Carlyle Group: The Year the Buyback Finally Grew, So Did the Stock Comp
Carlyle Group spent modestly on buybacks for most of the decade — well under $200 Million in most years — while stock-based compensation ran in the low hundreds of millions annually. Then FY2024 arrived.
The Filing Data: Carlyle's FY2024 10-K reports $554.6 Million in buybacks, more than double any prior year in the study window. Share Based Compensation for the same fiscal year came in at $467.9 Million, up from $249.1 Million the year before — nearly doubling in step with the buyback.
The GeminIQ Edge: The one year Carlyle got serious about repurchases, its equity compensation expense got serious about growing too. Weighted average diluted shares still finished the decade at 1.104 Billion, up 23.2% from 896.2 Million in FY2015. The acceleration in buybacks didn't reverse a decade of dilution — it ran alongside a matching acceleration in the cause.
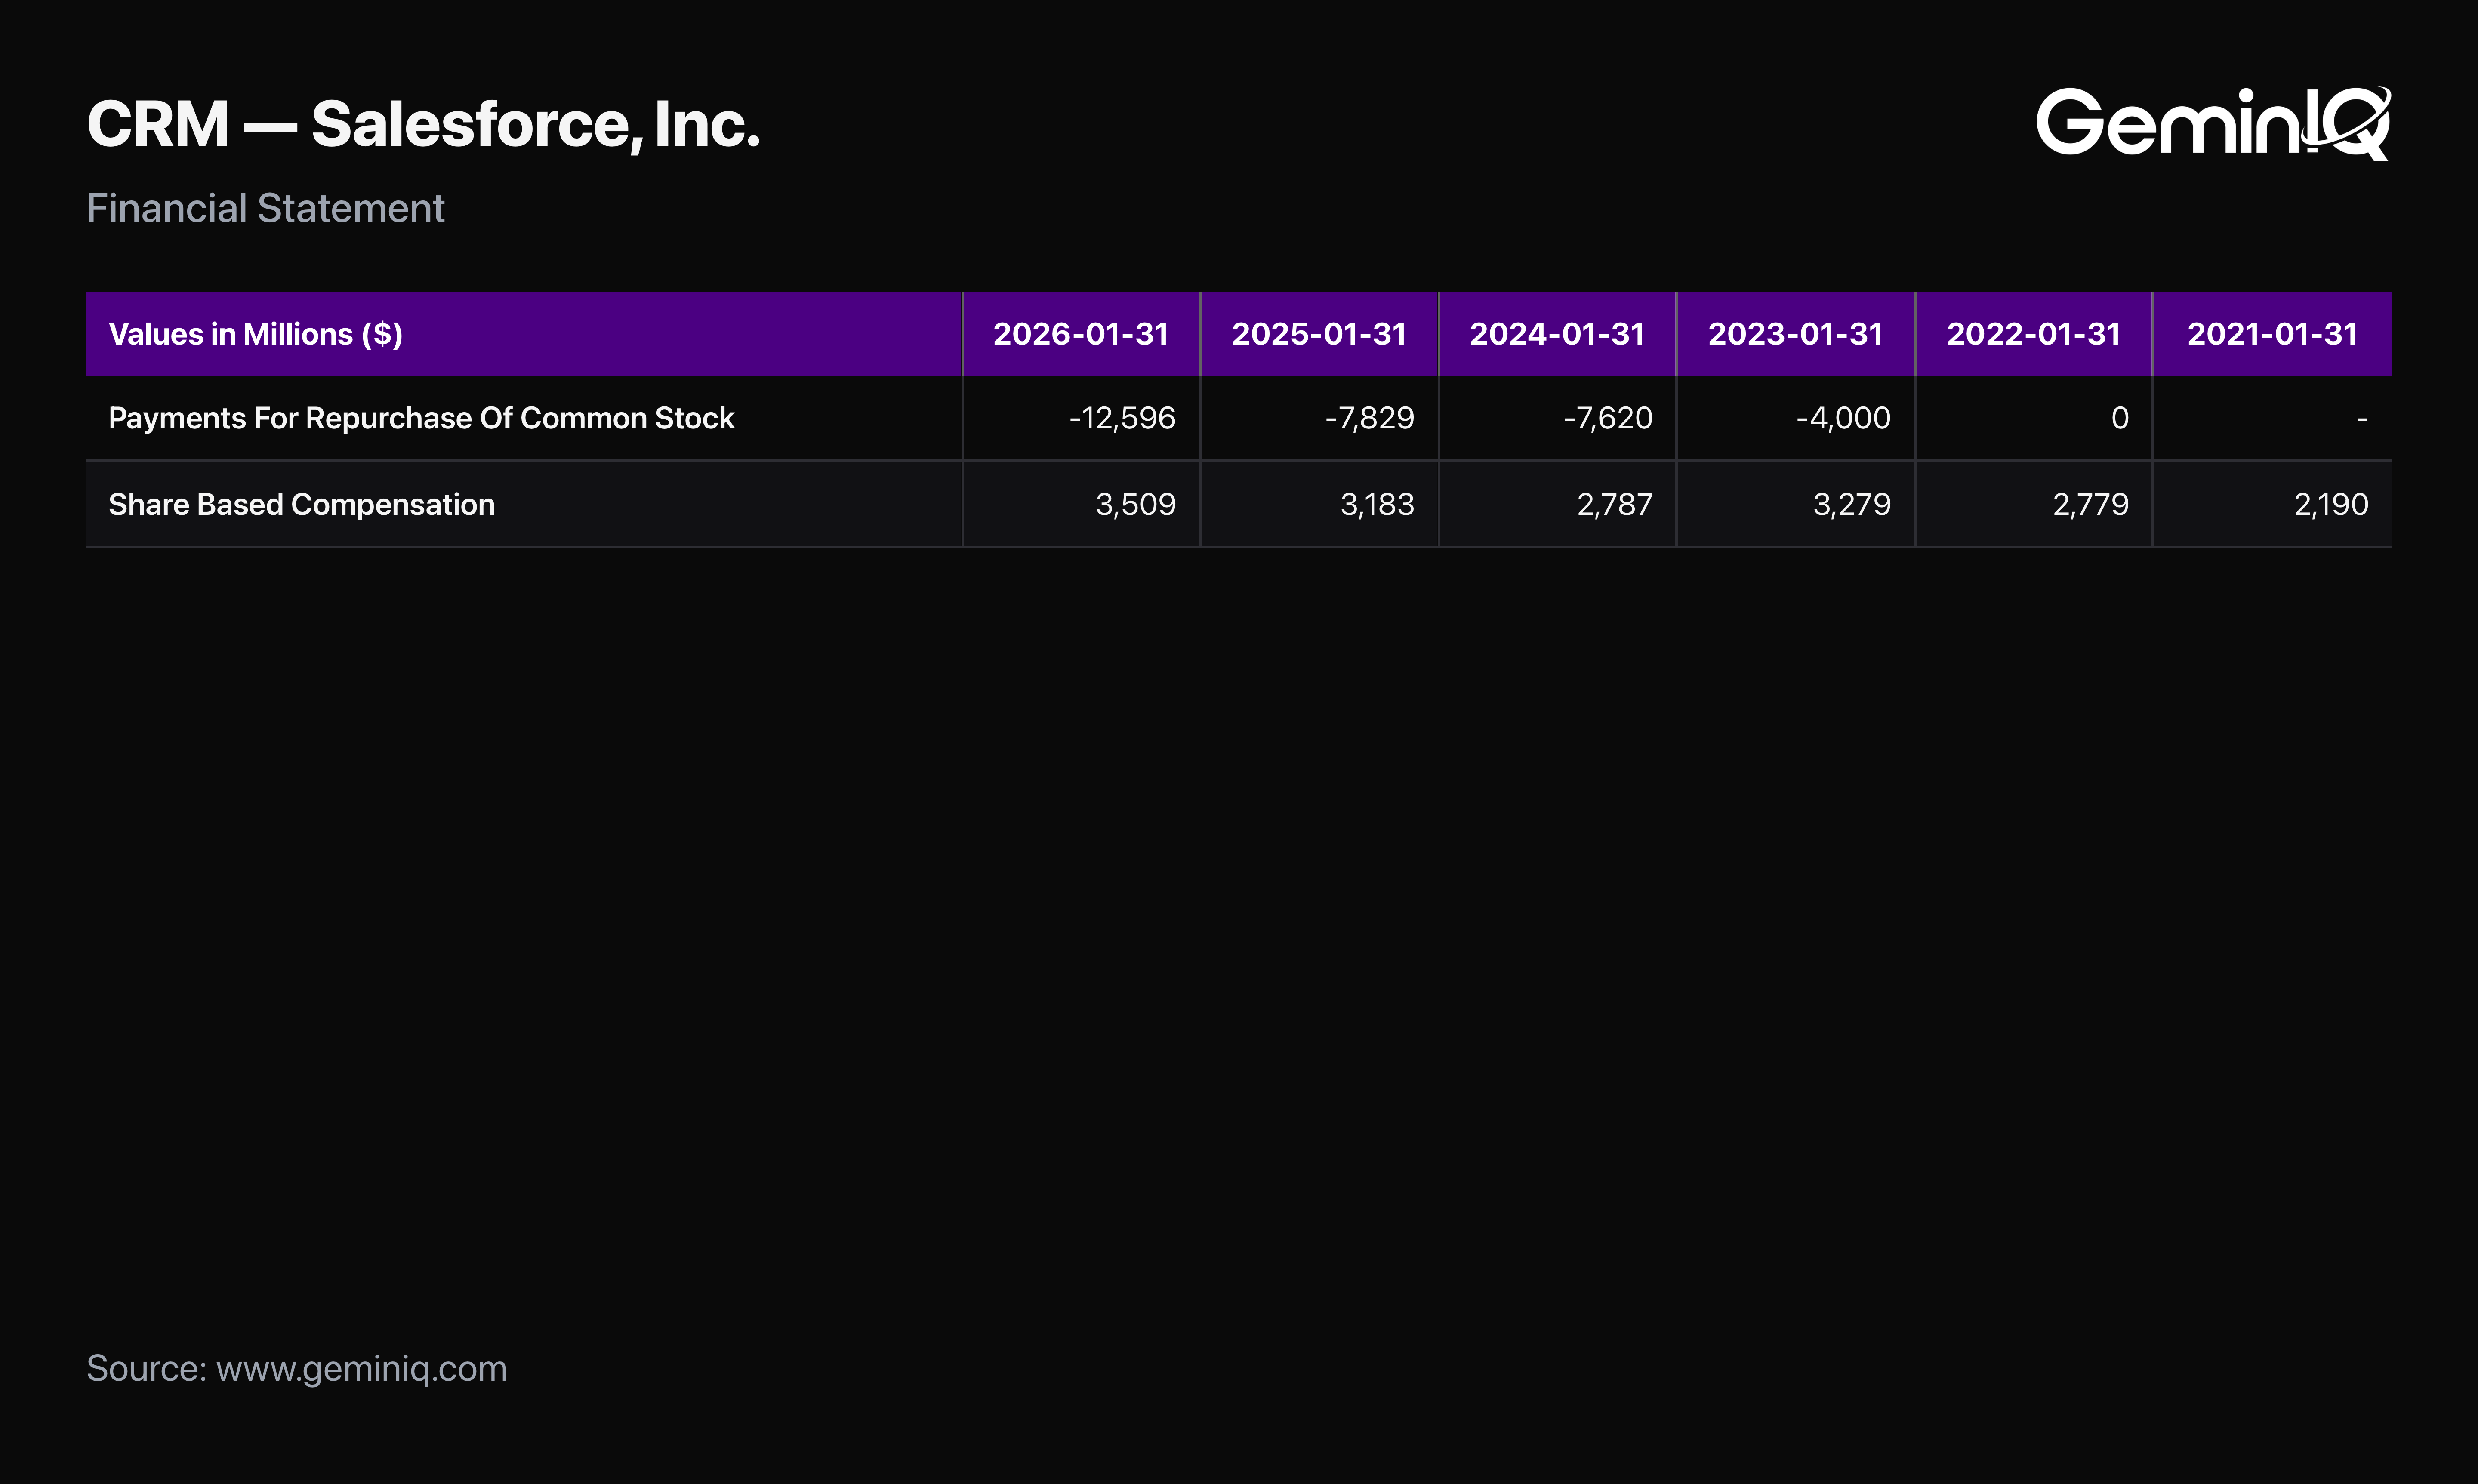
Salesforce: A Buyback Built to Fix Dilution, Undone by the Same Dilution
Salesforce authorized its first-ever stock buyback program in 2022, a move widely read at the time as a direct answer to years of shareholder pressure over stock-based compensation and dilution. For the first seven years this study covers, Salesforce had no repurchase program at all.
The Filing Data: Salesforce's 10-K shows $0 in buybacks through FY2022, then $4.0 Billion in FY2023 and $7.62 Billion in FY2024. Over those same two years, Share Based Compensation came in at $3.28 Billion and $2.79 Billion — running at roughly a third to just over half the size of the buyback in the only years the buyback existed.
The GeminIQ Edge: A standard screener flags Salesforce's recent buyback activity as capital discipline finally arriving. But pulling the full ten-year Cash Flow Statement via GeminIQ shows diluted shares still finished the period at 984.0 Million, up 57.7% from 624.1 Million in FY2015 — the steepest dilution of any company on this list with an active, ongoing buyback program. The buyback arrived to fix a problem it was too late, and too small relative to the prior decade's stock comp, to actually reverse.
Ford Motor Company: Buybacks Too Small and Inconsistent to Matter
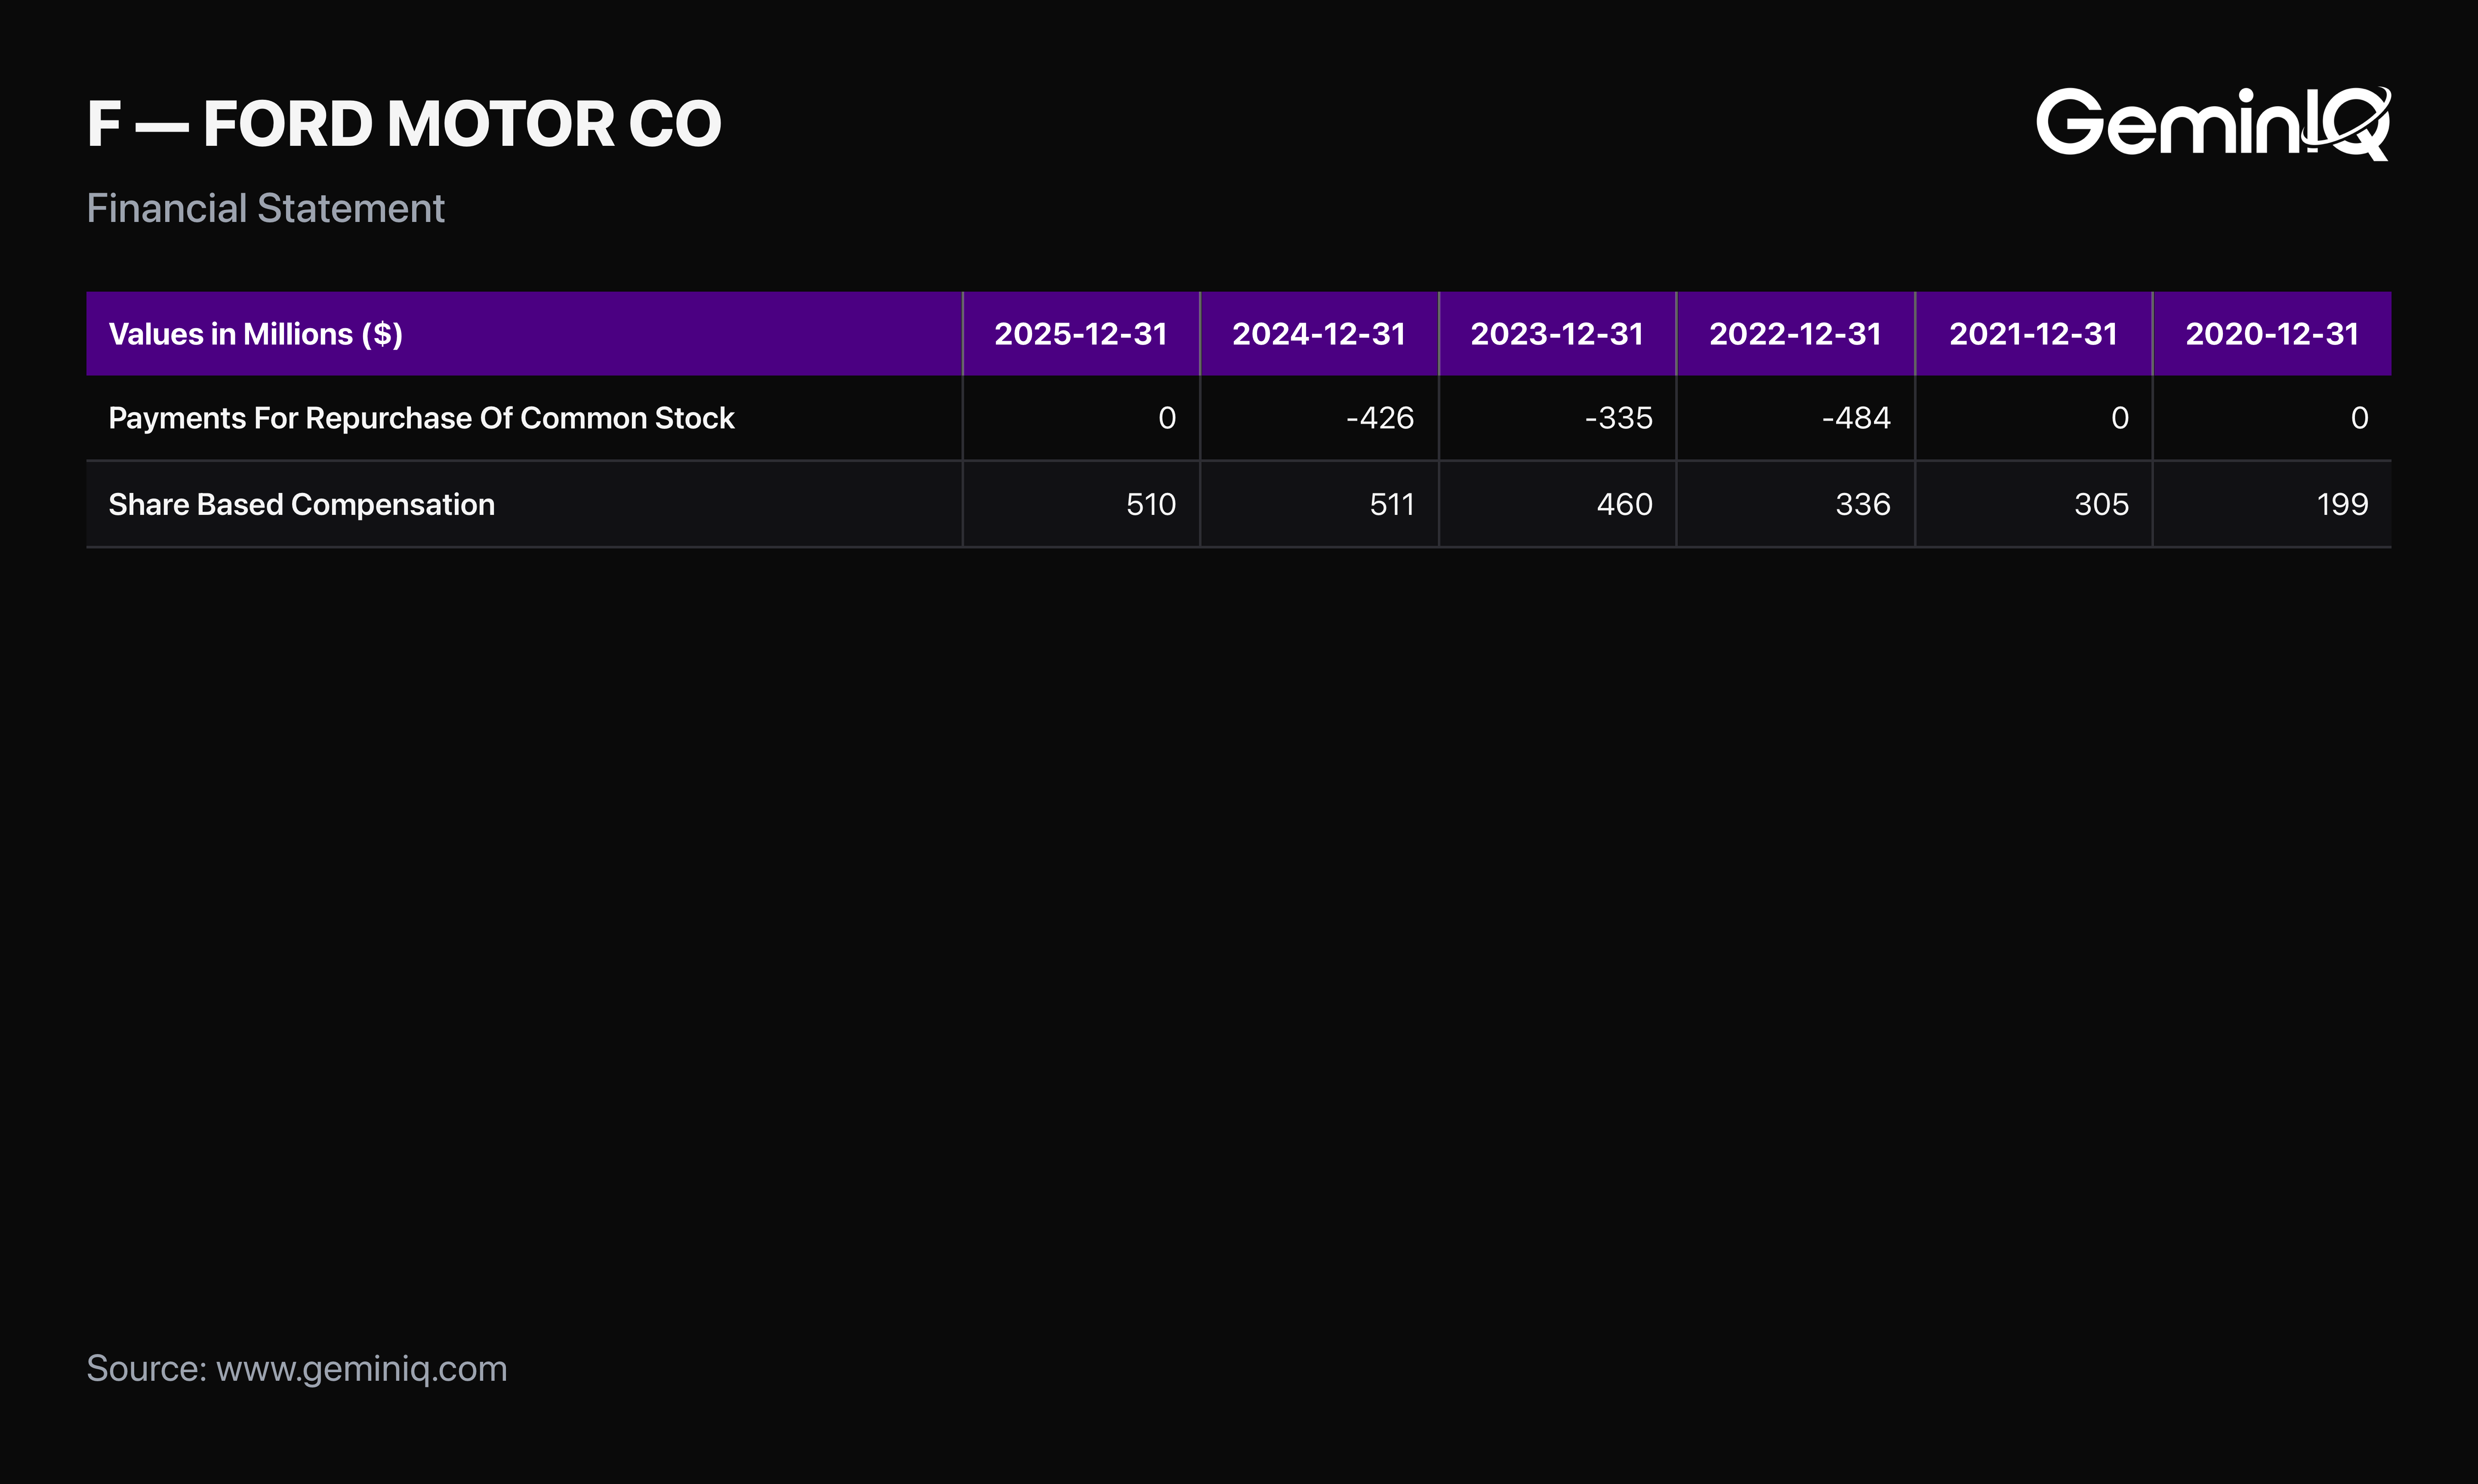
Ford Motor Company spent $2.05 Billion on buybacks across the study window — more than every other name ranked above it except Salesforce. Its diluted share count barely moved at all: 4.02 Billion shares in FY2024 versus roughly 4.01 Billion in FY2015, a change of just +0.3%.
The Filing Data: Ford's buyback line went to $0 twice in the decade, FY2020 and FY2021, both years the company suspended repurchases entirely. In every other year spending ranged from $129 Million to $484 Million — a modest, inconsistent program next to a Share Based Compensation line that grew from $199 Million in FY2015 to $511 Million in FY2024, more than doubling. By FY2024, Ford's stock comp expense alone exceeded that year's buyback spend outright.
The GeminIQ Edge: Ford's 10-K doesn't carry a direct diluted-share-count tag for FY2015 through FY2017. The figure above is reconstructed as Net Income divided by Diluted EPS for those three years, a standard fallback confirmed consistent with the directly-filed FY2018–FY2024 figures, which sit in the same 3.97 Billion to 4.04 Billion range throughout. What the reconstructed decade shows is a share count that's been essentially frozen the entire time — not because buybacks aggressively offset dilution the way they did at Costco, but because both forces are small relative to Ford's roughly 4 billion outstanding shares. A buyback that retires a few tens of millions of shares in a good year and an SBC program issuing a comparable number back barely register against a base that size — a different route to the same treadmill effect as the other names on this list.
Costco: The Flattest Share Count on the List, for the Wrong Reason
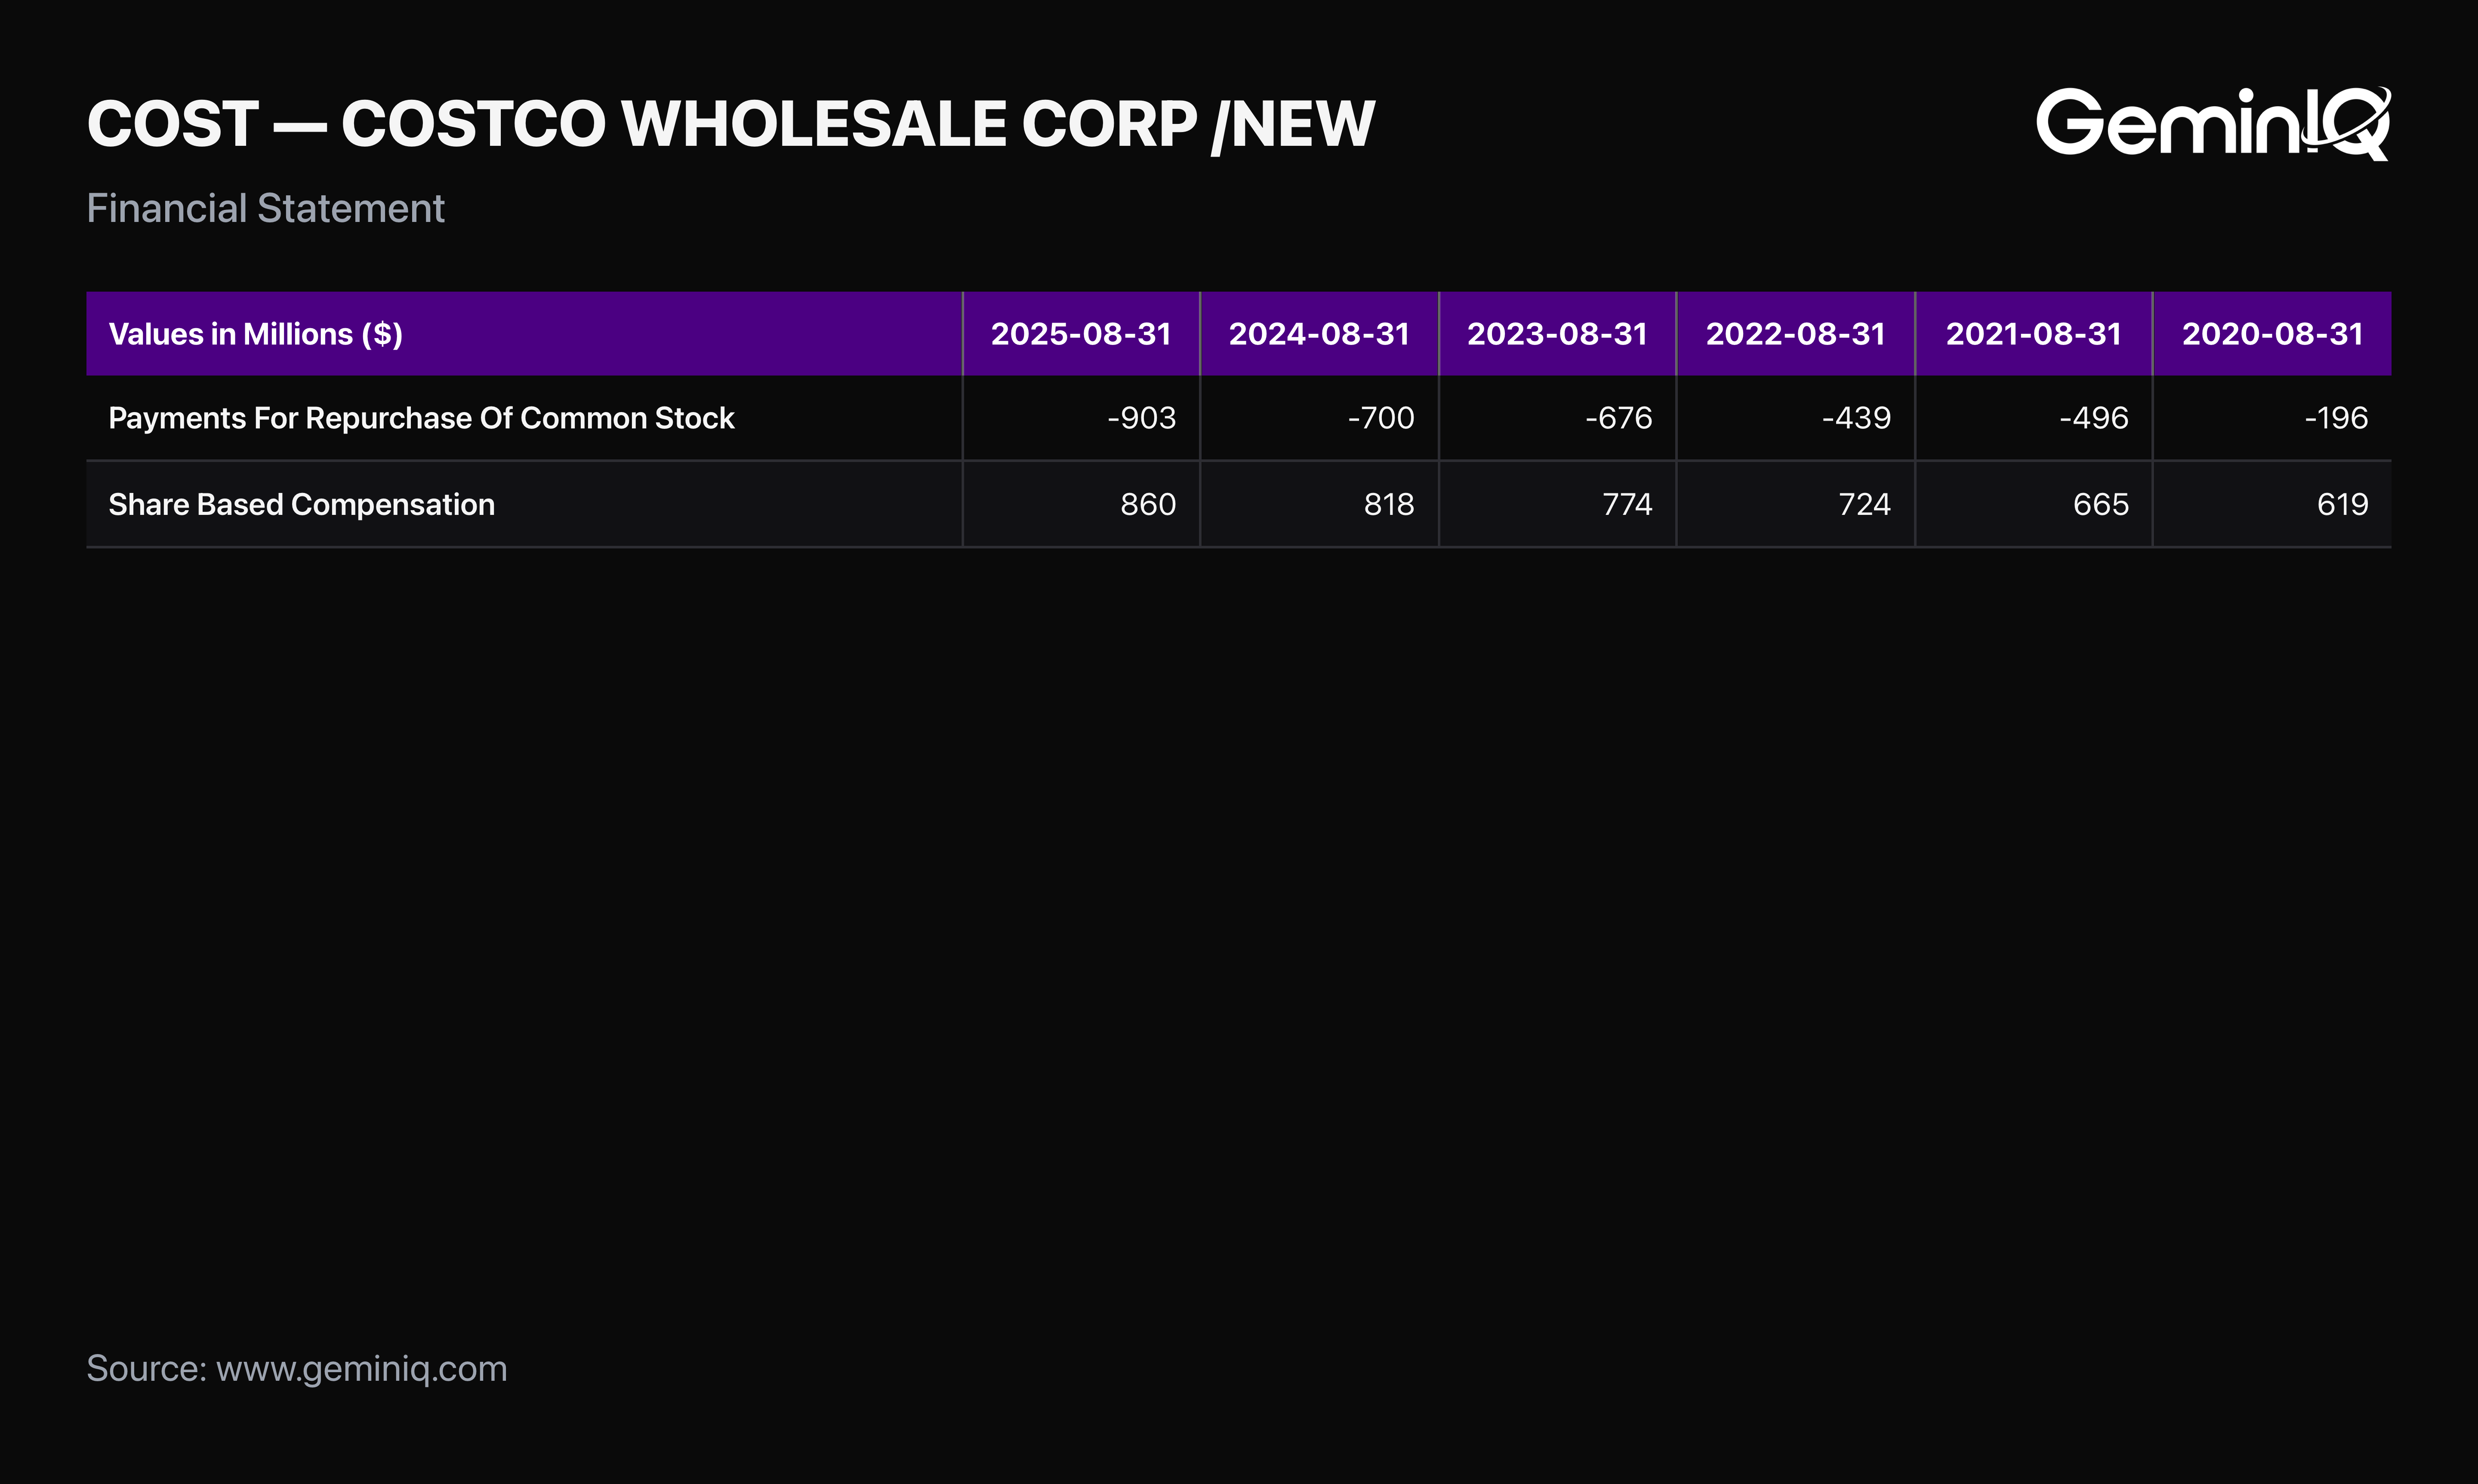
Costco already came up in a prior GeminIQ 10-K teardown as a business built on cash-flow discipline, and its diluted share count backs that reputation up on the surface — barely moving from 442.7 Million in FY2015 to 444.8 Million in FY2024, a change of just 0.5%.
The Filing Data: Costco's buyback spend grew steadily across the decade, from $481 Million in FY2015 to $700 Million in FY2024. Stock-based compensation grew right alongside it — from $394 Million to $818 Million over the same window — and overtook the buyback figure in every year from FY2018 onward.
The GeminIQ Edge: A standard screener flags Costco's flat share count as capital discipline. But pulling the raw Cash Flow Statement via GeminIQ shows the flatness isn't coming from buybacks outrunning dilution — it's coming from buybacks and stock comp rising together, in near lockstep, for ten straight years. The share count tells the story: it isn't shrinking, it's being held in place by two offsetting forces that happen to move at close to the same pace.
Illumina: Paused the Buyback Right When Stock Comp Peaked
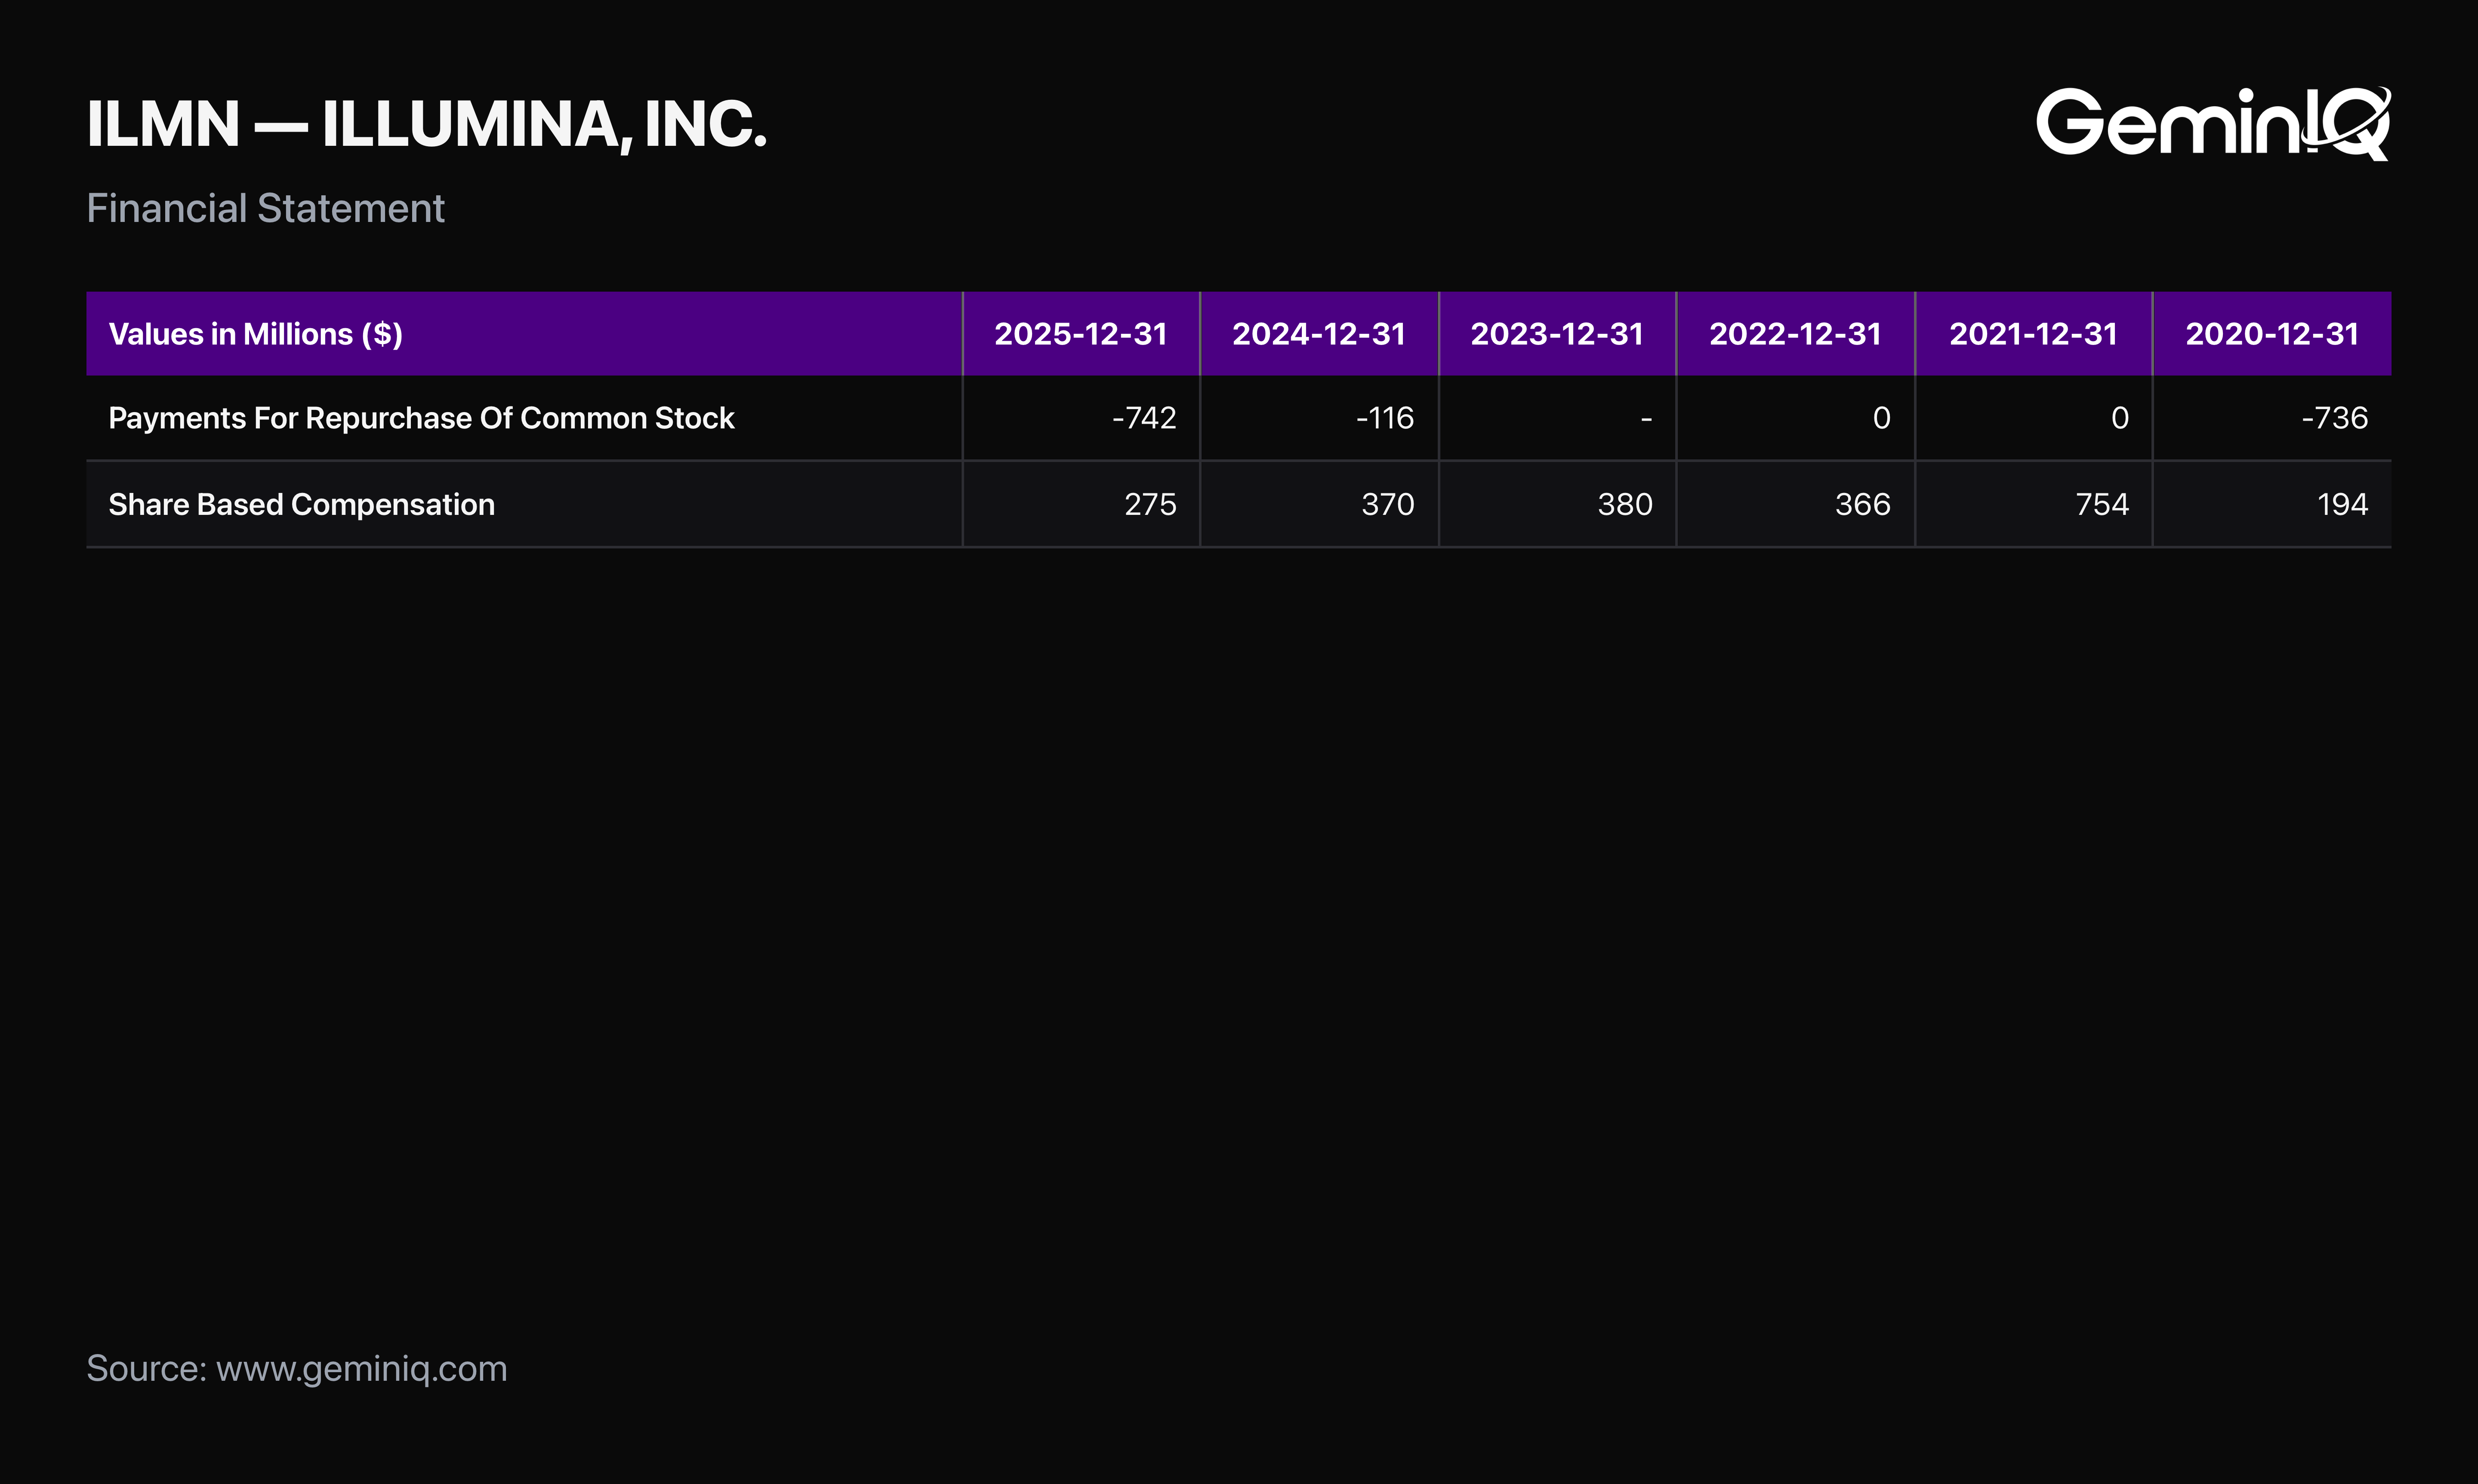
Illumina ran a modest, fairly consistent buyback program for most of the decade, spending between $200 Million and $736 Million annually through FY2020 — then stopped entirely for three straight fiscal years.
The Filing Data: Illumina's 10-K reports no repurchase spending for FY2021, FY2022, or FY2023 — a filed $0 for the first two years and the line item truly absent from the third, confirmed against a second, related equity-statement repurchase tag with no entry there either. Share Based Compensation in FY2021 came in at $754 Million — nearly four times the $194 Million reported the year before, and the single largest annual stock comp figure in the company's ten-year window. GeminIQ's Stock-Based Compensation to Revenue confirms the scale of that spike independently: it jumped to 16.6% of revenue in FY2021, nearly double every other year in the study window and still the clear high point of the decade.
The GeminIQ Edge: The three fiscal years Illumina could have leaned hardest into offsetting a stock-comp spike, it instead suspended the buyback completely. Diluted shares finished the decade at 159.0 Million, up 6.7% from 149.1 Million in FY2015 — a smaller increase than most names on this list, but one that happened despite the buyback's timing, not because of it.
The Method
This ranking reads each company's FY2015–FY2024 10-K filings only, not the interim 10-Qs — annual figures already represent the full-year total, and summing both would double-count. Companies were included if cumulative buyback spend exceeded $1 Billion and diluted shares stayed flat or rose over the window; companies where a single fiscal year drove a 15%-or-larger share count jump were excluded to filter out stock-for-stock acquisitions rather than compensation-driven dilution. Full methodology, including the acquisition-jump filter and data completeness rules, is detailed in How GeminIQ Builds a Filing Data Study.
Check Your Holdings
Run this on anything already in your portfolio. Open GeminIQ's Financial Statements view for the company, pull Payments For Repurchase Of Common Stock and Share Based Compensation from the Cash Flow Statement for the last five or ten fiscal years, and sum each column independently — using the annual 10-K figures only, not the quarterly filings, to avoid double-counting. Divide total stock comp by total buyback spend. A result meaningfully above 100% means the company issued more in equity awards than it retired in stock over that window. GeminIQ's Dilution Ratio metric — diluted shares divided by basic shares — offers a second, independent check on the same company. A ratio holding above the 1.00–1.03 range typical of a mature company, especially one that's climbing rather than flat, confirms sustained dilutive issuance without requiring the manual sum. Neither number says the buyback was a mistake. Both tell you whether it actually reduced the share count — the only claim a buyback press release makes in the first place.
Wall Street's data. Main Street's price.
Institutional terminals charge thousands a year for as-filed accuracy. GeminIQ gives you the same thing for a fraction of the cost: financials built directly from raw SEC EDGAR filings, not third-party APIs, with full XBRL traceability back to the original 10-K or 10-Q. No normalized guesswork, just calculated metrics, charts, screeners, and watchlists built on numbers exactly as the company reported them. Start researching now at GeminIQ.com.
All figures are drawn from each named company's as-filed 10-K filings for fiscal years 2015 through 2024, publicly available on SEC EDGAR. Methodology: How GeminIQ Builds a Filing Data Study.
Disclaimer: The content in this blog is for educational and entertainment purposes only and does not constitute financial, legal, or tax advice. Investing involves risk, including the loss of principal. The views expressed are my own and not intended as financial advice or a guarantee of future performance.