
Uber (UBER) Q3 2026 Earnings: EPS Down 92%, Gross Margin Up 3.7 Pts

By Chad Hartman
Published · Last updated
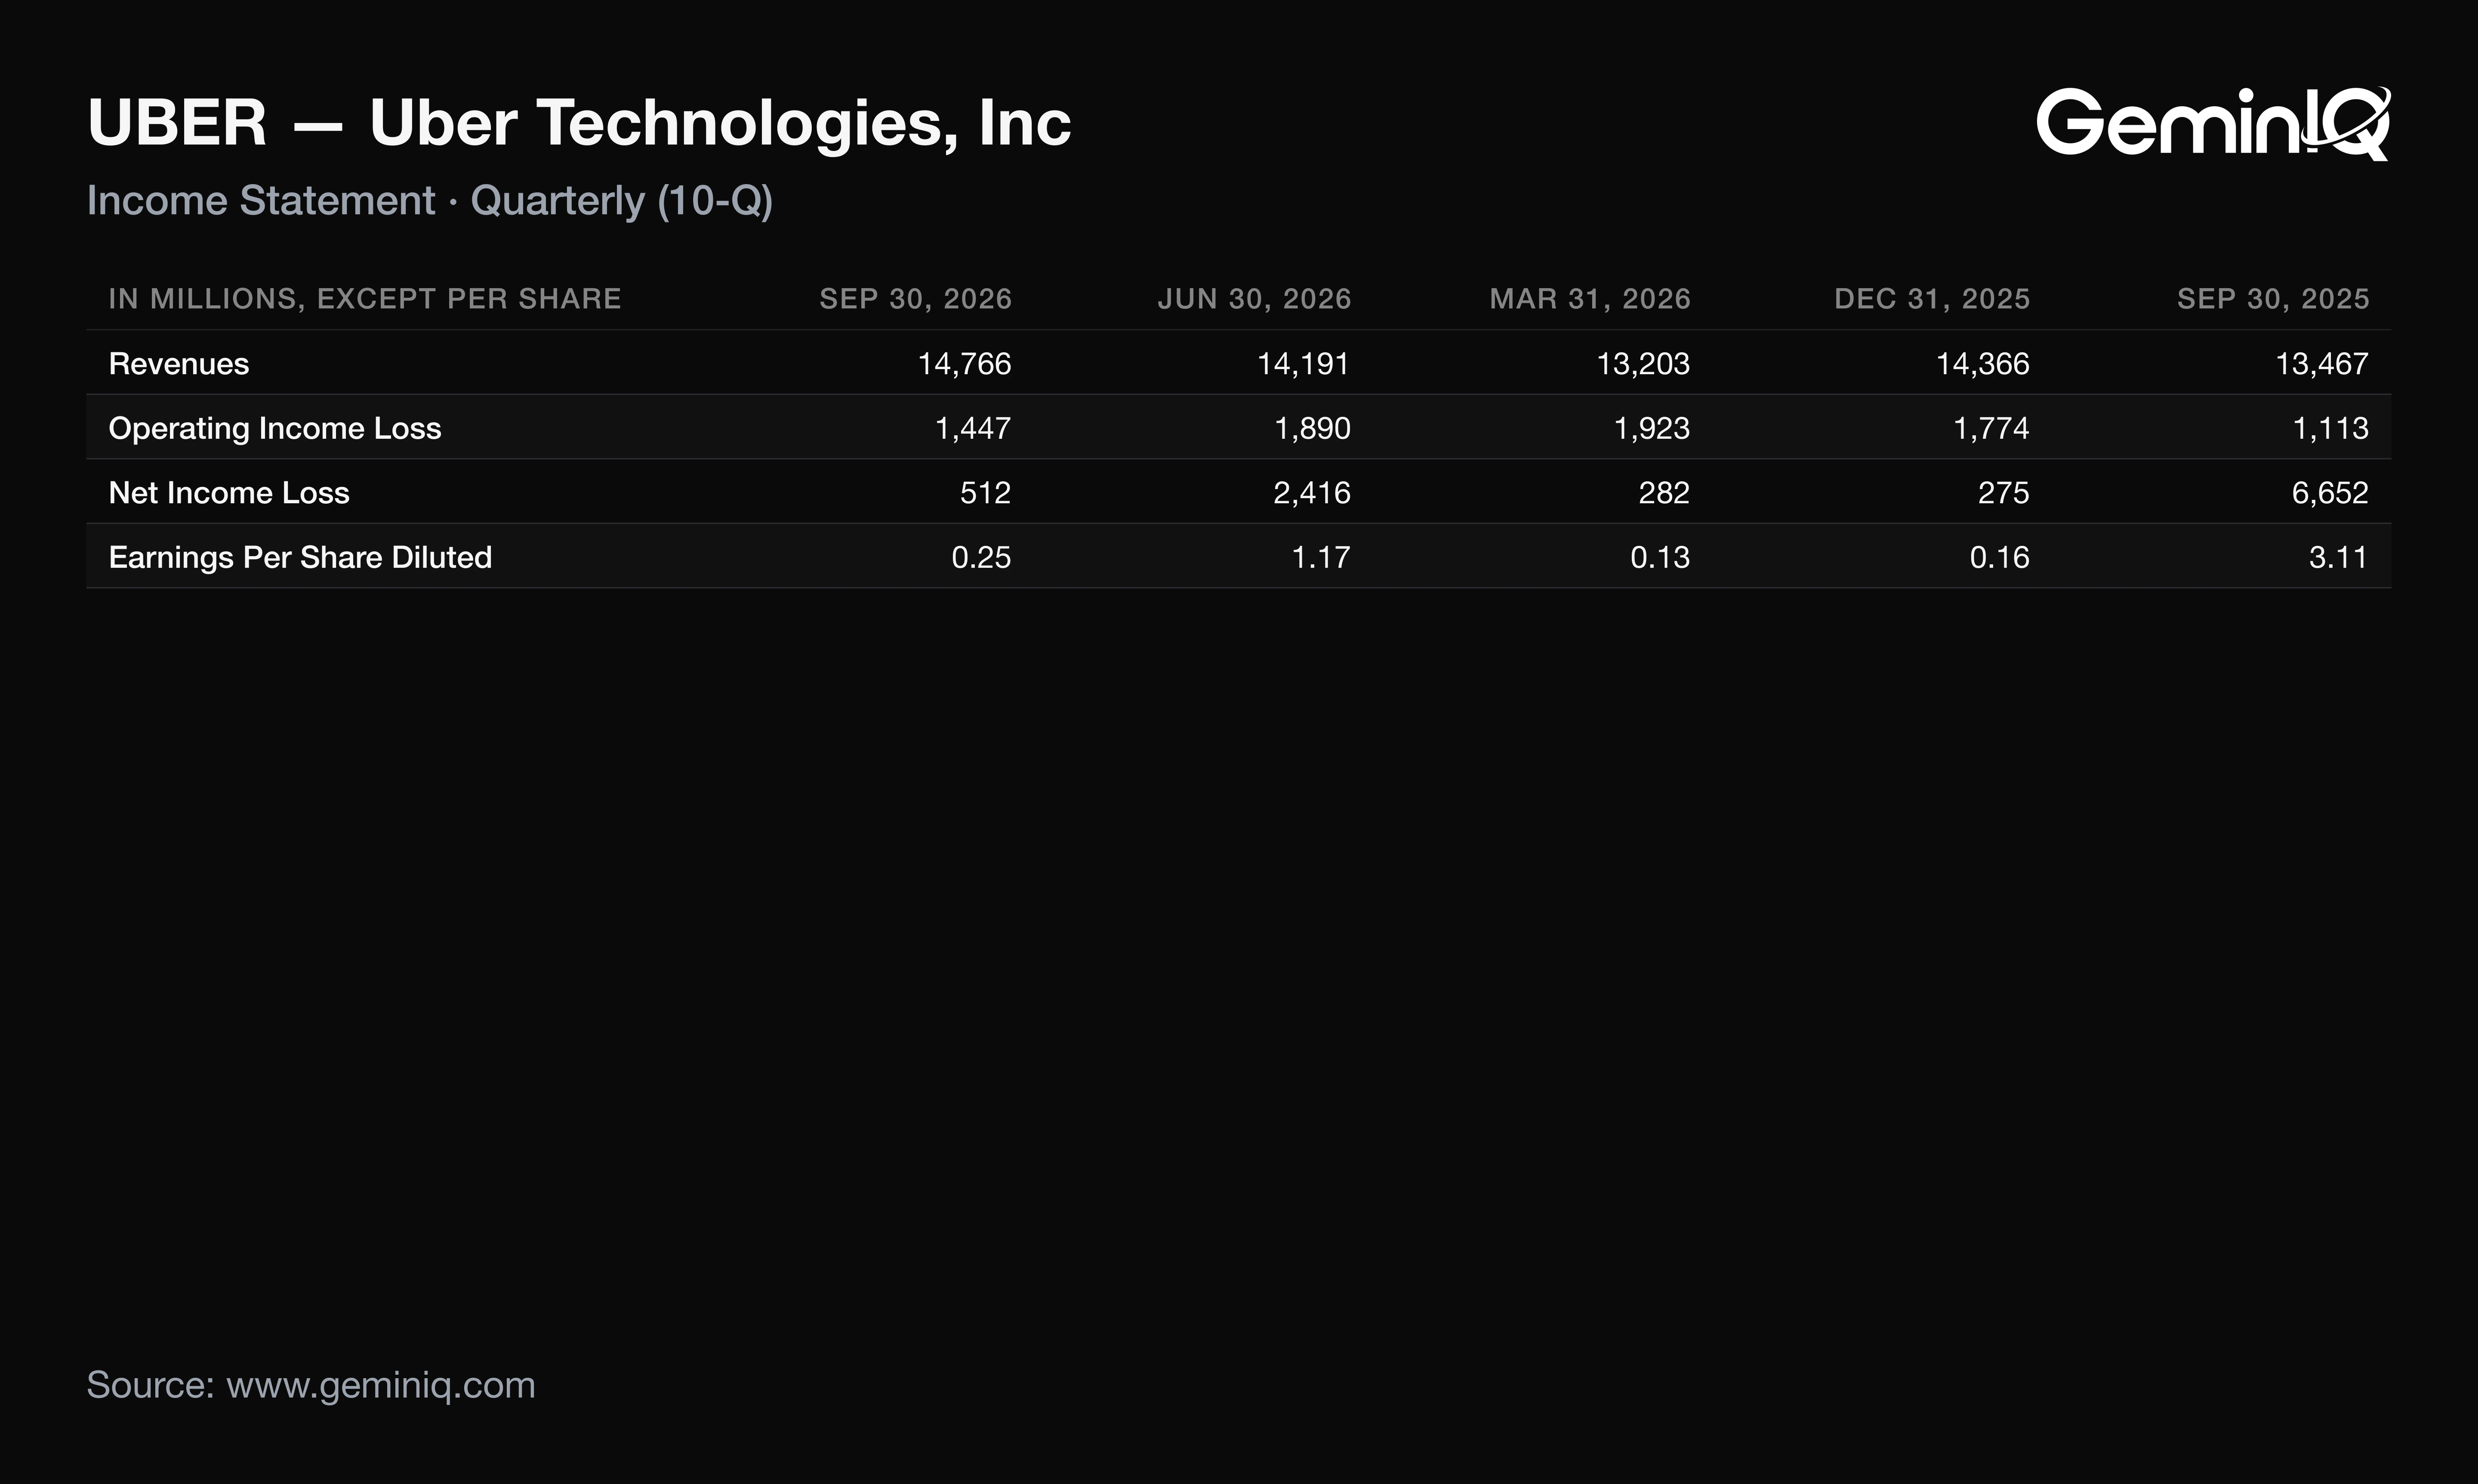
Uber (UBER) reported Q3 FY2026 revenue of $14.77 billion, up 9.6% year over year, and diluted EPS of $0.25, down 92.0%, in an earnings release and 10-Q both dated November 4, 2026 for the quarter ended September 30, 2026. The EPS drop is mostly a comparison against a year-ago quarter that carried a $4.9 billion tax valuation release. The sharper tension is in gross margin: it rose 3.7 points to 43.5%, yet a UK change in how revenue is booked explains most of the gain. Operating income, which neither the tax swing nor the UK change moves in dollars, rose 30.0% to $1.45 billion.
| Field | Value |
|---|---|
| Company | Uber ($UBER) |
| Quarter | Q3 FY2026, period ended September 30, 2026 |
| Earnings release | November 4, 2026 (Form 8-K) |
| 10-Q filed | November 4, 2026 |
| Revenue | $14.77 Billion (+9.6% YoY) |
| Diluted EPS | $0.25 (-92.0% YoY) |
| Operating margin | 9.8% (+1.5 pts YoY) |
| Operating cash flow (TTM) | $10.73 Billion |
| Gross margin | 43.5% (+3.7 pts YoY) |
Uber Q3 2026 Revenue, EPS and Operating Margin
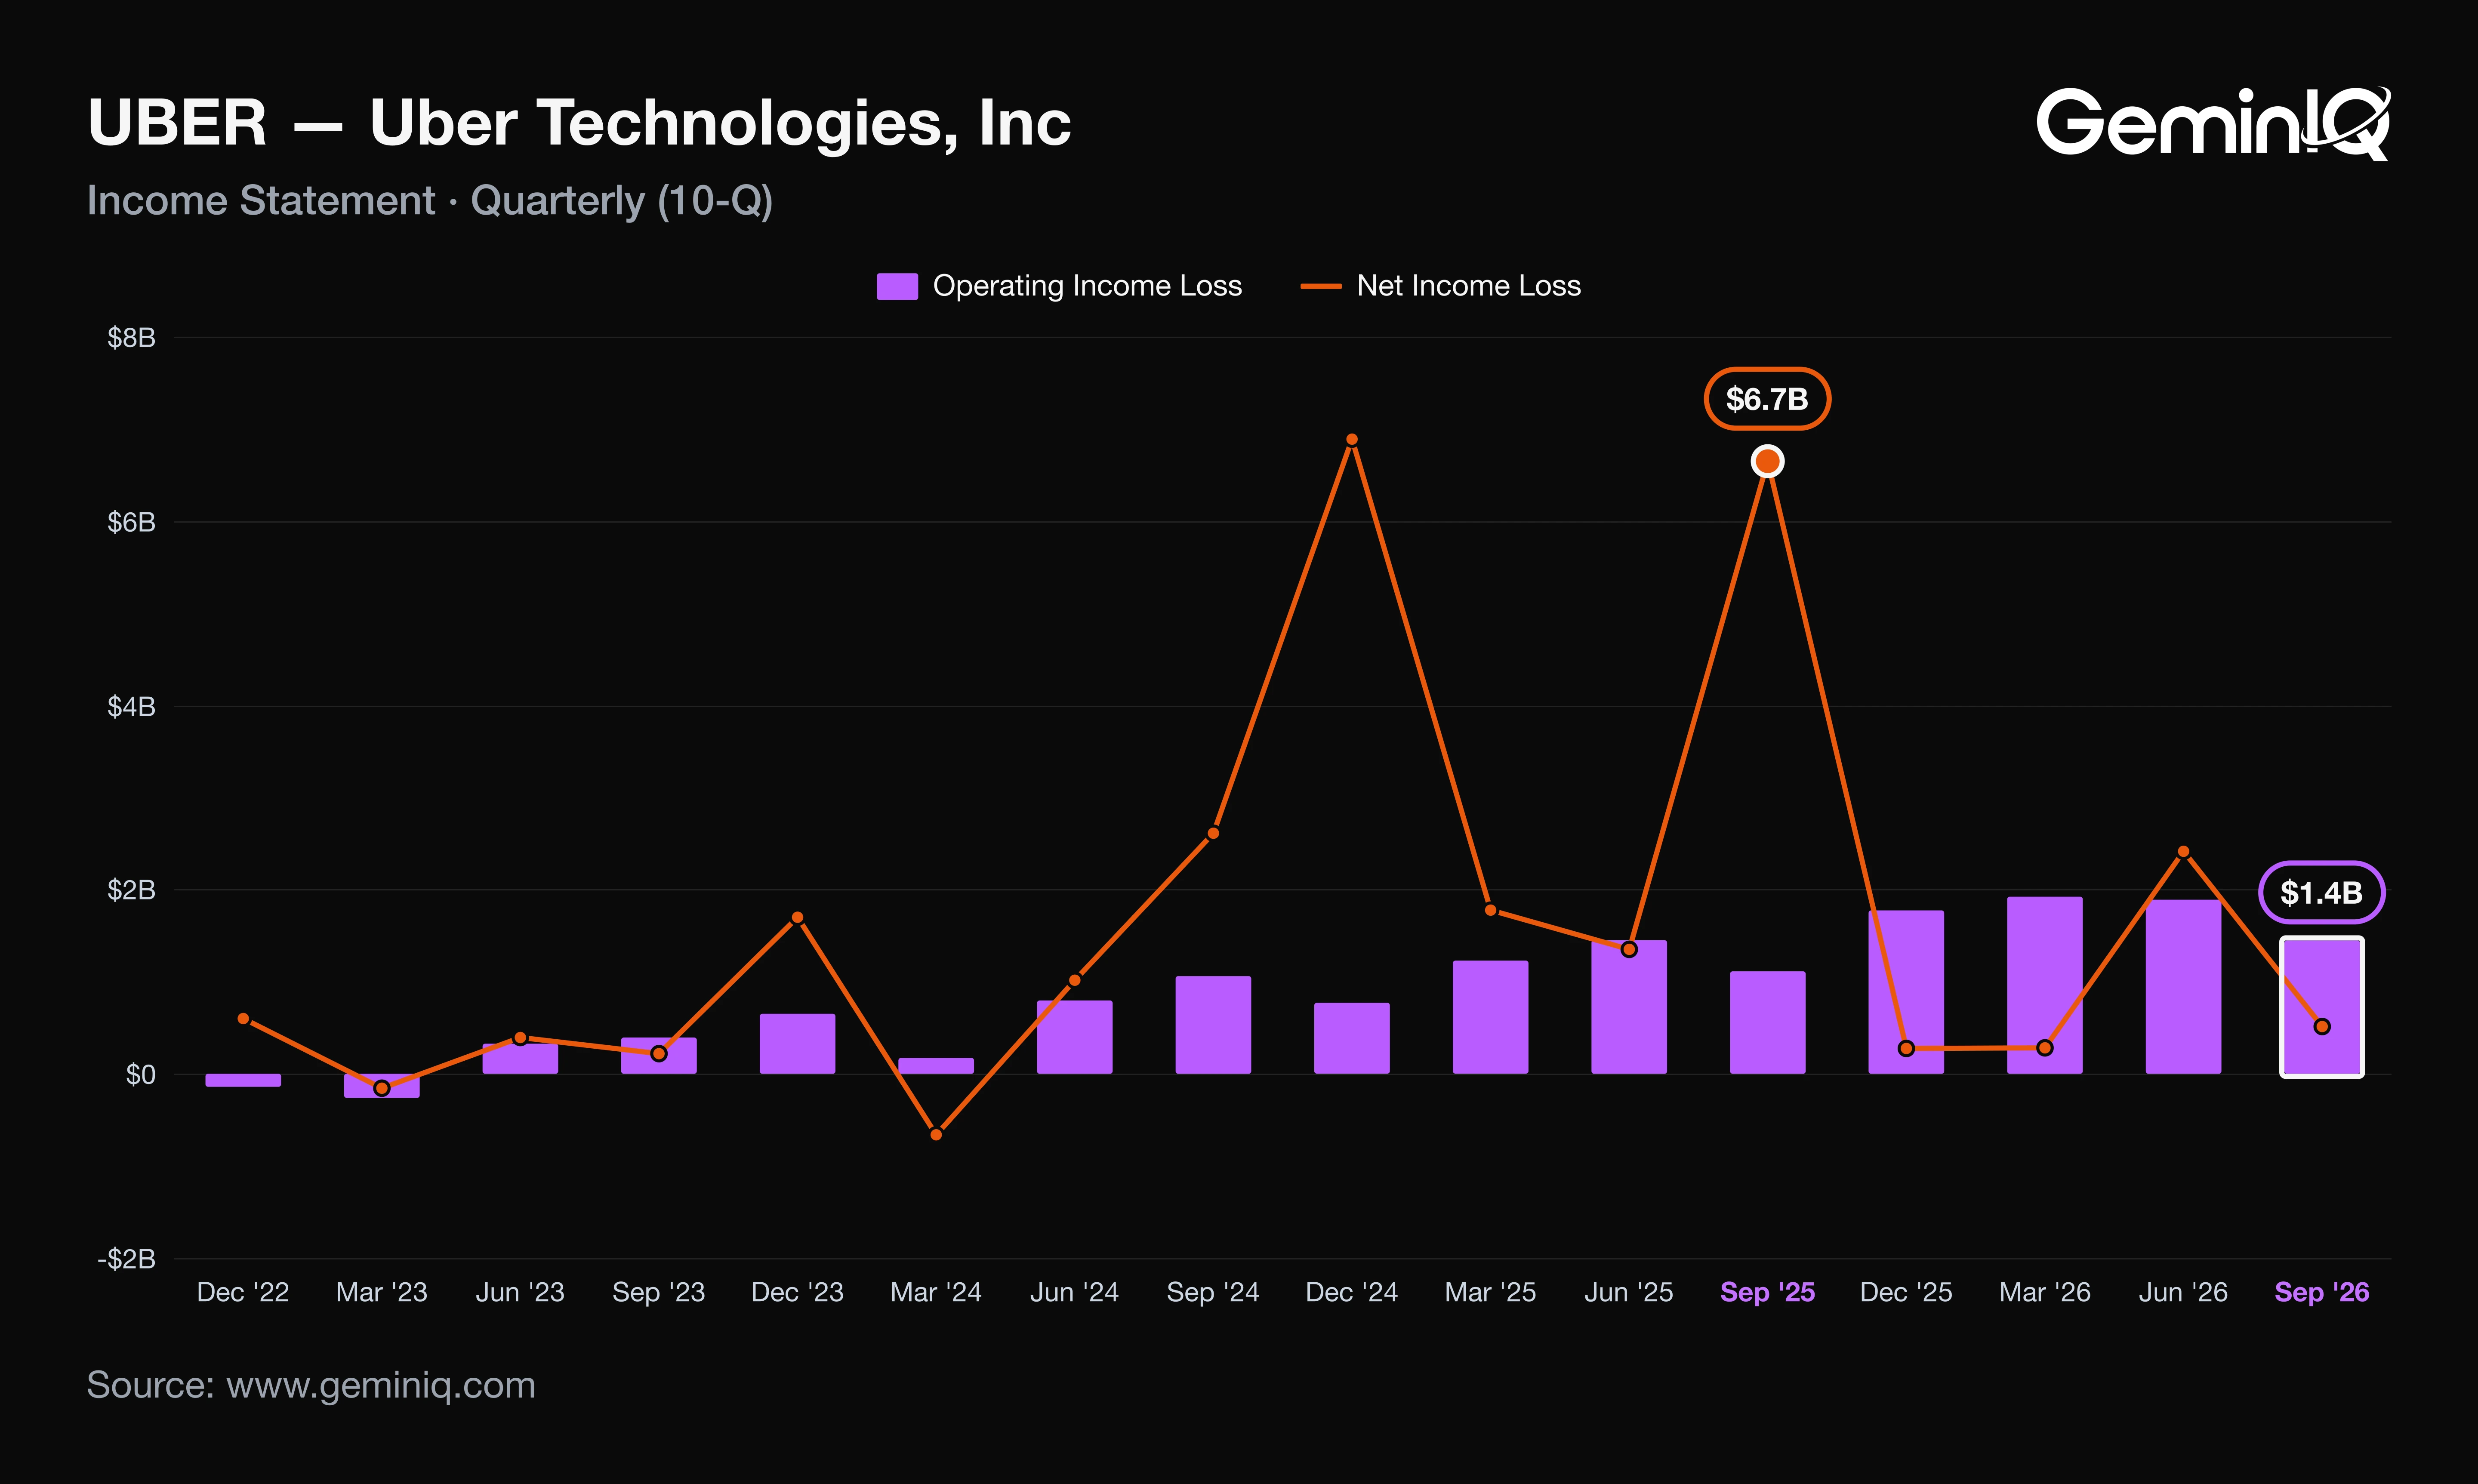
Uber's Q3 2026 diluted EPS was $0.25, down 92.0% from $3.11 and the seventh-lowest of the last 16 quarters, while operating income rose 30.0%. The collapse in EPS happened below the operating line.
The Data: Pretax income was $855 million against $2,620 million a year earlier. Other income (expense), net swung from a $1,426 million gain to a $616 million loss, including a $476 million net loss on equity investments: $354 million on Grab and $239 million on Aurora, offset by a $161 million gain on Didi. The tax line went from a $4,046 million benefit to a $244 million provision. Net income attributable to Uber was $512 million against $6,652 million.
Why: The year-ago figure was mostly non-operating. The release's own footnote attributes it to a $4.9 billion tax valuation release and a $1.5 billion pre-tax gain on equity investments. Removing only the release leaves roughly $1.7 billion, and that remainder still rested on securities marks that reversed sign this quarter. Operating margin of 9.8% was the sixth-highest of the last 16 quarters, though it fell from 13.3% in Q2 as operating income dropped 23.4% from $1.89 billion. The 8-K led instead with non-GAAP EPS of $0.88, up 35%.
What Uber's Q3 2026 10-Q Shows Beyond the Press Release
Uber's Q3 2026 gross profit was $6.42 billion, up 19.8% from $5.36 billion, which lifted GeminIQ's pre-calculated Gross Profit Margin to 43.5%, the third-highest of the last 16 quarters. Most of that margin gain is presentation.
A reader would expect a 3.7-point gain to reflect better unit economics. Instead the 10-Q shows a booking change.
The Data: The release led with Gross Bookings up 20%, while revenue grew 10%. The 10-Q's MD&A states that a UK Mobility business model change, effective January 2, 2026, cut revenue by $1.1 billion and cut driver payments in cost of revenue by the same $1.1 billion. Cost of revenue rose only 3% to $8.35 billion.
Why: Because the change shrinks both revenue and cost of revenue by equal dollars, gross profit is untouched and the percentage rises. Adding $1.1 billion back to both lines gives a gross margin near 40.4% against 39.8% a year earlier, a gain of about 0.6 points rather than 3.7. A second presentation effect arrived July 1, 2026, when Uber moved some network costs from cost of revenue to operating expenses; the 10-Q attributes $130 million of the 48% jump in research and development to it.
Year-over-year margin comparisons carry the UK effect through Q4 2026, because it took effect in January. Any margin gain that coincides with a booking-model change needs the two restated on the same basis before it counts as improvement.
Uber Q3 2026 Free Cash Flow, Buybacks and Debt
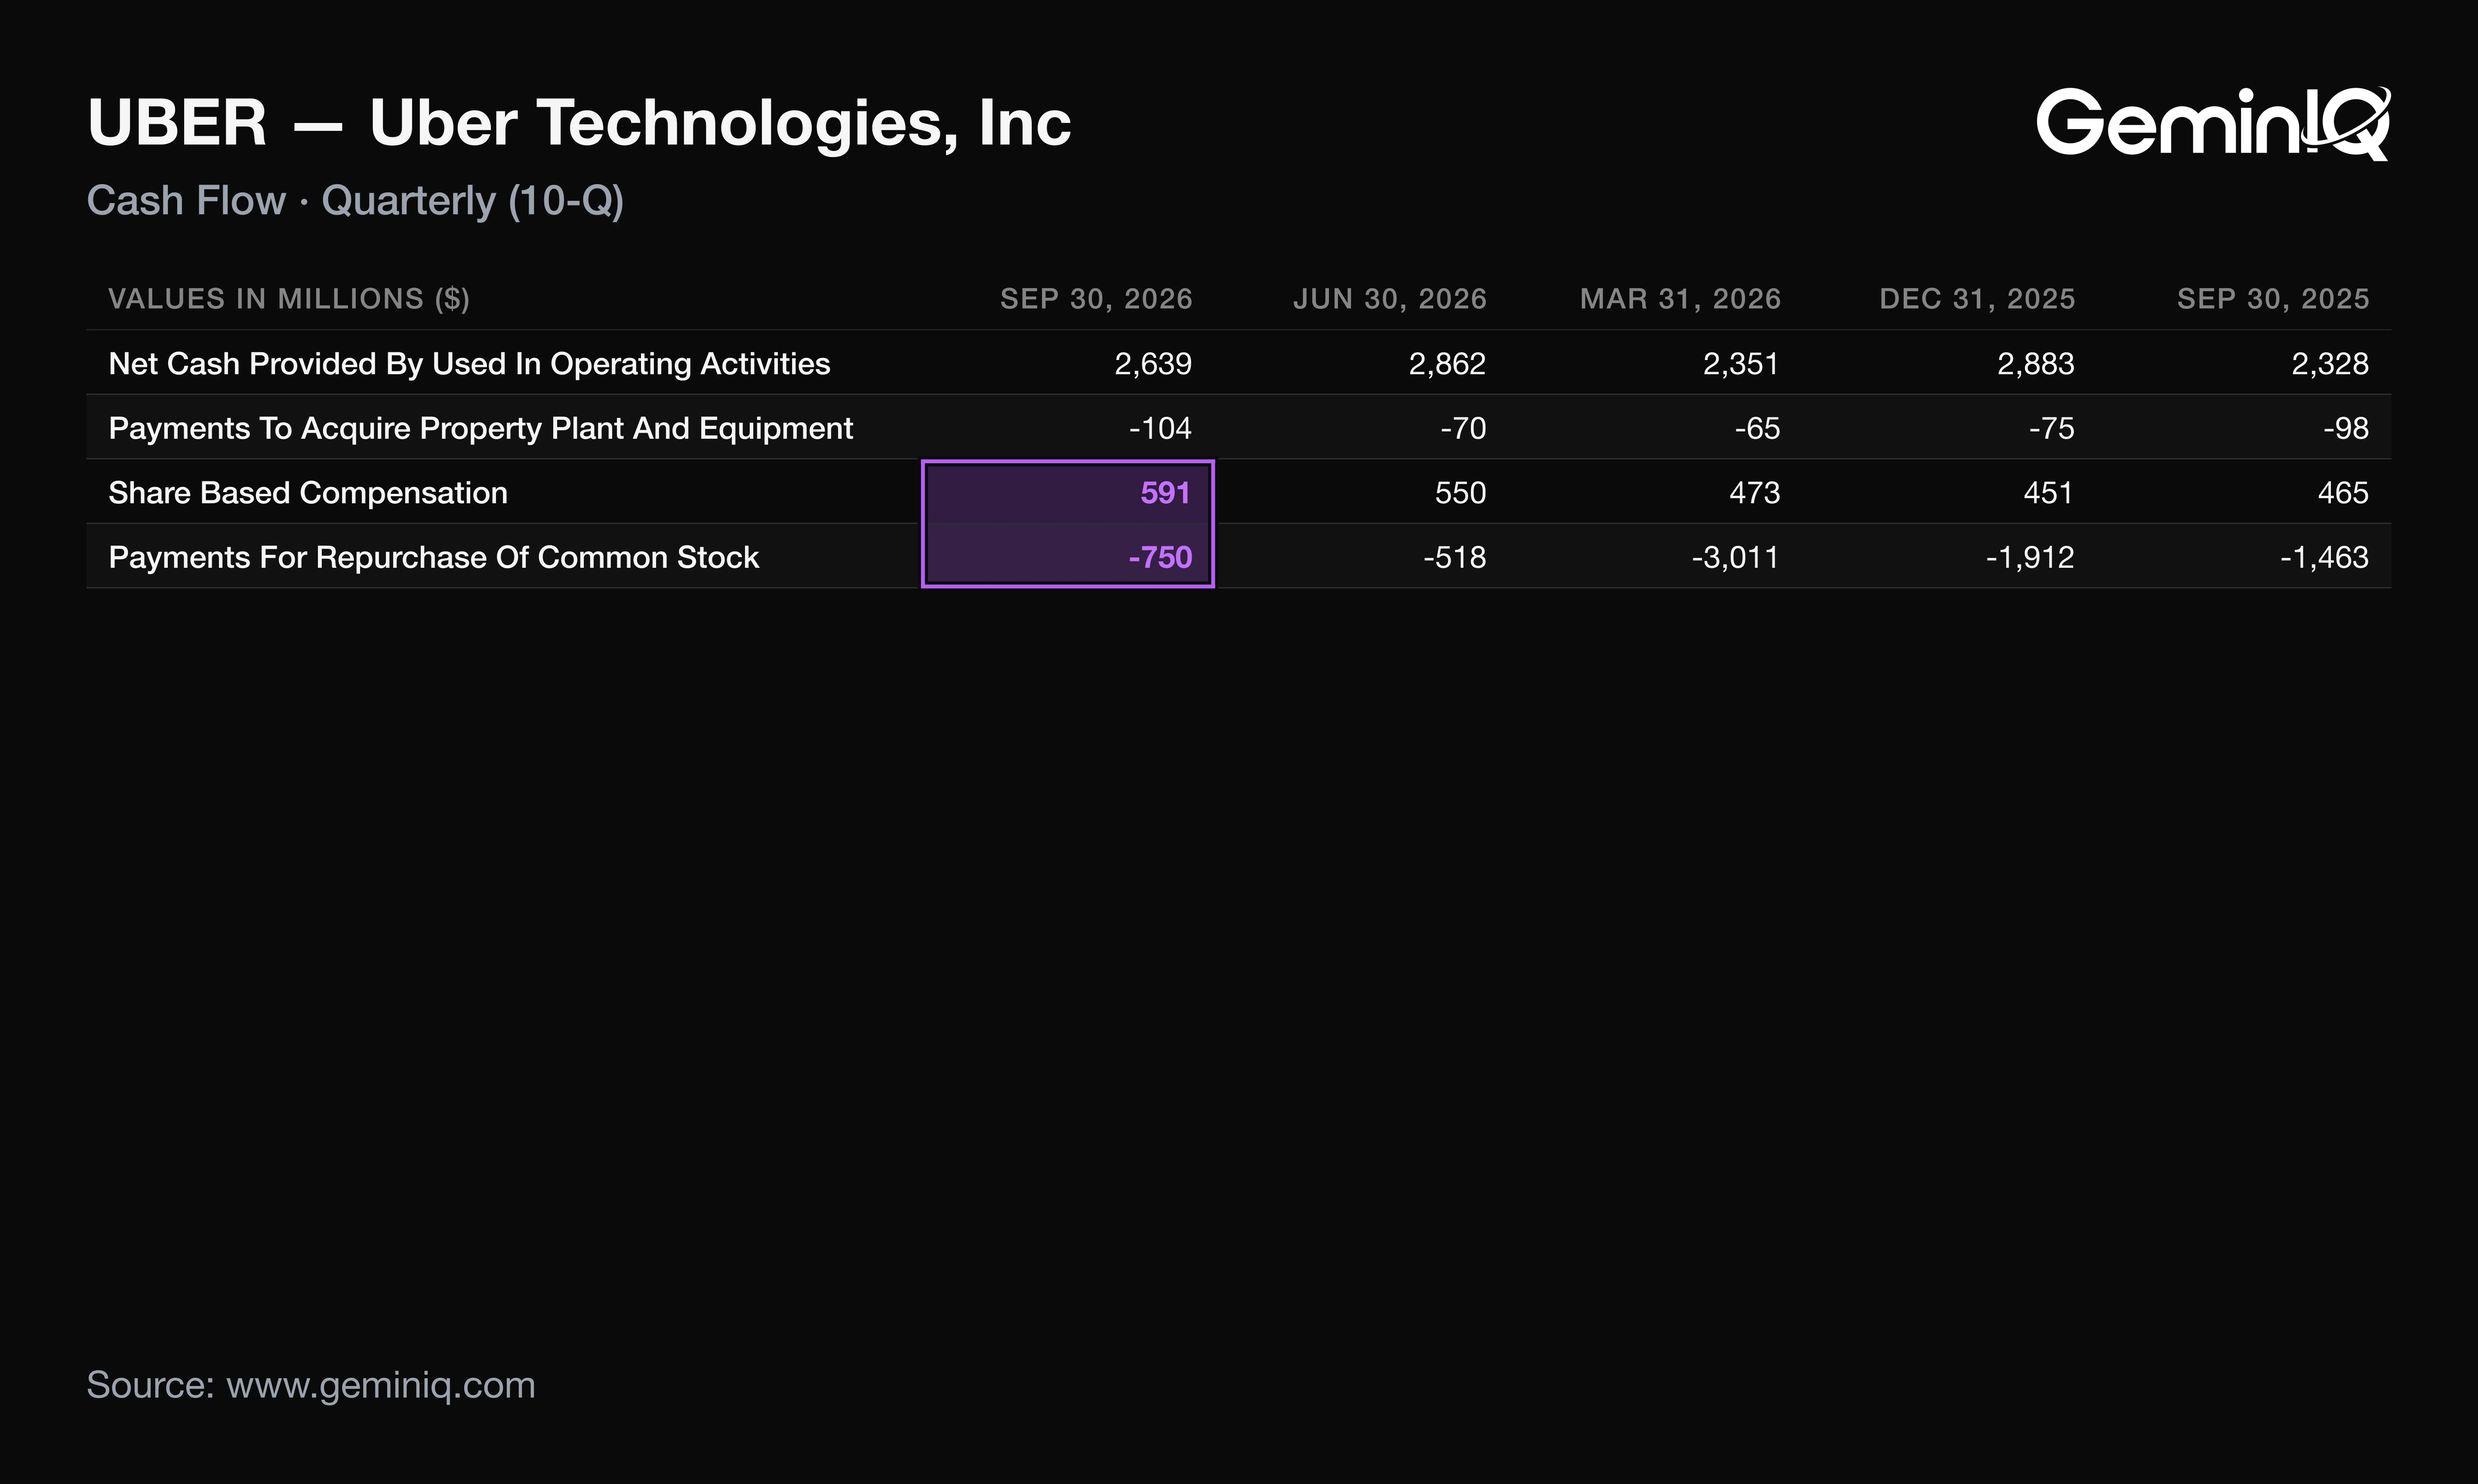
Uber's Q3 2026 free cash flow was $2.54 billion, up 13.7% and the third-highest of the last 16 quarters, per GeminIQ's pre-calculated Free Cash Flow. Cash generation outran earnings, yet buybacks only held the share count flat while debt climbed.
The Data: Operating cash flow of $2.64 billion was about five times net income, and trailing free cash flow reached $10.42 billion against $8.66 billion a year earlier. Uber repurchased 10.0 million shares for $750 million in the quarter, against $591 million of stock-based compensation. Diluted shares were 2,050.32 million against 2,050.22 million in Q2. Total debt rose to $15.79 billion from $10.60 billion at December 31, 2025, after a €4.5 billion ($5.2 billion) Euro note issue on September 15.
Why: Buybacks exceeded stock compensation by only $159 million, so the share count could not fall. The debt step-up sits beside a pending Delivery Hero takeover offer at €41.50 per share, which Uber says it will fund with cash and new debt. The 10-Q labels the Euro note proceeds general corporate purposes, so the link to the offer is timing, not a stated use.
Uber's Q4 2026 Guidance After Q3
In its November 4 8-K, Uber guided Q4 2026 Gross Bookings to $63.25 billion to $65.25 billion, 18% to 22% growth in constant currency, and non-GAAP EPS to $0.95 to $0.99. Uber landed inside its Q3 bookings range and at the top of its EPS range, and the Q4 band repeats it.
The Data: The Q2 8-K guided Q3 Gross Bookings to $58.25 billion to $60.25 billion and non-GAAP EPS to $0.84 to $0.88. Uber reported $59.82 billion and $0.88, both inside the ranges. Q3 constant-currency growth was 20%, the midpoint of an 18% to 22% band that Q4 now repeats, after 22% in Q2.
Why: A company guiding the same growth band two quarters running is guiding to a growth rate that has stopped accelerating; the Q4 EPS midpoint of $0.97 against $0.88 is where the guided improvement sits. Uber says it cannot reconcile forward non-GAAP EPS to GAAP, citing legal settlements and gains or losses on equity securities. GAAP EPS sits outside the guidance.
How UBER Stock Has Moved After Past Earnings Reports
Across the last 12 Uber 10-Q filings with a completed window, filed November 7, 2023 to August 5, 2026, the median one-month return was -0.1%, positive after 6 of 12. These figures describe how Uber's stock moved after its past filings; they are a historical association, not a forecast.
The Data: One-month returns ran from -11.1% after the May 6, 2026 filing to +15.6% after the August 5, 2026 filing, back to back. Past Q3 filings were followed by one-month returns of +14.9% (2023), -0.8% (2024) and -7.5% (2025). The newest filing has no return yet. The Earnings Reaction Heat Map shows each window; GeminIQ's stock reaction study covers the wider pattern.
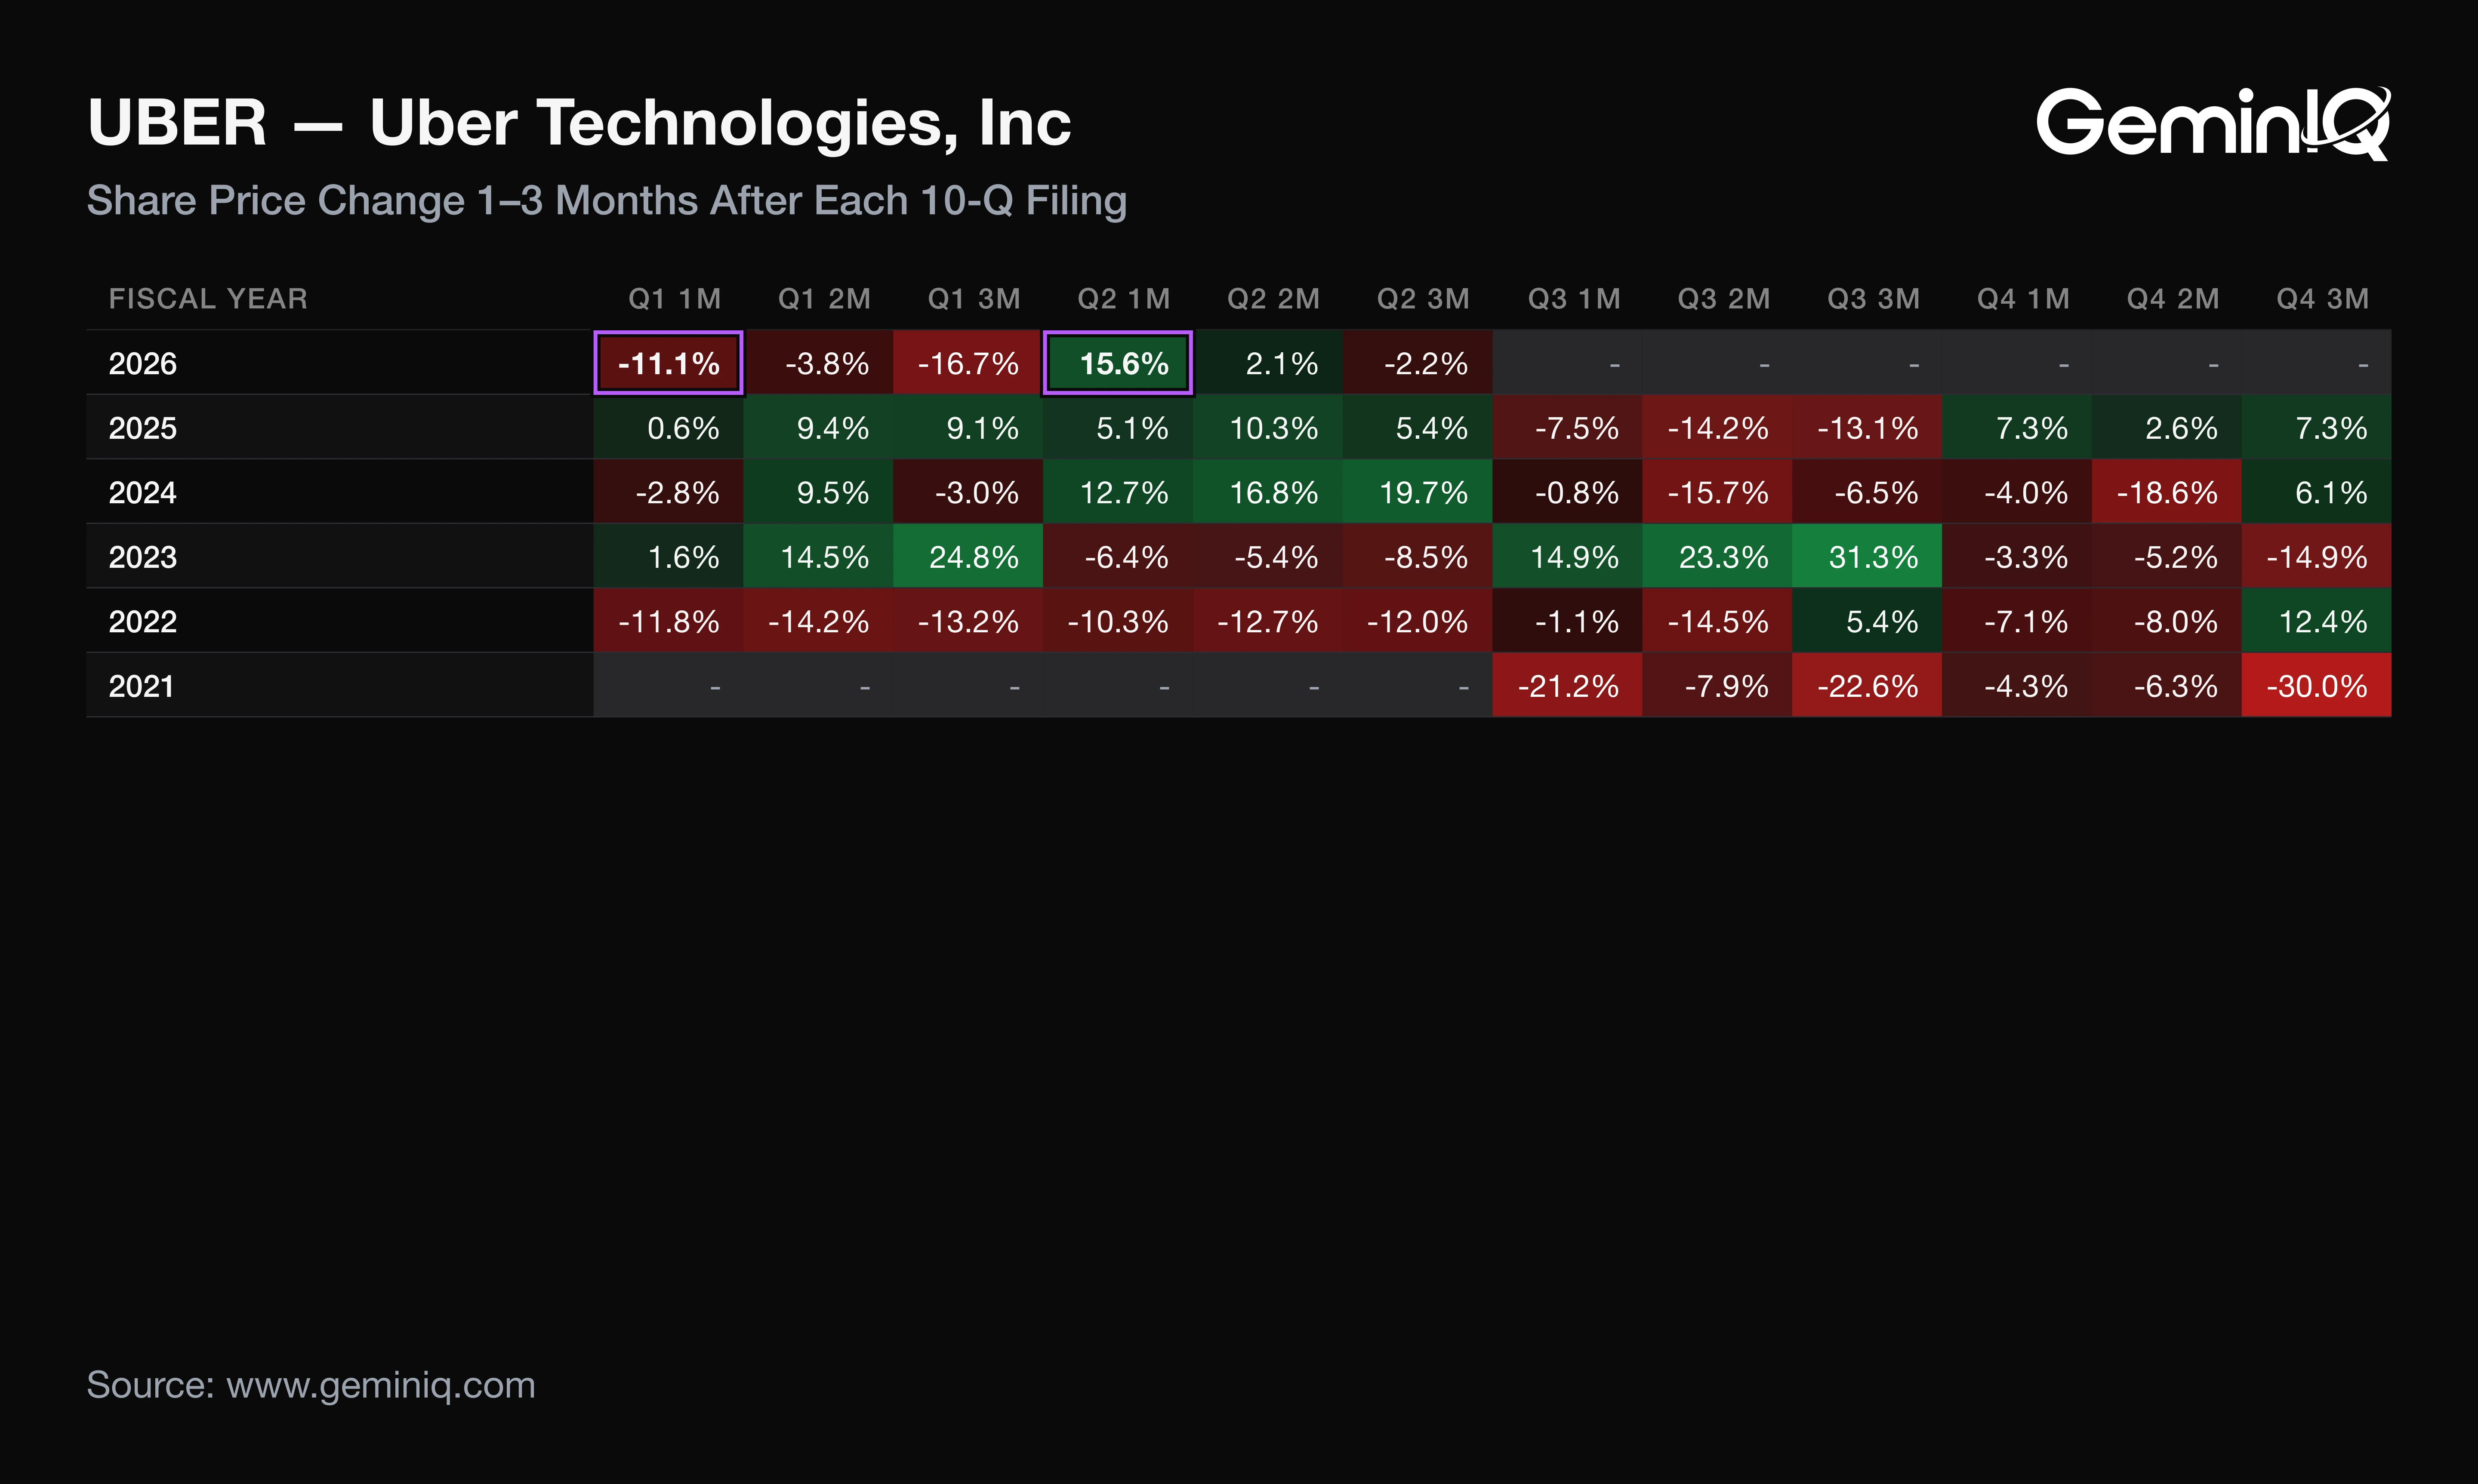
Why: The 26.7-point spread between those two filings sits against a median near zero.
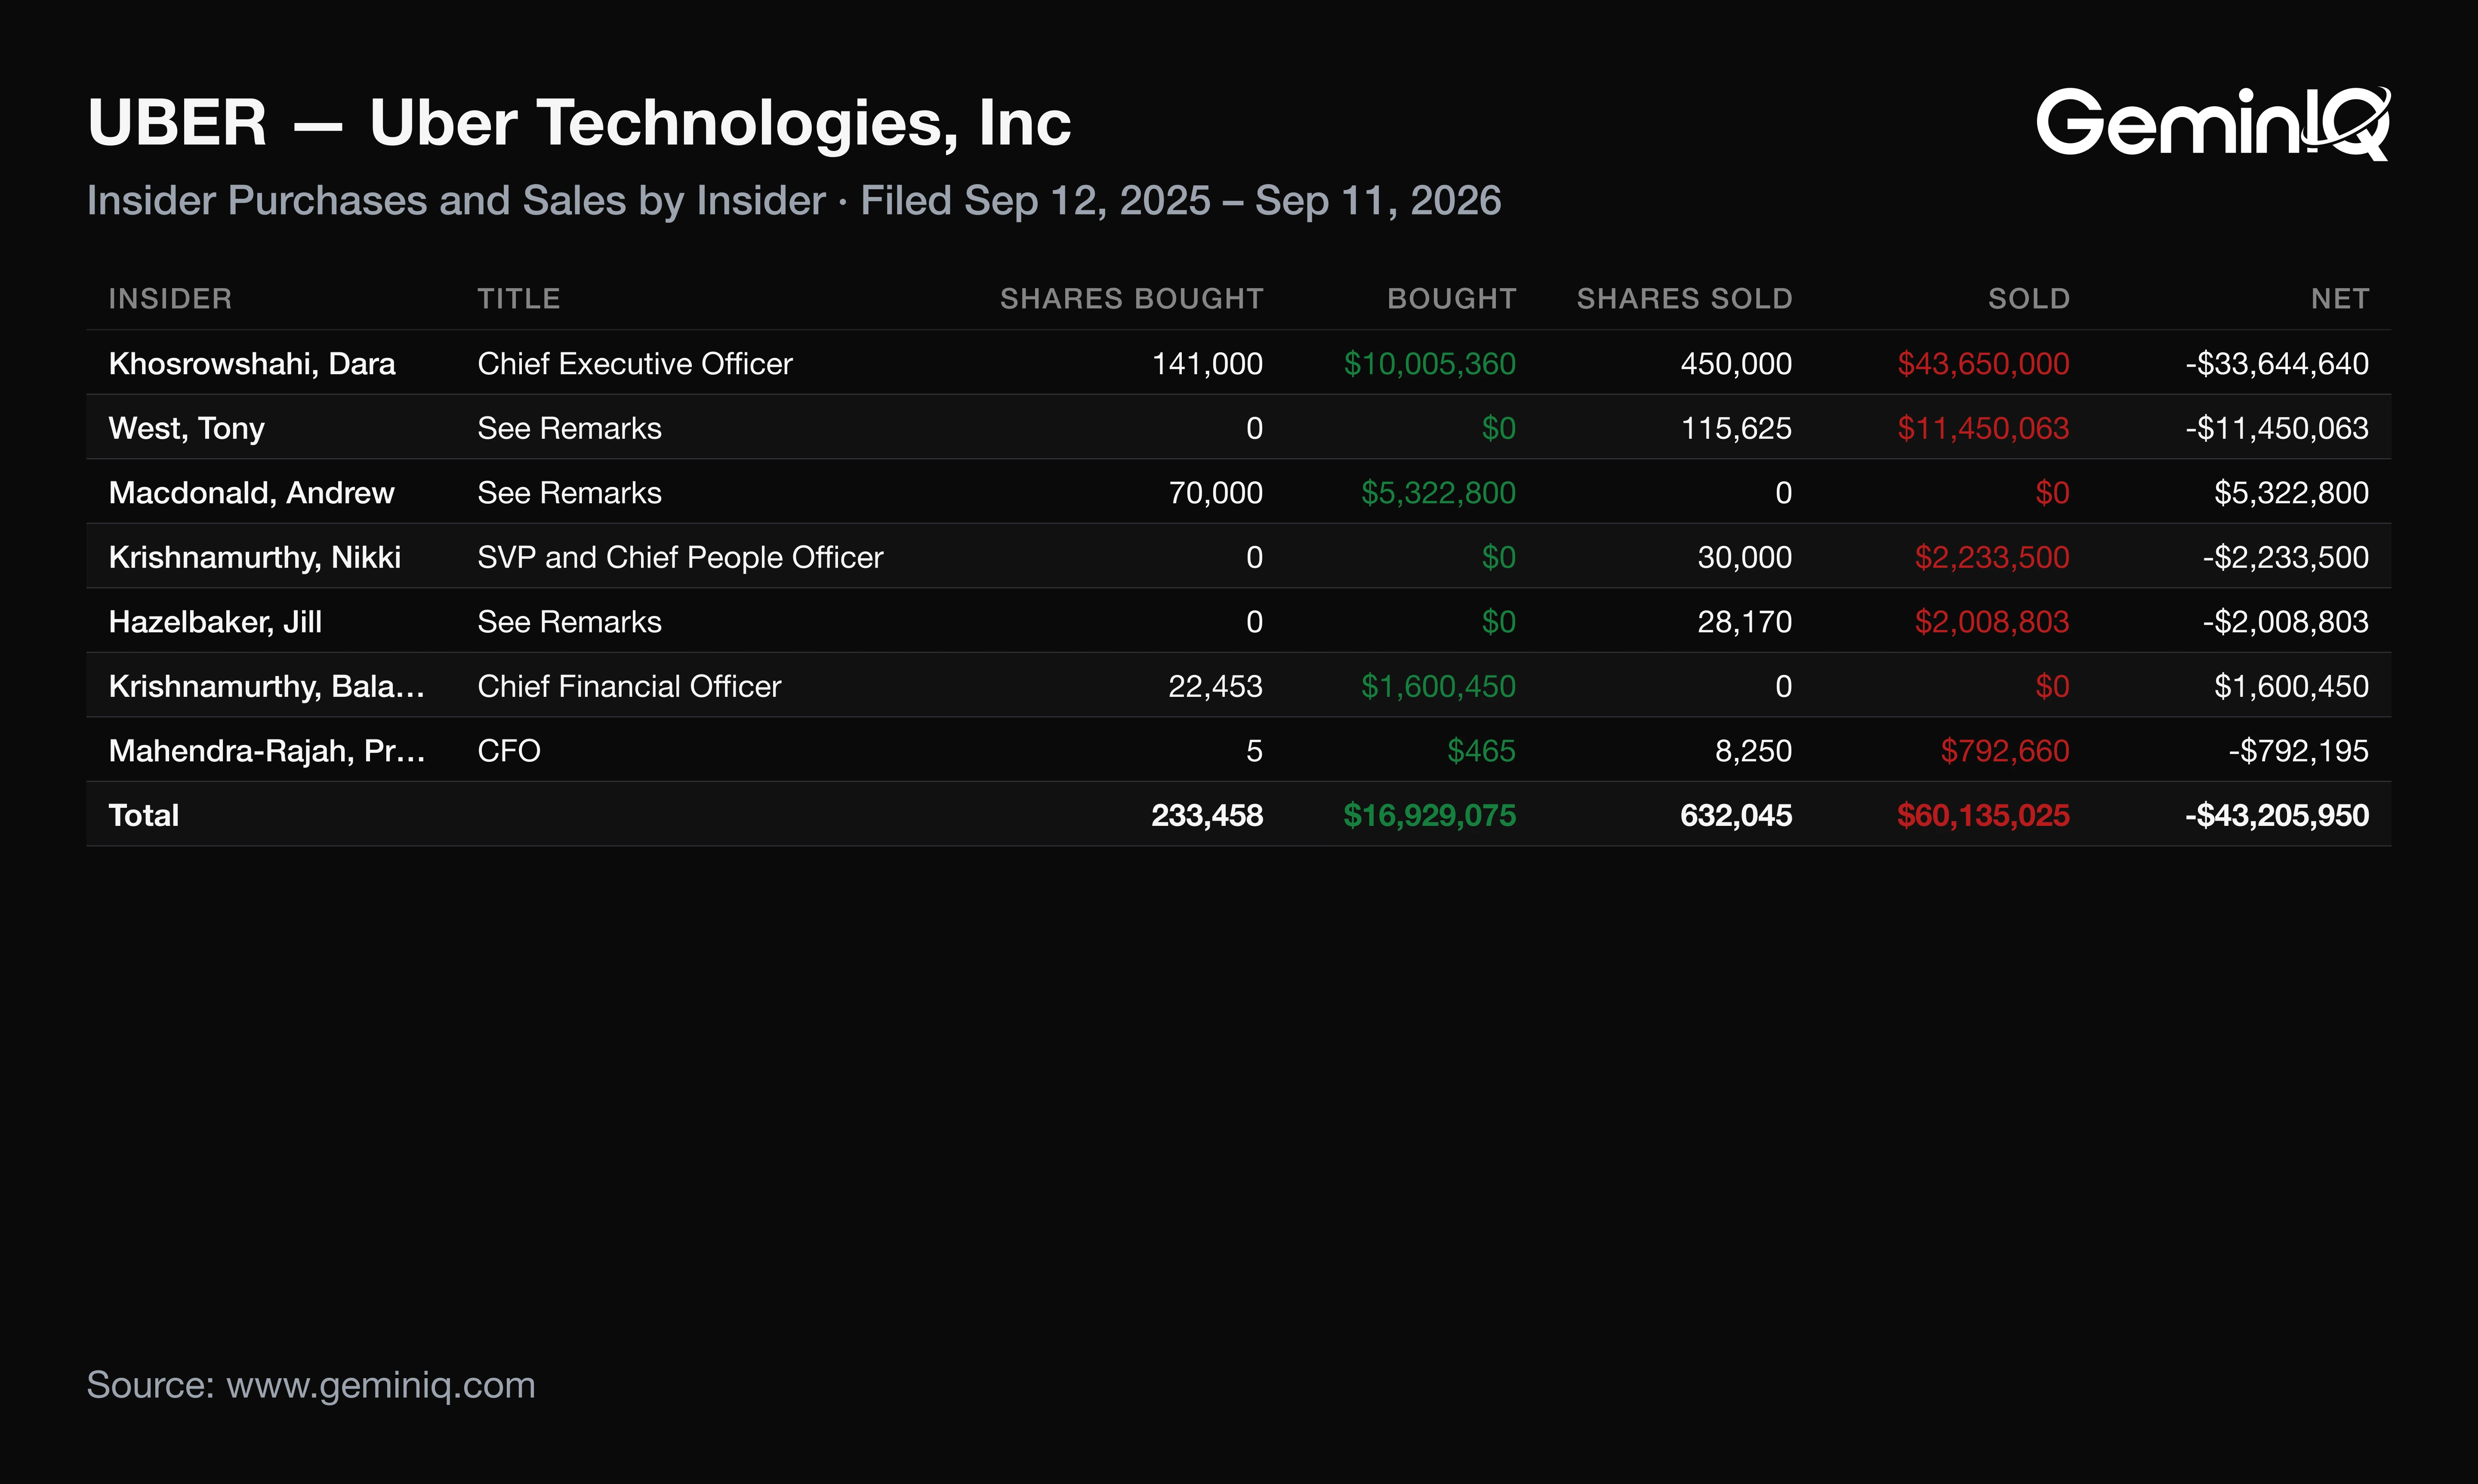
Form 4 data filed from September 12, 2025 to September 11, 2026 shows 12 sales totaling $60.1 million and 4 purchases totaling $16.9 million. The prior 12 months held 13 sales and no purchases. Dara Khosrowshahi accounted for $43.6 million, or 73%, of the sales, and the latest purchase was filed September 10, 2026. Institutions held 81.55% of shares at June 30, 2026, up 1.84 points in a year and the highest of the last 16 quarters; the September 30 13F has not yet been filed.
A stock whose post-filing returns split evenly between gains and losses gives a reader a range to size, not a direction to extrapolate.
Frequently Asked Questions
When does Uber report earnings?
Uber reported its Q3 2026 results and filed the 10-Q on November 4, 2026. It filed its Q3 2025 results on November 4, 2025 and its fourth-quarter results on February 13, 2026. That filing pattern is a record, not a forecast of the next date.
Does Uber pay a dividend?
Uber paid no dividend in Q3 2026 or in the trailing twelve months. It returned capital through buybacks instead: $750 million in Q3, per the 10-Q.
Is Uber doing well financially?
Uber's trailing net profit margin was 6.17% at Q3 2026, down from 33.60% a year earlier, when the tax valuation release inflated the figure. Trailing operating margin rose to 12.44% from 9.19%.
What was Uber's free cash flow in Q3 2026?
Uber's Q3 2026 free cash flow was $2.54 billion, up 13.7% from $2.23 billion. Capital expenditure of $104 million was the highest of the last 16 quarters yet only about 4% of operating cash flow.
Wall Street's data. Main Street's price.
Institutional terminals charge thousands a year for as-filed accuracy. GeminIQ gives you the same thing for a fraction of the cost: financials built directly from raw SEC EDGAR filings, not third-party APIs, with full XBRL traceability back to the original 10-K or 10-Q. No normalized guesswork, just calculated metrics, charts, screeners, and watchlists built on numbers exactly as the company reported them. Start researching now at GeminIQ.com.
All financial figures cited in this article reference UBER TECHNOLOGIES, INC.'s Q3 2026 10-Q (filed November 4, 2026, period ending September 30, 2026), with guidance and management commentary drawn from the company's Form 8-K earnings release (filed November 4, 2026). All SEC filings are publicly available at SEC EDGAR and SEC EDGAR.
Disclaimer: The content in this blog is for educational and entertainment purposes only and does not constitute financial, legal, or tax advice. Investing involves risk, including the loss of principal. The views expressed are my own and not intended as financial advice or a guarantee of future performance.