
Airline Sector Stock Analysis: One Carrier Is Re-Levering

By Chad Hartman
Published · Last updated
Airline stocks have spent the last two years trading on a single narrative: the pandemic-era balance sheet damage is behind the industry, and the "Big Three" U.S. legacy carriers are back to being investable, cash-generating businesses. Revenue supports that story on the surface. Delta Air Lines (DAL), United Airlines Holdings (UAL), and American Airlines Group (AAL) each closed out their Q1 FY2026 10-Qs (filed in April 2026, period ending March 31, 2026) with trailing-twelve-month revenue growth in the 3.3% to 5.2% range. None of the three is anywhere near the operating losses they were posting three years ago.
But "revenue recovered" and "the balance sheet recovered" are two different claims, and the second one is a trend question, not a snapshot question. A single quarter of Net Debt-to-EBITDA or Altman Z-Score tells you where a company stands today. It says nothing about whether that number has been getting better or worse for the last five years — and in a capital-heavy, debt-financed industry like commercial aviation, the direction of travel matters more than the current altitude.
Using a GeminIQ Custom Watchlist to pull every quarter of Calculated Metrics for Delta, United, and American back to 2021 — not just the latest 10-Q — shows two of the three carriers on a clean, uninterrupted deleveraging path. The third is not.
| Company | Net Debt-to-EBITDA (TTM) | Altman Z-Score | Net Profit Margin (TTM) |
|---|---|---|---|
| Delta Air Lines (DAL) | 1.11x | 1.34 | 6.87% |
| United Airlines (UAL) | 2.00x | 1.29 | 6.06% |
| American Airlines (AAL) | 7.44x | 0.60 | 0.36% |
Phase 1: The Divergence, By the Numbers
Look at the table above for more than a few seconds and one row stops fitting the pattern. Delta and United sit within a point of each other on every column. American isn't close to either — its leverage ratio is 6.70x Delta's, its Altman Z-Score is less than half of either peer's, and its margin is a rounding error next to theirs.
None of that is new information by itself; a single current-quarter comps table would show the same gap. What a snapshot can't show is whether that gap is closing or widening — and that's the actual question this piece answers, because the answer isn't the one the "airlines are back" narrative assumes.
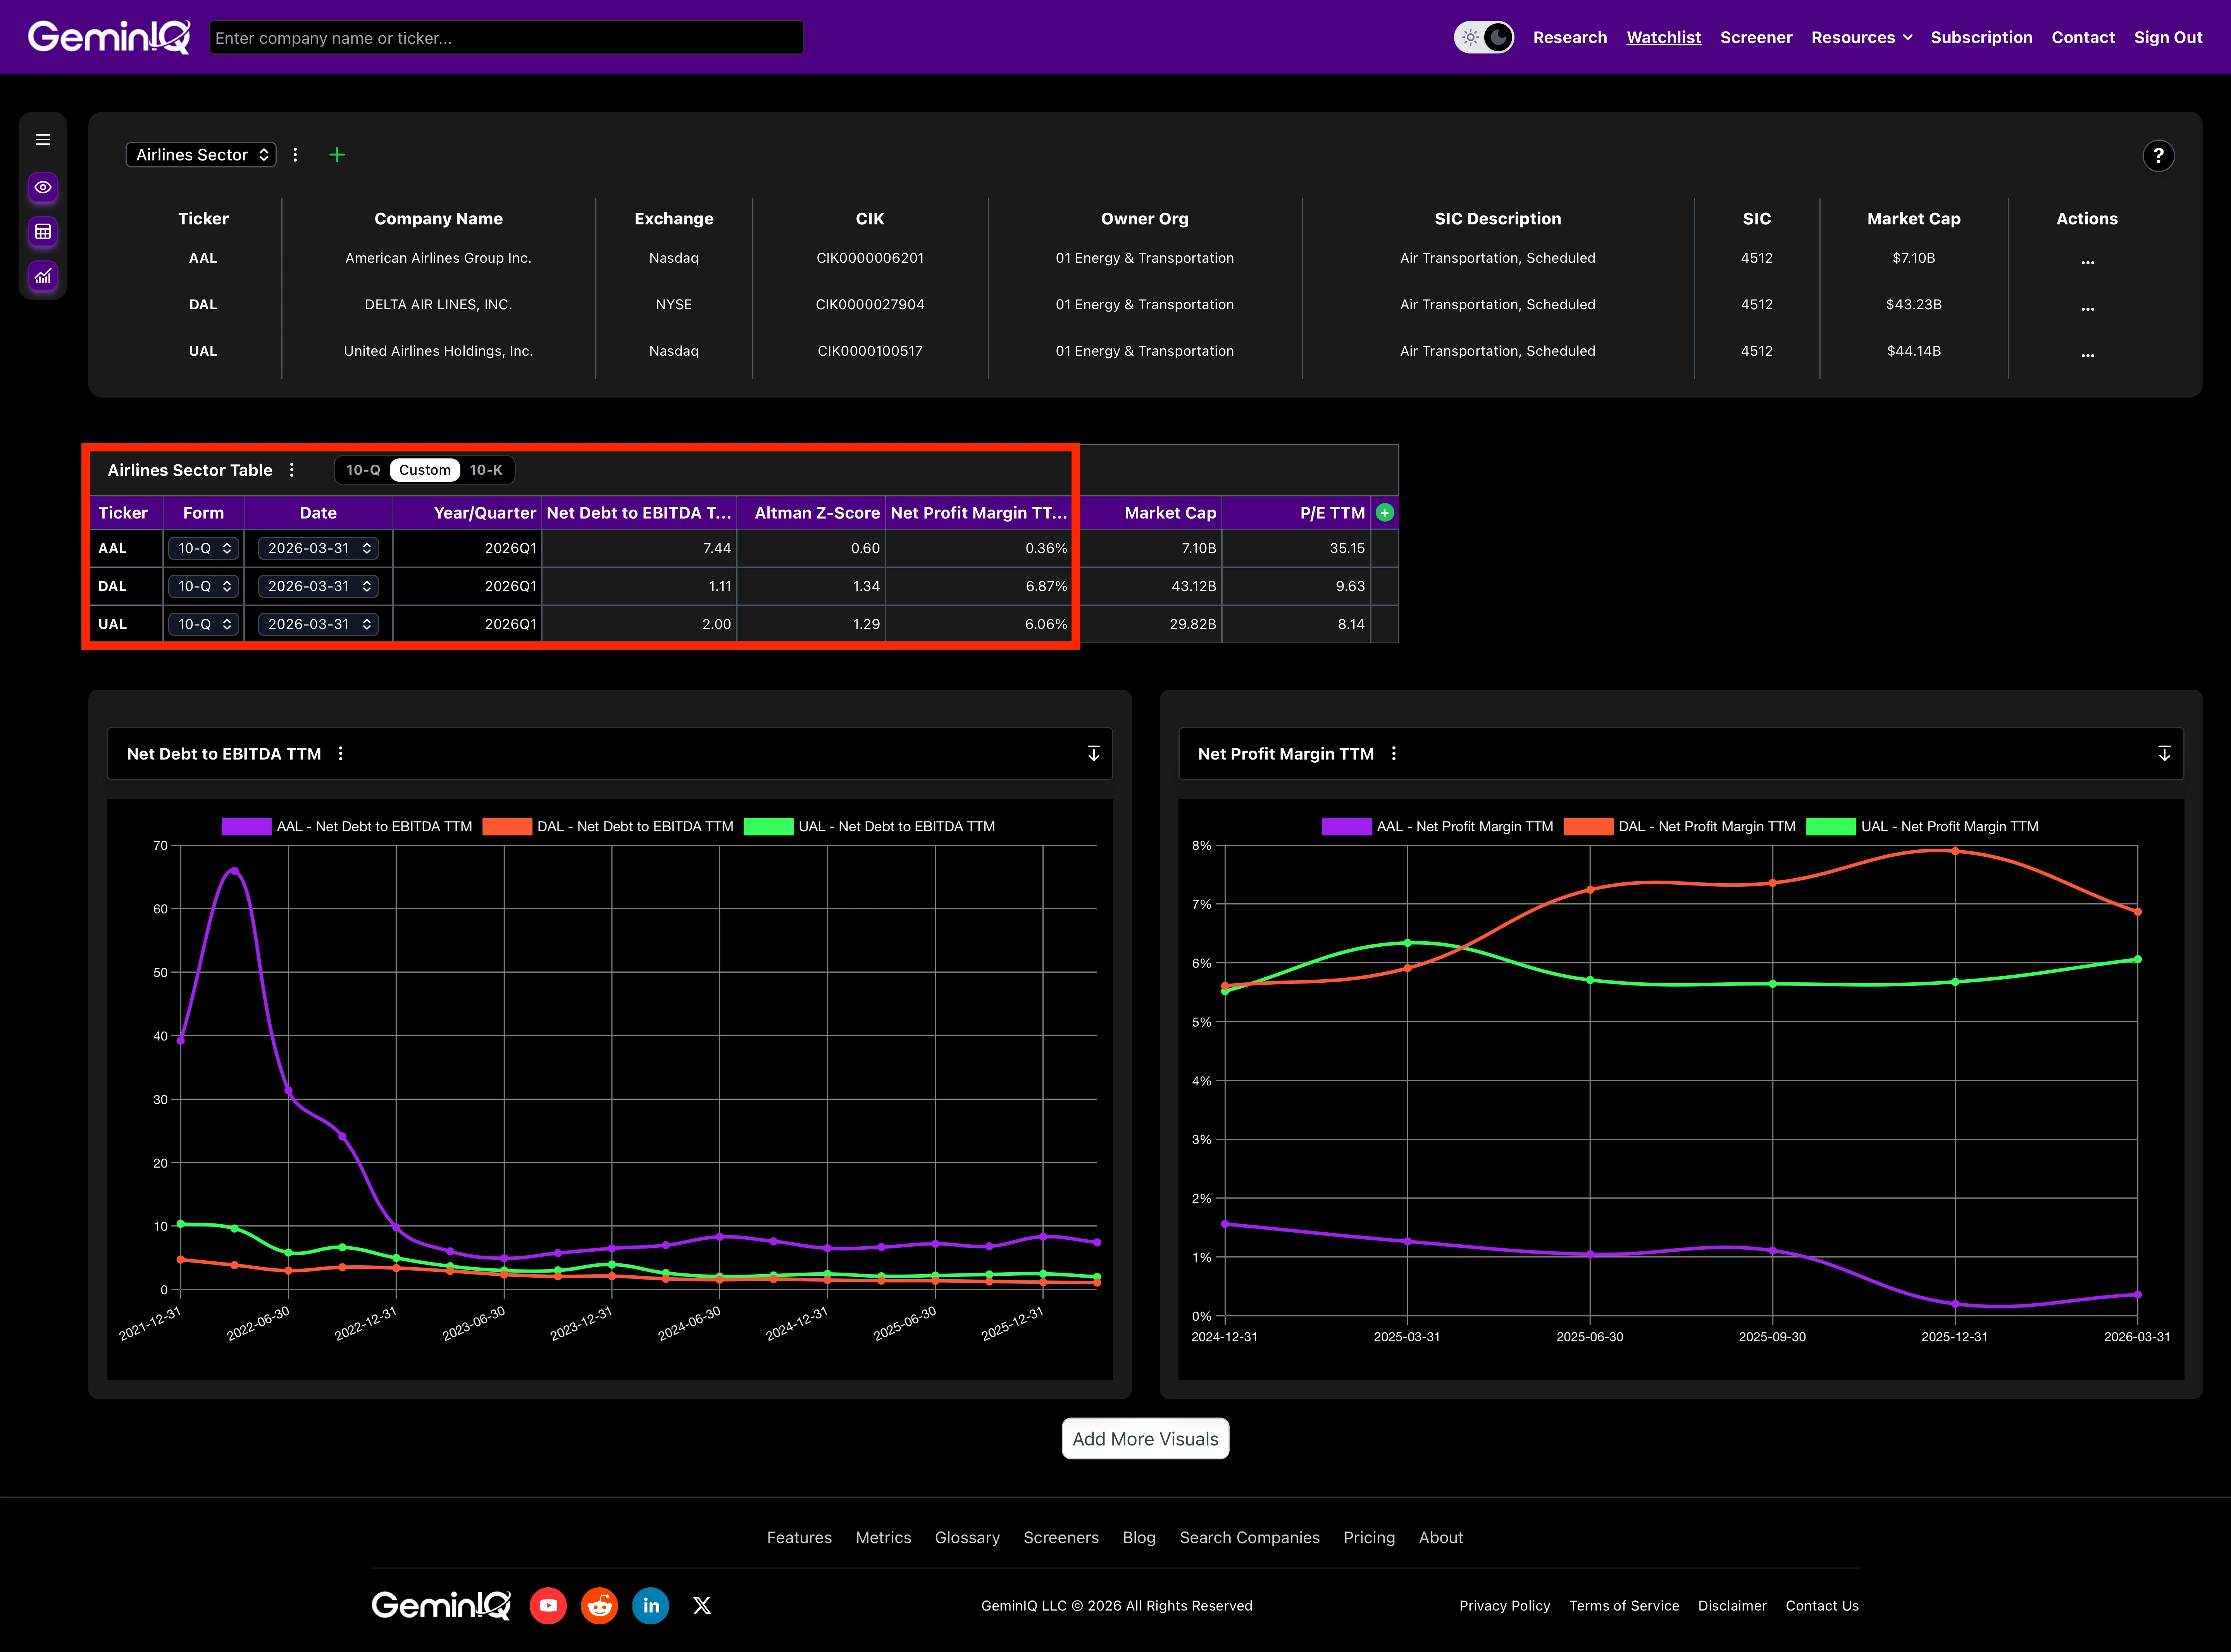 GeminIQ Calculated Metrics comparison showing Net Debt-to-EBITDA, Altman Z-Score, and Net Profit Margin (TTM) side-by-side for Delta, United, and American as of the quarter ended March 31, 2026.
Phase 2: The Leverage Trajectory Since 2021
A standard screener only shows this quarter's Net Debt-to-EBITDA. Pulling the full quarterly history via GeminIQ's Visualizations shows the shape of the last five years, and that shape is the real story.
Delta's Net Debt-to-EBITDA has fallen every single year since 2021, without a single year-over-year reversal: 4.72x at the end of 2021, 3.39x in 2022, 2.12x in 2023, 1.50x in 2024, 1.16x in 2025, and 1.11x as of the latest quarter. United's path was choppier in dollar terms — its net debt actually grew from $15.16 Billion in 2021 to a peak of $27.16 Billion in 2023 as it took on debt to fund fleet growth — but its leverage ratio still came down sharply against a faster-growing EBITDA base: 10.36x, 4.98x, 3.95x, 2.46x, 2.49x, and now 2.00x.
American's ratio also fell hard off its distorted 2021 reading of 39.22x, bottoming at 6.48x in 2023 and 6.51x in 2024. Then it reversed. By the end of 2025 it had climbed back to 8.33x — worse than at any point since 2022 — before ticking down slightly to 7.44x in the most recent quarter. American's total debt did keep falling in dollar terms, from $38.06 Billion in 2021 to $27.72 Billion now. But its EBITDA base shrank faster than its debt did, which is precisely what a raw dollar-debt headline won't tell you.
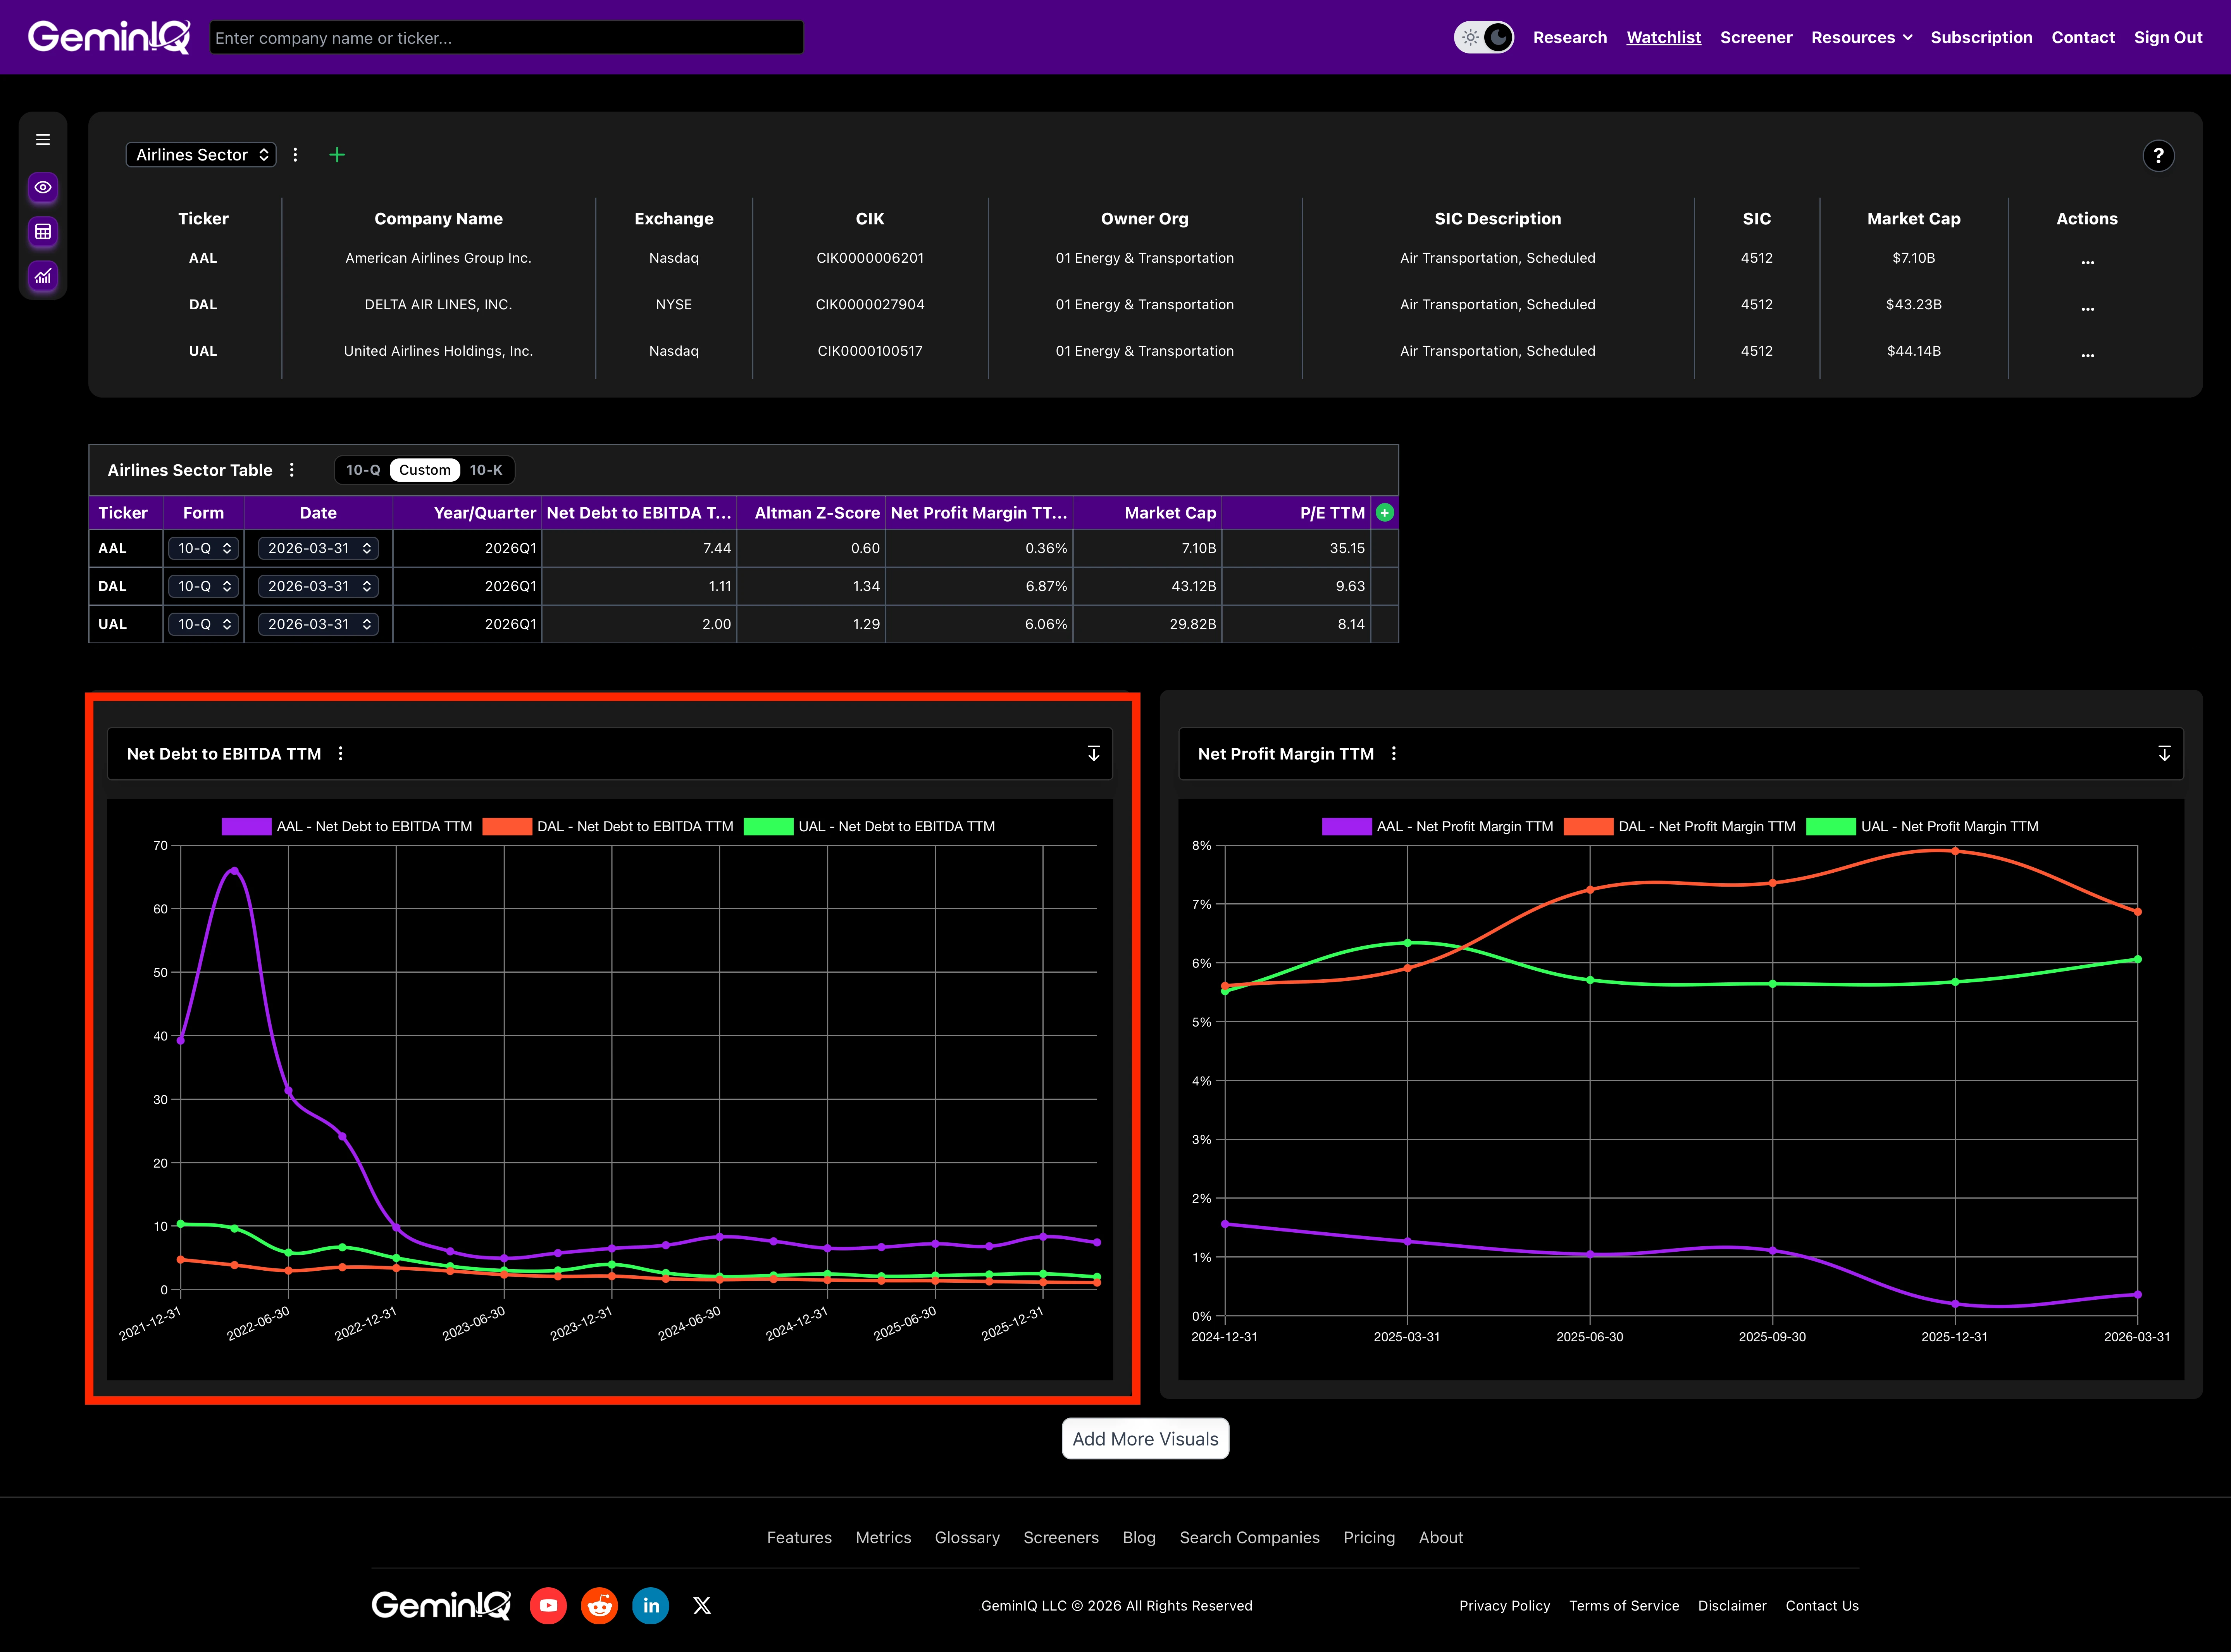 GeminIQ Visualizations chart plotting quarterly Net Debt-to-EBITDA for Delta, United, and American from 2021 through Q1 FY2026, showing Delta and United's continuous decline against American's 2025 reversal.
Phase 3: The Valuation Disconnect
If leverage trends this different are hiding behind similar-looking headlines, the market's pricing should tell on it. It does — just not in the direction a screener would suggest.
Delta carries a $43.12 Billion market cap on a Price-to-Earnings Ratio of 9.63x; United, $29.82 Billion and 8.14x earnings. American is the outlier: priced at just $7.10 Billion, yet carrying the highest P/E ratio of the three at 35.15x. A novice screener read might flag American as either a deep-value name (smallest market cap) or an expensive one (highest multiple). Both readings would miss the actual explanation: American's trailing net income of $202 Million is so thin that the P/E ratio's denominator is doing almost none of the work a healthy earnings base would do. A P/E ratio built on next-to-nothing earnings isn't a valuation signal — it's a symptom of the margin collapse the next section quantifies.
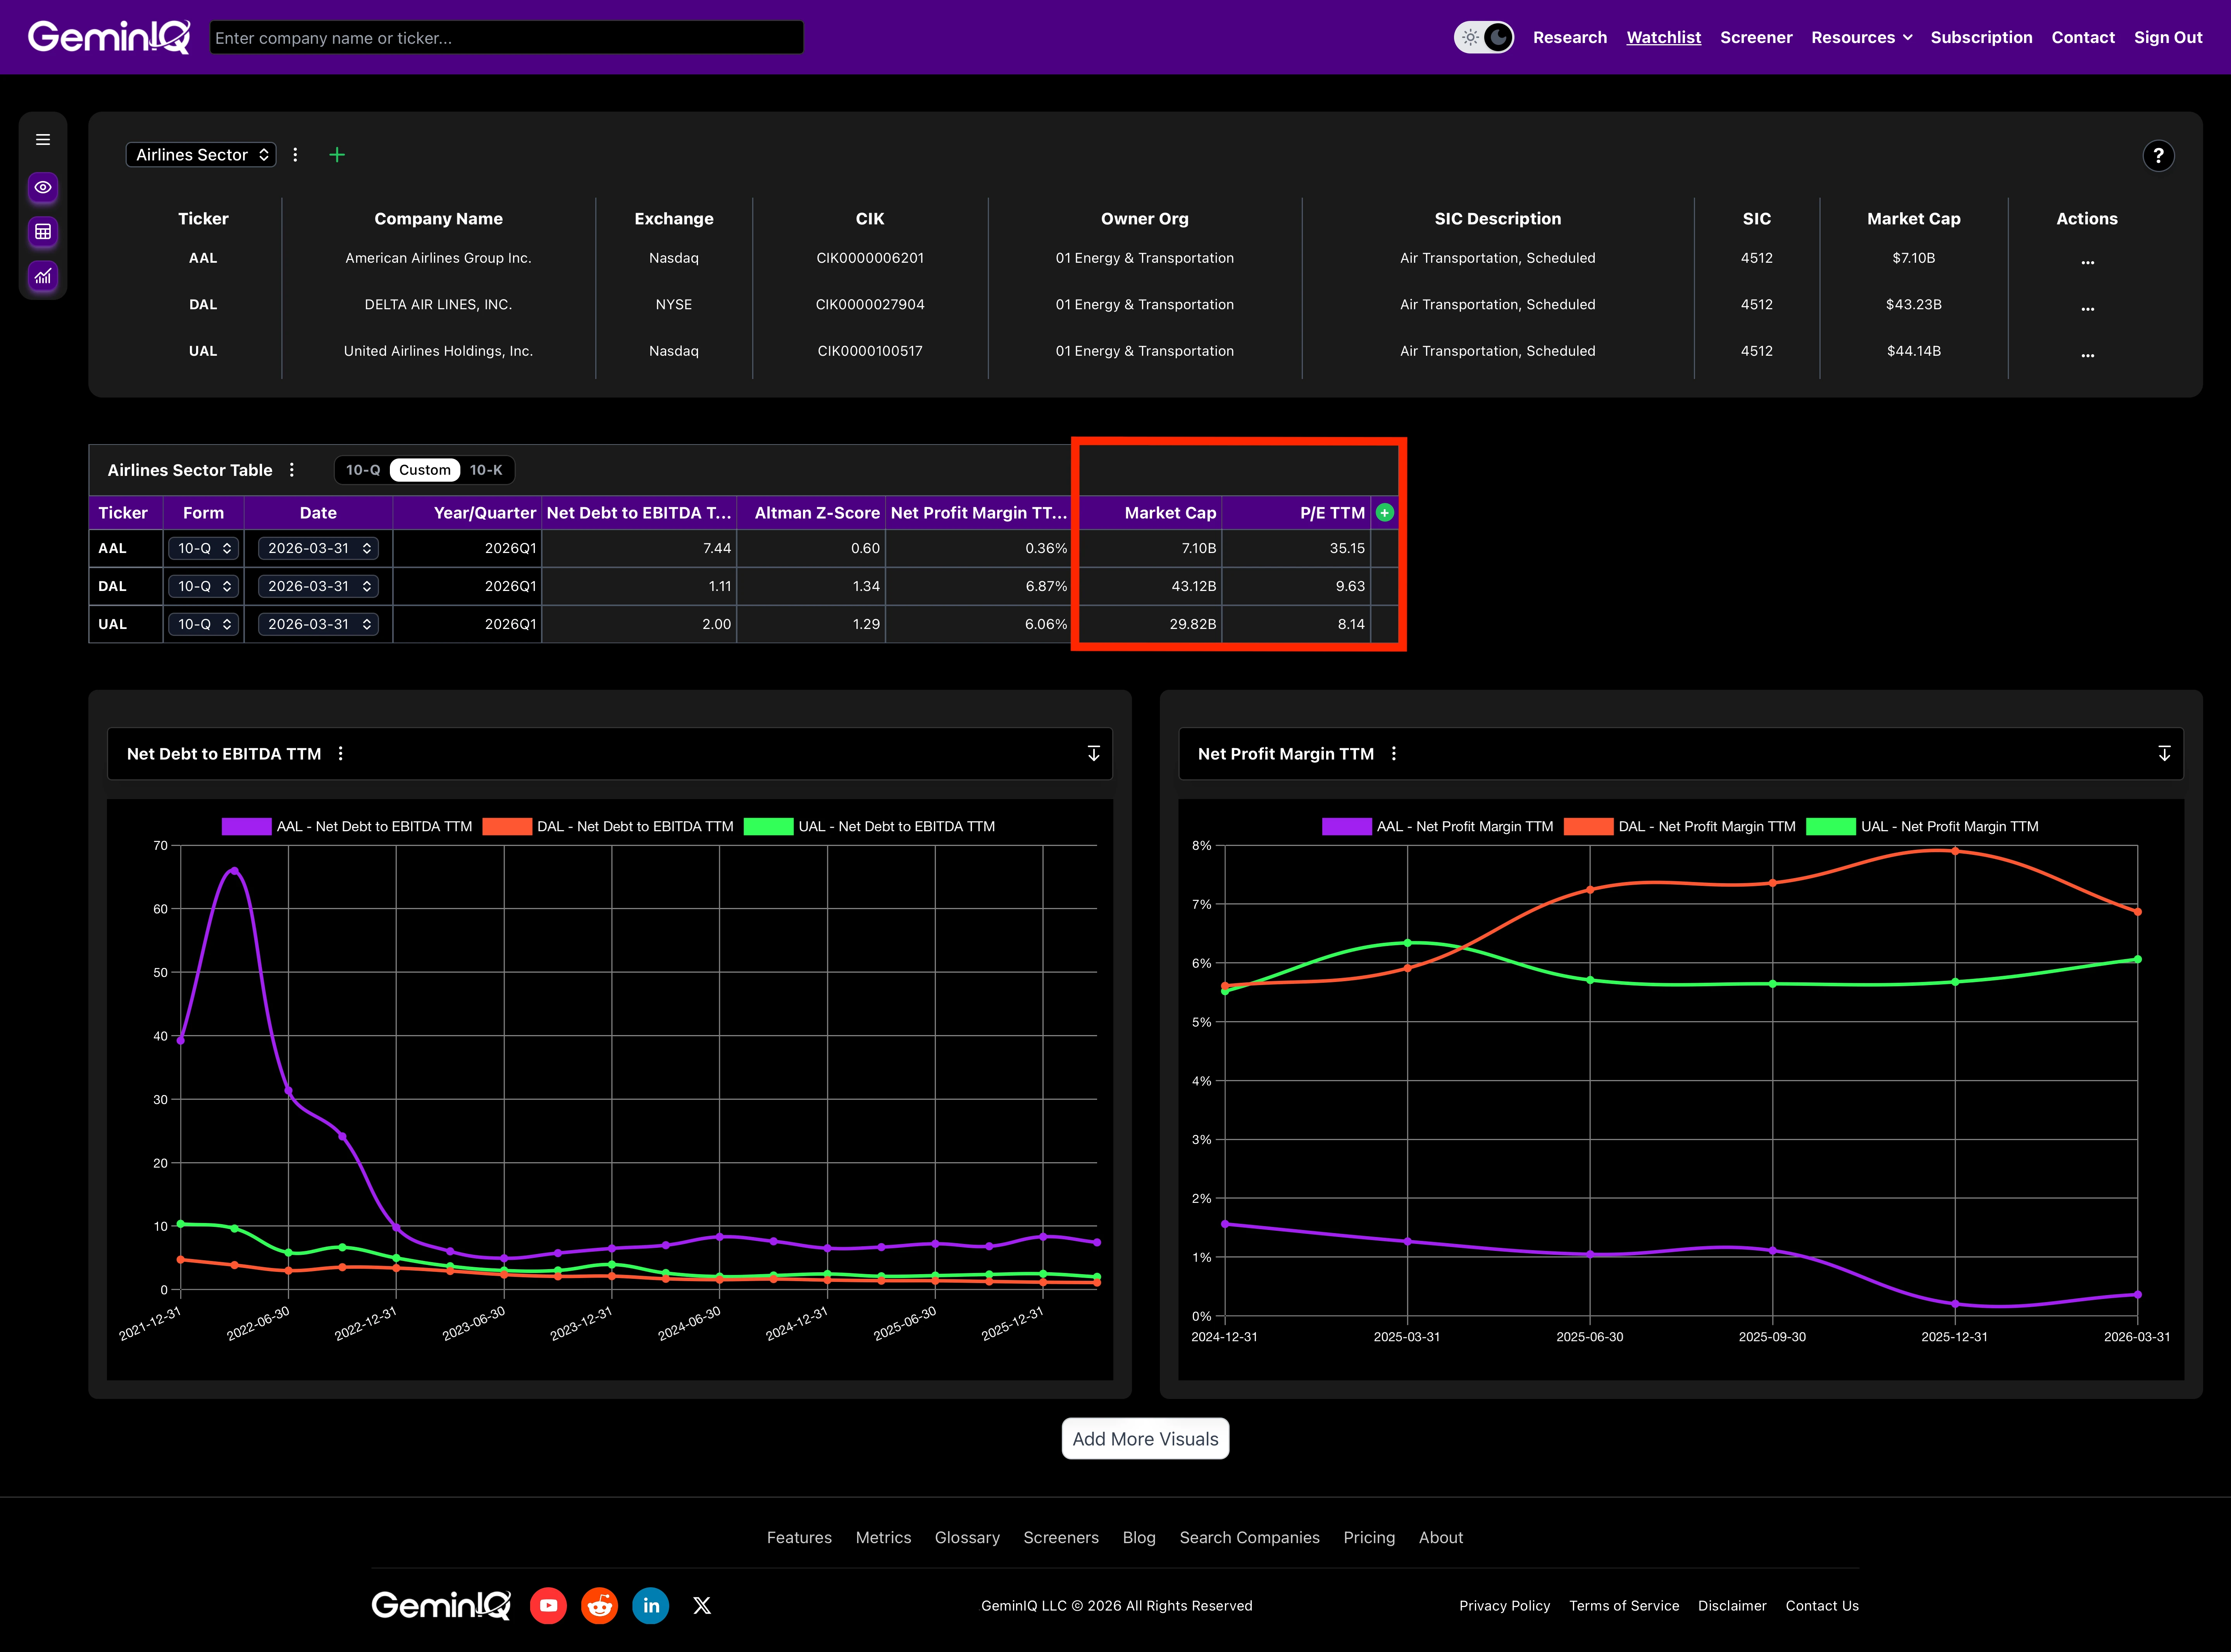 GeminIQ Calculated Metrics comparison of Market Capitalization and Price-to-Earnings Ratio (TTM) for Delta ($43.12B, 9.63x), United ($29.82B, 8.14x), and American ($7.10B, 35.15x).
Phase 4: The Margin and ROIC Collapse
American's revenue kept growing through 2025 and into 2026. Its bottom line did not follow.
Trailing-twelve-month net income fell from $846 Million at the end of 2024 to $111 Million at the end of 2025 to $202 Million in the most recent quarter — a decline of more than 70% over five quarters even as the top line grew. Net Profit Margin fell in step, from 1.56% to 0.36%, and Return on Invested Capital fell from 7.07% to 3.90% over the same window.
Delta and United show no equivalent slide. Delta's Net Profit Margin sits at 6.87% and its ROIC at 15.36%, both broadly in line with where they've run since 2023. United's margin is 6.06% and its ROIC 12.25%, also stable to improving. The revenue-growth headline is common to all three carriers. The profitability trend underneath it is not.
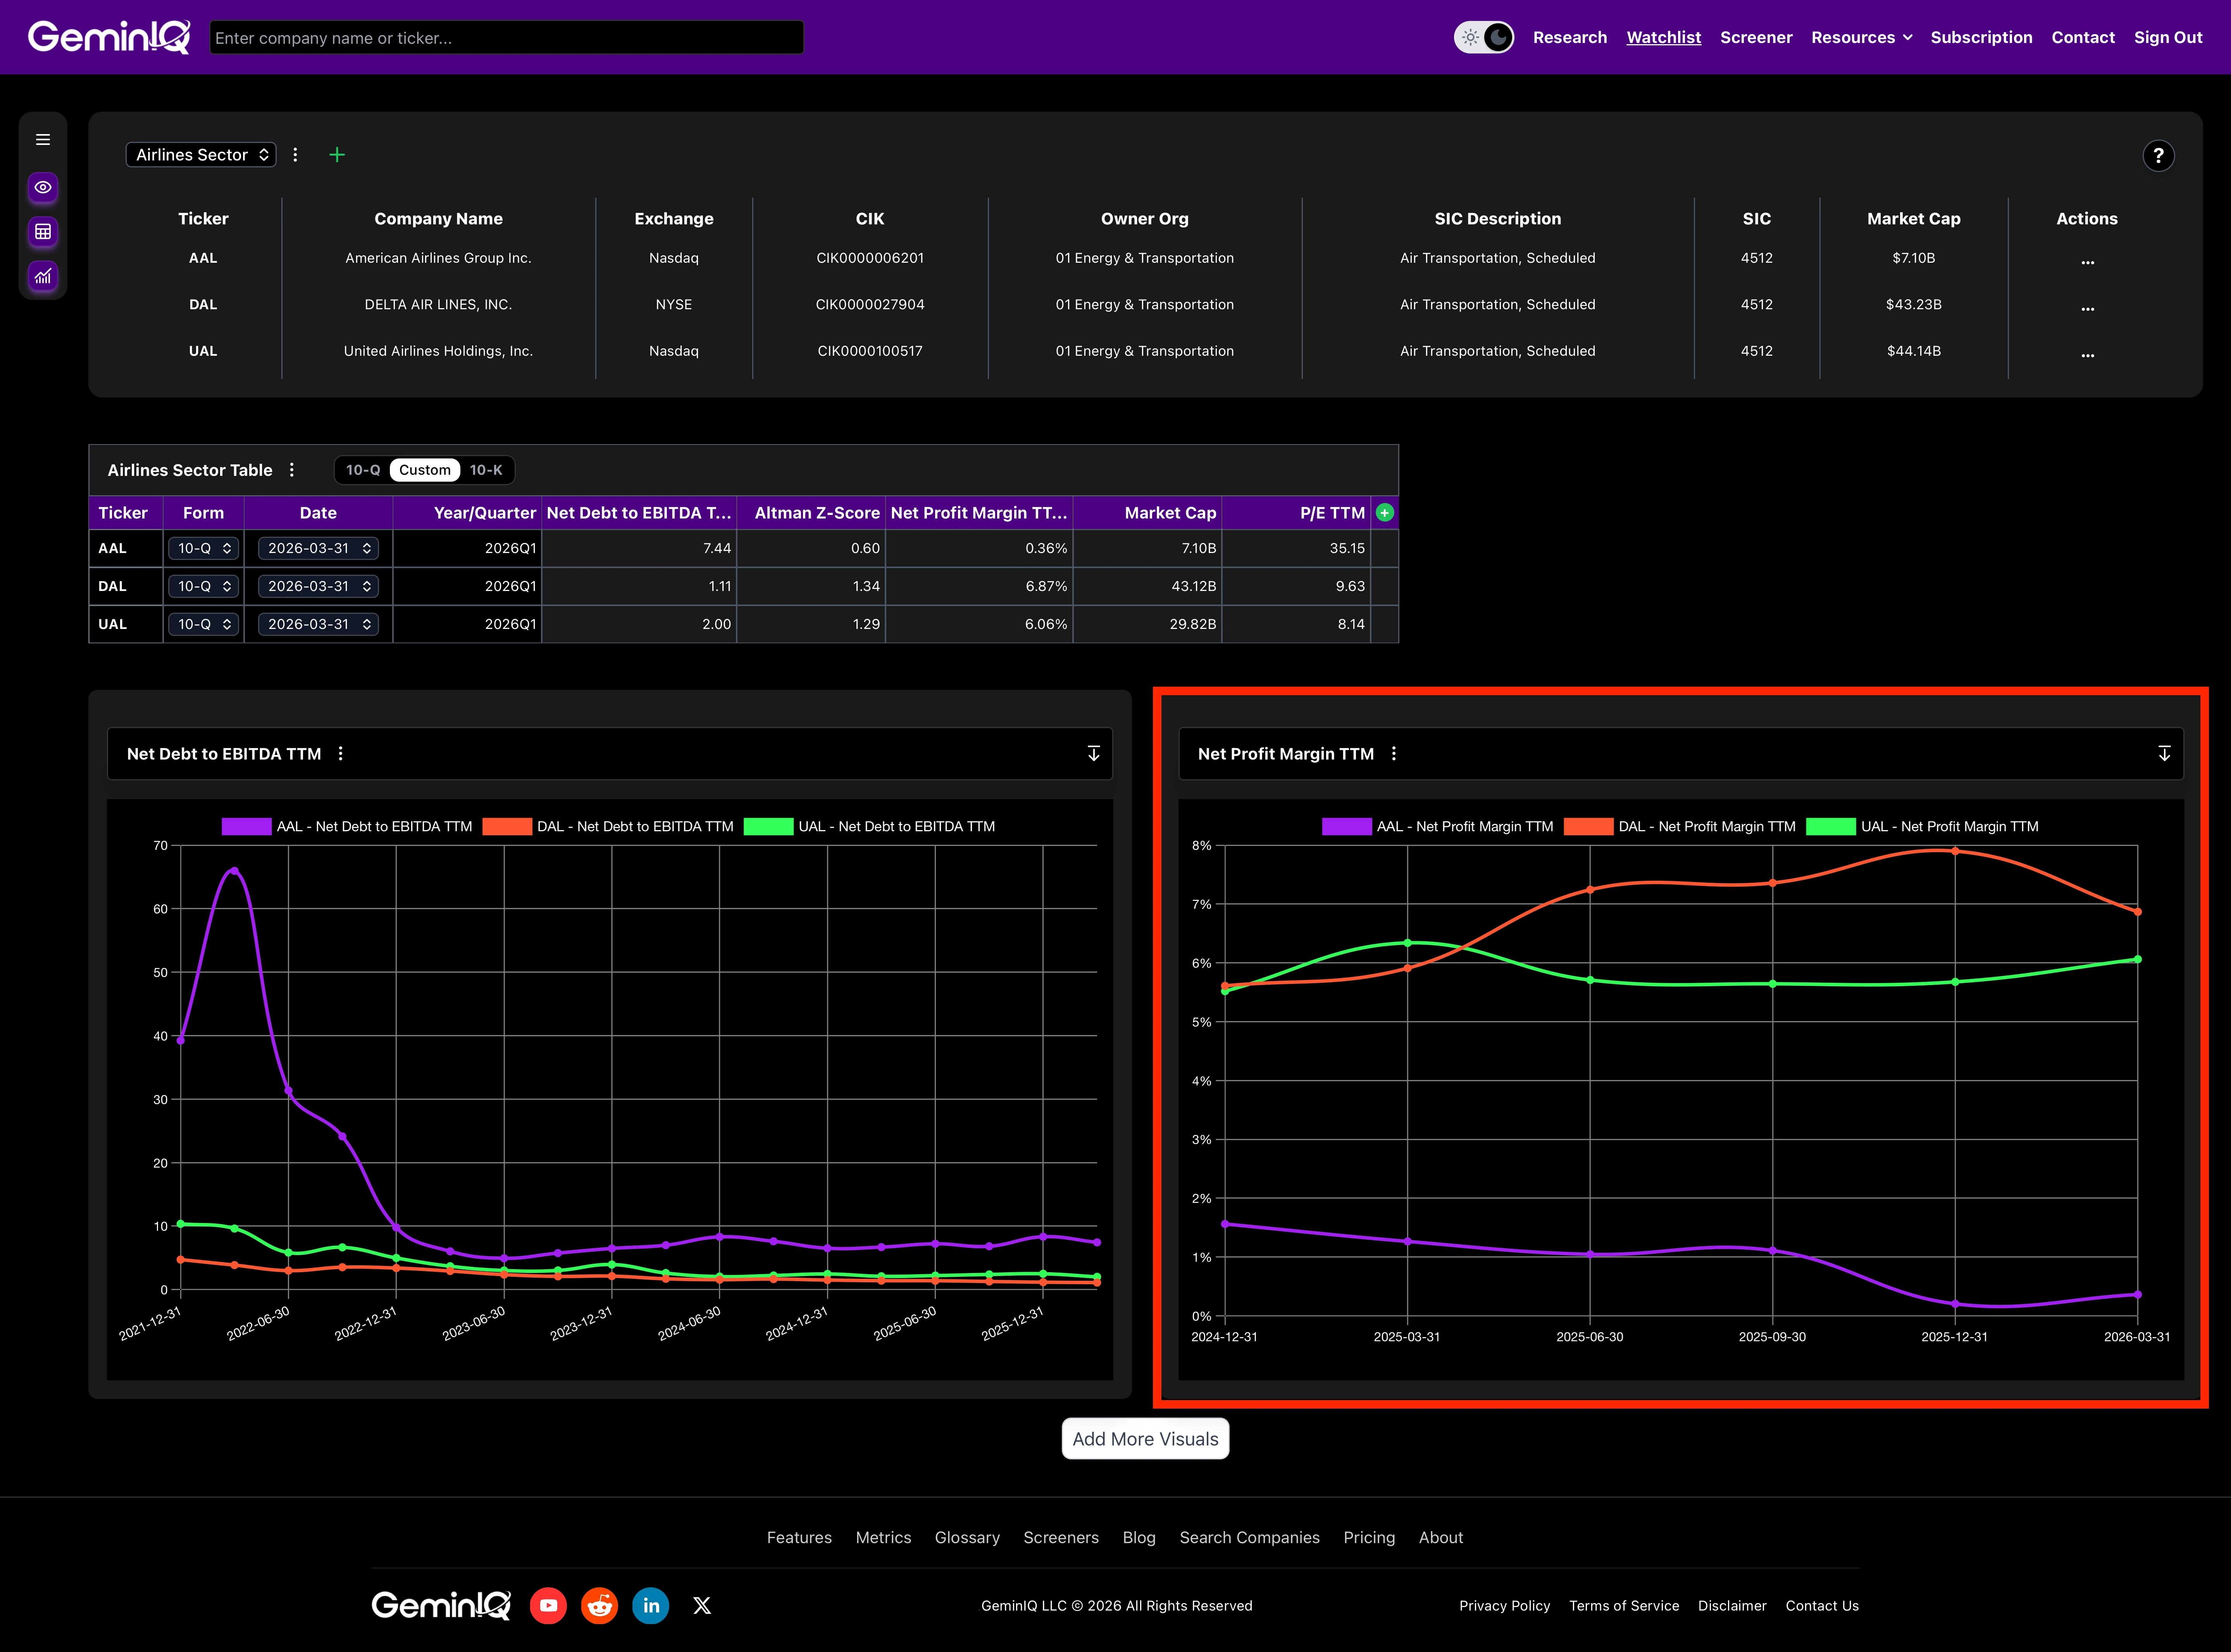 GeminIQ Calculated Metrics chart tracking quarterly Net Profit Margin (TTM) for Delta, United, and American, showing American's fall from 1.56% to 0.36% over five quarters against stable readings for its peers.
Phase 5: The Altman Z-Score, and What Smart Money Does With It
A margin gap this wide should also show up in a model built to flag financial distress — and it does. The Altman Z-Score was built to flag bankruptcy risk in manufacturers, and it's a less precise tool for asset-heavy, debt-financed service businesses like airlines — none of these three would be mistaken for a "safe zone" company under the original model. But the same trend logic from Phase 2 applies here too, and it separates the three cleanly.
Delta's score climbed from 0.62 in 2021 to 1.44 by the end of 2025, before easing slightly to 1.34 in the latest quarter — still more than double where it started. United followed a similar arc, climbing from 0.85 to a plateau in the high-1.2s to high-1.3s for the last three years, now sitting at 1.29. American is the exception: its score rose from 0.28 to a peak of 0.75 in 2024, then fell for two consecutive readings, down to 0.60 now — essentially flat versus where it stood in 2022 despite two more years of runway to improve.
That divergence shows up in who owns the stock. GeminIQ's Institutional Ownership data shows institutions hold 85.37% of Delta and 84.80% of United, but only 64.72% of American — a gap of just over 20 percentage points that has held steady across recent quarters. What are the people actually running American doing with their own money? The GeminIQ Insider Transactions feed shows nothing but Sale filings across all three carriers over the past year, which is a routine post-vesting pattern at this size of company, not a distinguishing signal on its own. The institutional ownership gap is the more telling data point, because it reflects capital that chose where to sit after reading the same filings.
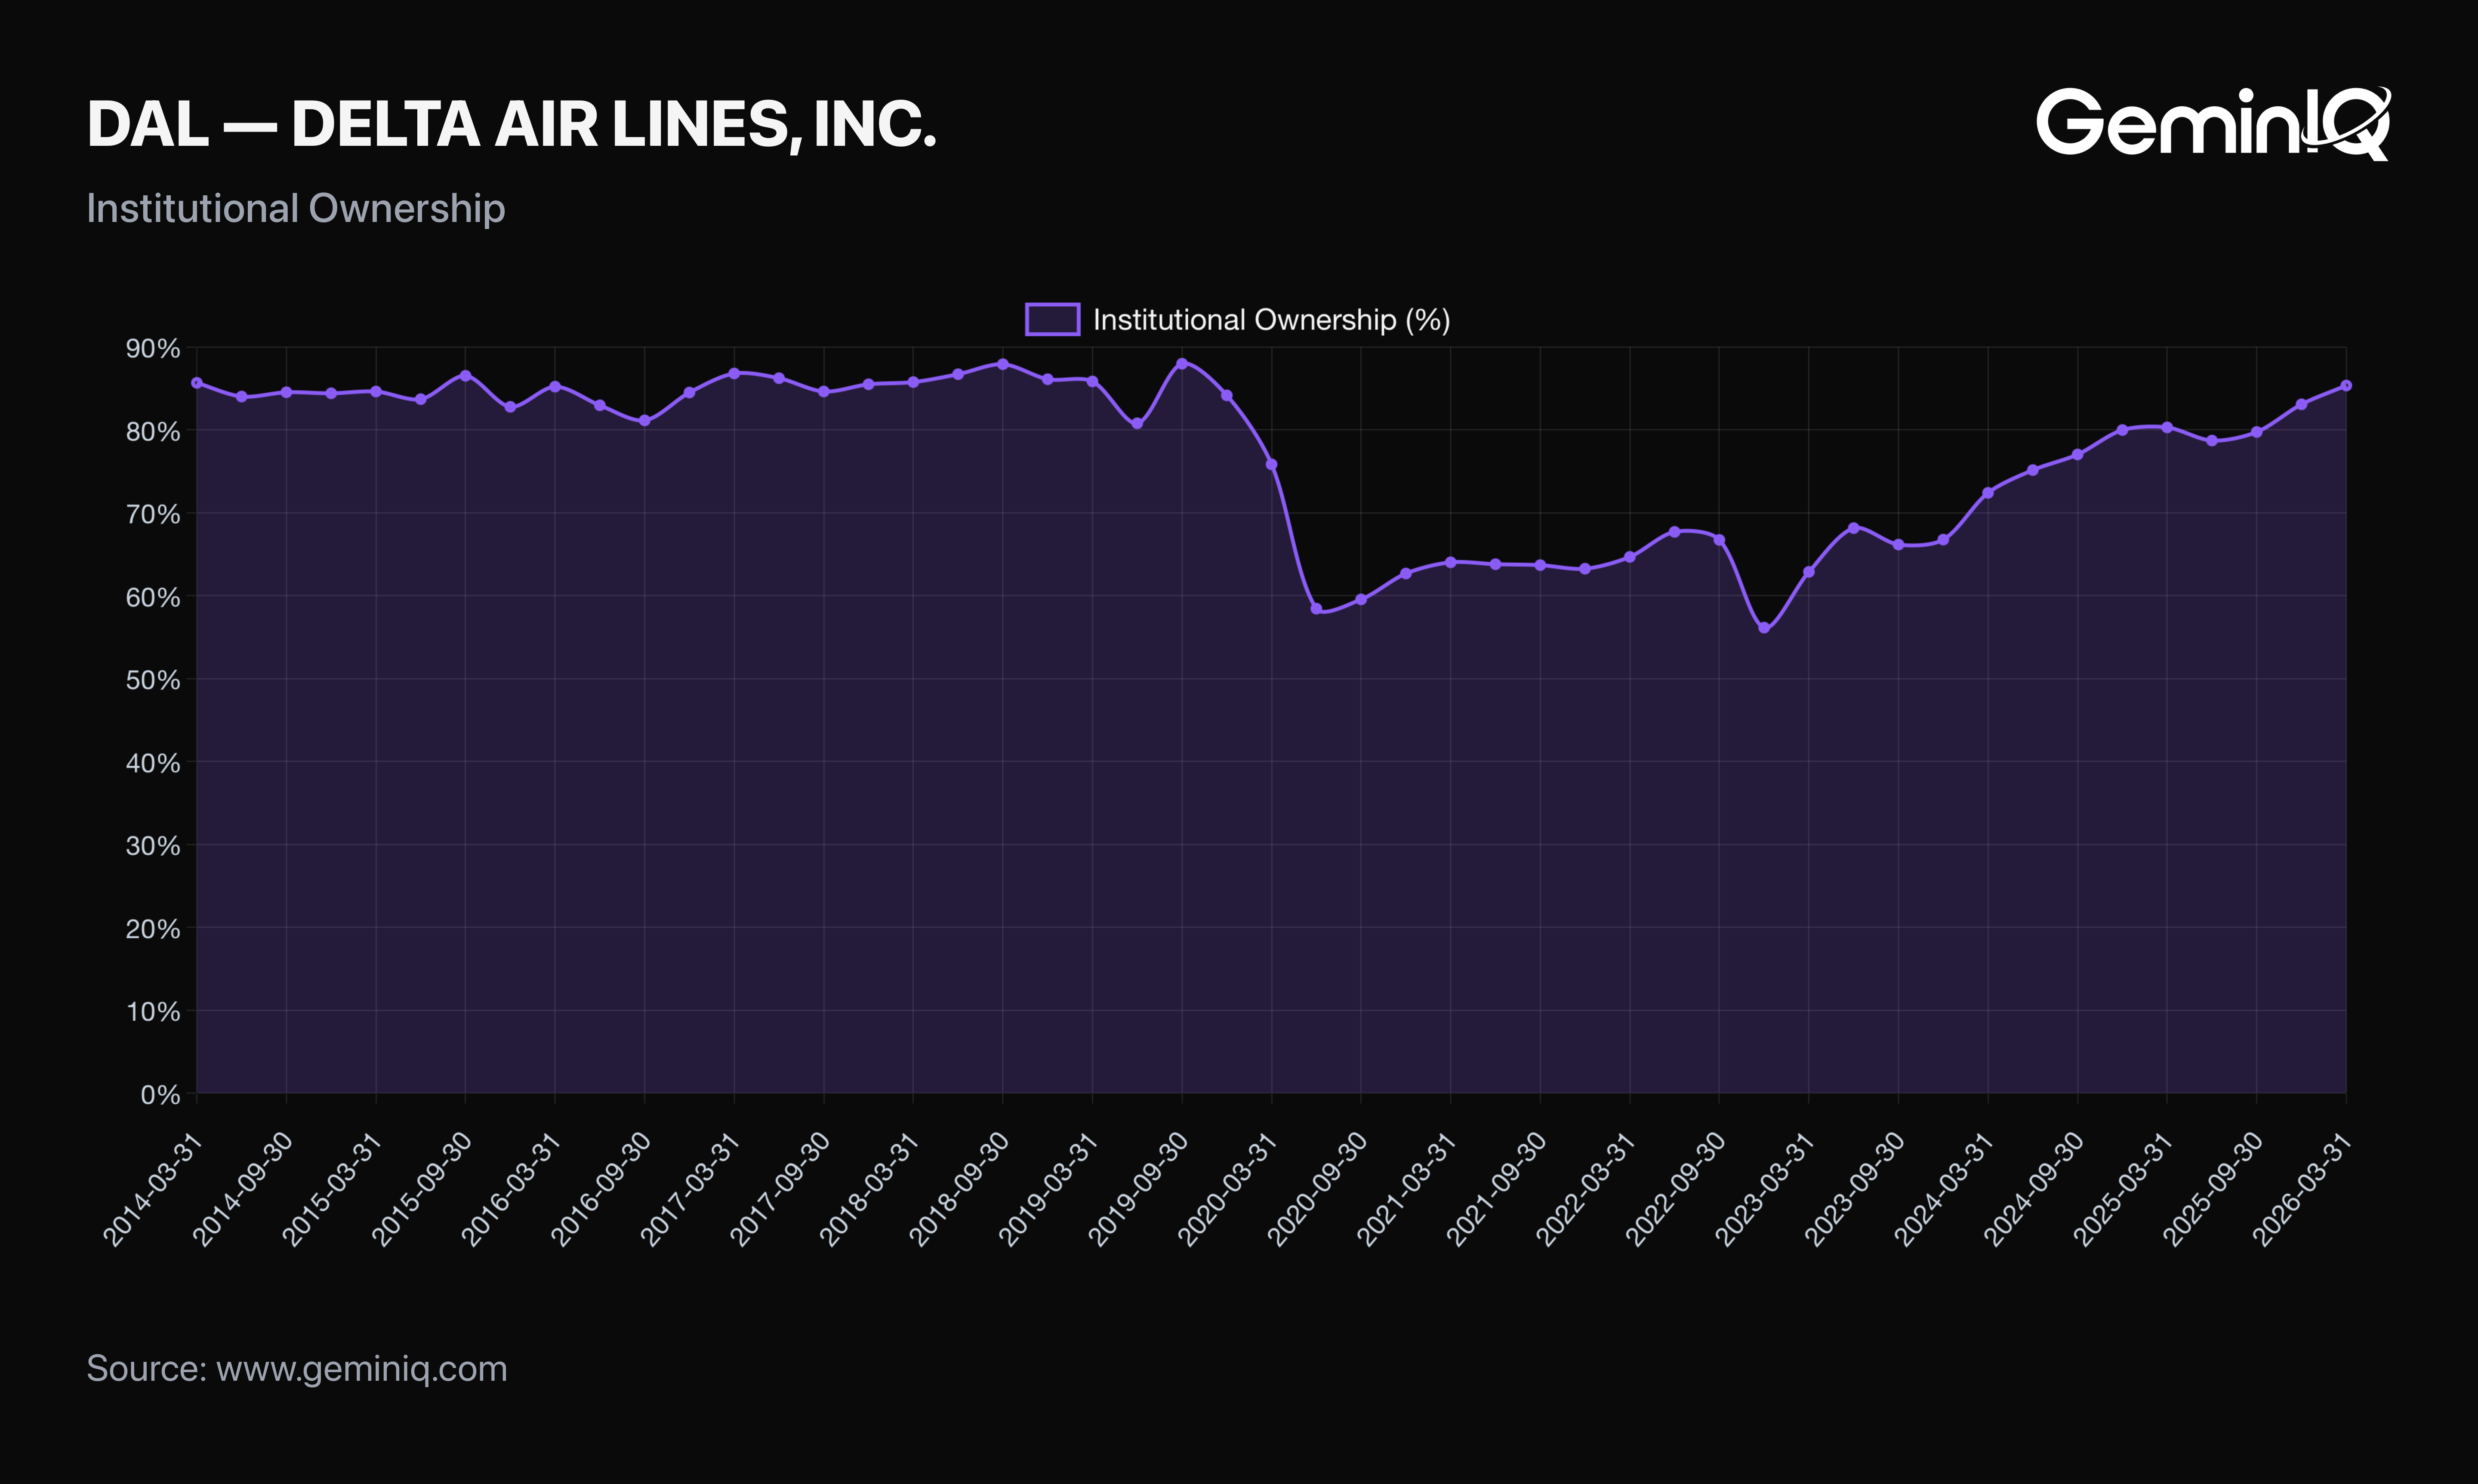 GeminIQ Institutional Ownership module for Delta Air Lines, showing 85.37% total institutional ownership as of the most recent 13F-reported quarter.
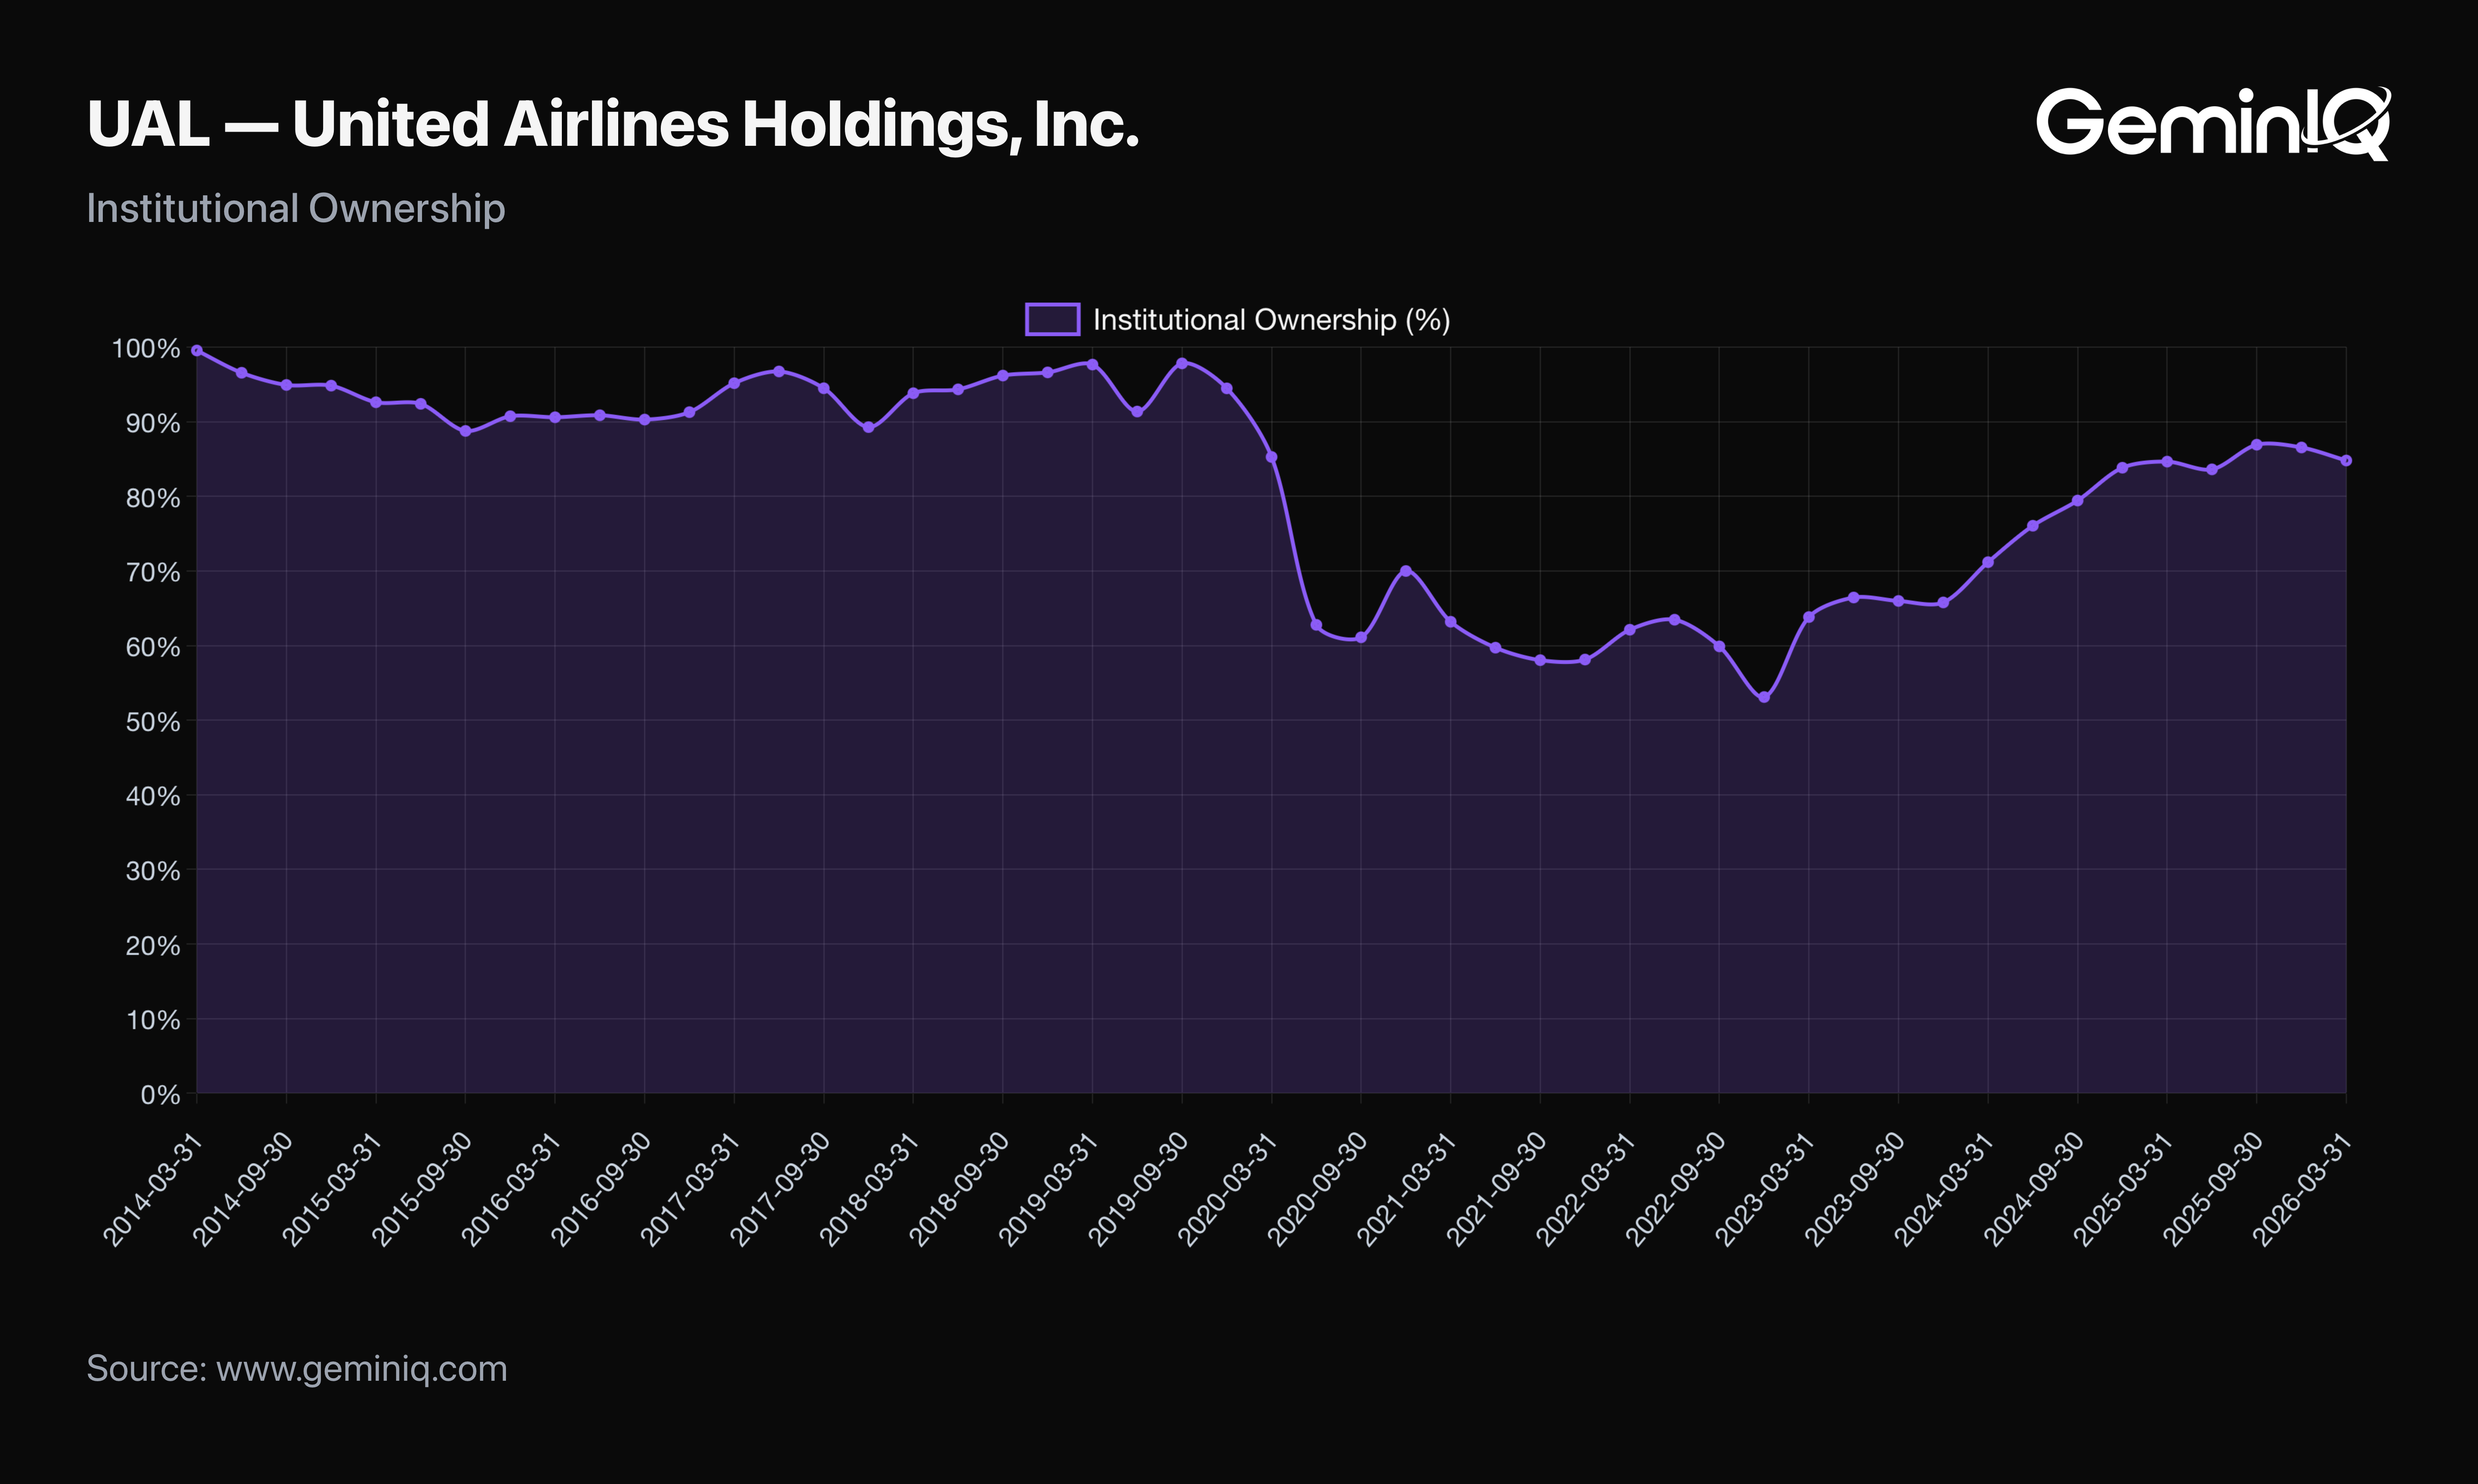 GeminIQ Institutional Ownership module for United Airlines, showing 84.80% total institutional ownership as of the most recent 13F-reported quarter.
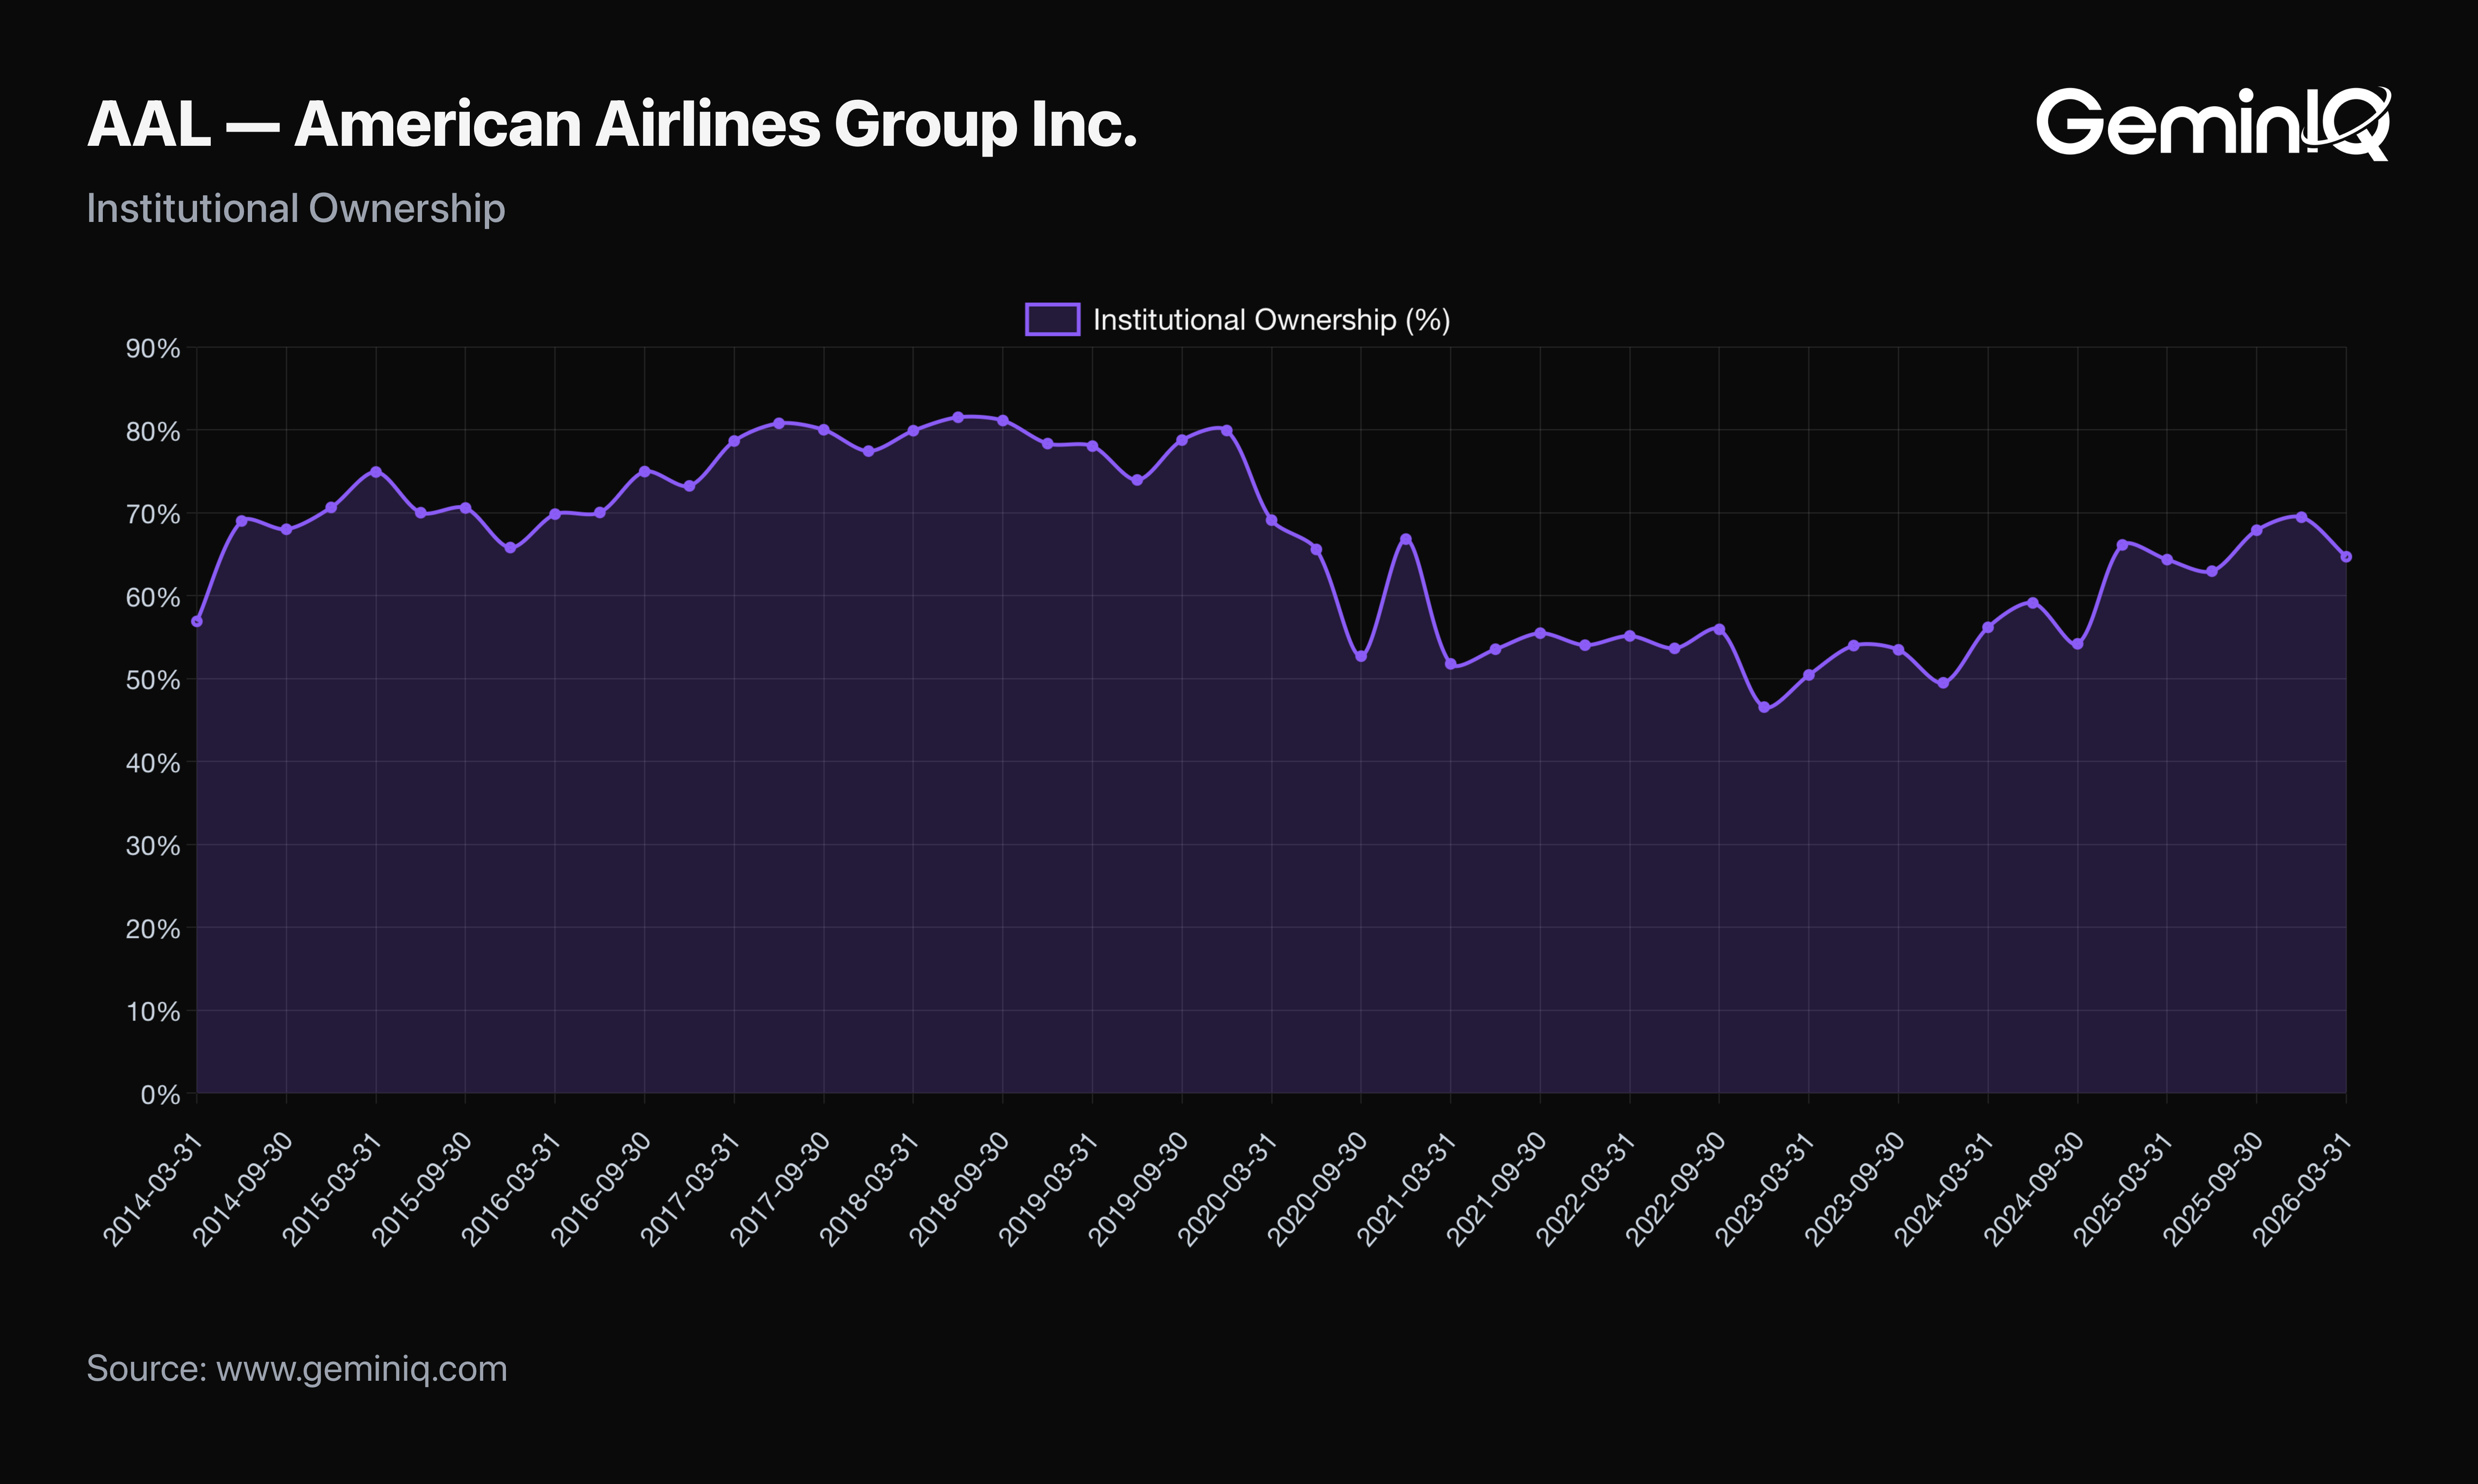 GeminIQ Institutional Ownership module for American Airlines, showing 64.72% total institutional ownership as of the most recent 13F-reported quarter.
The Analyst's Verdict
The "airlines recovered" narrative is accurate for two of the three companies in this comparison. Delta's and United's Net Debt-to-EBITDA and Altman Z-Score have both improved in nearly every year since 2021, and their margins and ROIC have held up alongside that deleveraging. American's revenue grew too, but its EBITDA base shrank enough that its own leverage ratio and Altman Z-Score are now moving backward, not forward, and its trailing net income has fallen by more than 70% in five quarters. A discounted market cap and a familiar route network don't offset a trend line that's heading the wrong way — and a trend line is exactly what a single-quarter comps table will never show you.
Frequently Asked Questions
How does American Airlines' Net Debt-to-EBITDA compare to Delta and United?
As of the quarter ended March 31, 2026, American Airlines carries a Net Debt-to-EBITDA ratio of 7.44x, versus 1.11x for Delta and 2.00x for United — 6.70x Delta's leverage relative to EBITDA.
Has American Airlines' Altman Z-Score improved or worsened since 2021?
It improved from 0.28 in 2021 to a peak of 0.75 in 2024, then declined to 0.60 as of the latest quarter — a level essentially flat with where it stood at the end of 2022.
Which airline carries the lowest leverage risk by Net Debt-to-EBITDA?
Delta Air Lines carries the lowest Net Debt-to-EBITDA ratio of the three at 1.11x, the result of an uninterrupted year-over-year decline since 2021.
When did Delta, United, and American Airlines last file their 10-Q?
Delta filed its Q1 FY2026 10-Q on April 8, 2026; United filed on April 22, 2026; American filed on April 23, 2026 — all for the quarter ended March 31, 2026.
Wall Street's data. Main Street's price.
Institutional terminals charge thousands a year for as-filed accuracy. GeminIQ gives you the same thing for a fraction of the cost: financials built directly from raw SEC EDGAR filings, not third-party APIs, with full XBRL traceability back to the original 10-K or 10-Q. No normalized guesswork, just calculated metrics, charts, screeners, and watchlists built on numbers exactly as the company reported them. Start researching now at GeminIQ.com.
All financial figures cited in this article reference Delta Air Lines, Inc.'s Q1 FY2026 10-Q (filed April 8, 2026, period ending March 31, 2026). All SEC filings are publicly available at SEC EDGAR.
All financial figures cited in this article reference United Airlines Holdings, Inc.'s Q1 FY2026 10-Q (filed April 22, 2026, period ending March 31, 2026). All SEC filings are publicly available at SEC EDGAR.
All financial figures cited in this article reference American Airlines Group Inc.'s Q1 FY2026 10-Q (filed April 23, 2026, period ending March 31, 2026). All SEC filings are publicly available at SEC EDGAR.
Disclaimer: The content in this blog is for educational and entertainment purposes only and does not constitute financial, legal, or tax advice. Investing involves risk, including the loss of principal. The views expressed are my own and not intended as financial advice or a guarantee of future performance.