
Discounted Cash Flow (DCF) Model: Step-by-Step Walkthrough

By Chad Hartman
Published · Last updated
Most "how to build a DCF model" guides online skip the part that actually determines whether the output means anything: where the numbers come from. They hand you a formula, plug in a free cash flow figure that appears from nowhere, and arrive at a tidy intrinsic value. But standard financial media doesn't read the footnotes — and neither, it turns out, do most DCF tutorials. This guide builds a complete discounted cash flow model from scratch, using NVIDIA's Q1 FY2027 10-Q (filed May 20, 2026, period ending April 30, 2026) as a live, traceable example, with every input sourced directly from the as-filed cash flow statement rather than a pre-packaged number you have to take on faith.
Table of Contents
- What Is a Discounted Cash Flow (DCF) Model?
- The DCF Formula: Free Cash Flow, Discount Rate, and Terminal Value
- Step 1: Pulling the Free Cash Flow Inputs From the Filing
- Step 2: Projecting Future Free Cash Flow
- Step 3: Choosing a Discount Rate
- Step 4: Terminal Value and Discounting to Present Value
- The Full Walkthrough: NVIDIA's Implied Value
- Why Most DCF Models Are Wrong Before the Math Even Starts
- Building Your Own DCF With GeminIQ's Raw Filing Data
What Is a Discounted Cash Flow (DCF) Model?
A discounted cash flow model values a business as the sum of all the cash it is expected to generate in the future, converted into today's dollars. The logic is simple even when the spreadsheet isn't: a dollar of free cash flow five years from now is worth less than a dollar today, because of inflation, opportunity cost, and risk. A DCF model projects a company's future free cash flow, discounts each year back to present value using a required rate of return, and adds a terminal value to capture everything beyond the explicit forecast window. The result is an estimate of intrinsic value — the present value of all future cash a business can distribute to its owners, independent of whatever the market happens to be paying for it on a given day. For a fuller treatment of how intrinsic value relates to book value and other valuation anchors, see our Value Investing Glossary.
The model has exactly three moving parts: free cash flow, a discount rate, and a terminal value. Get any one of them wrong — or worse, source it from a number you can't trace back to the filing — and the entire output is fiction dressed up as precision.
The DCF Formula: Free Cash Flow, Discount Rate, and Terminal Value
In its full form, the DCF formula sums the present value of each projected year of free cash flow, then adds the present value of the terminal value:
Intrinsic Value = Σ [FCF₍ₜ₎ / (1 + r)ᵗ] + [Terminal Value / (1 + r)ⁿ]
Where FCF₍ₜ₎ is the projected free cash flow in year t, r is the discount rate, and n is the final year of the explicit forecast. Each component requires a separate decision, and each decision is a place where a model can quietly go wrong. Free cash flow needs a clean, traceable starting point. The discount rate needs to reflect the actual risk of the business. And the terminal value — which in most DCF models accounts for more than half of the total output — needs an assumption about long-run growth that won't fall apart under scrutiny.
What Is the Discount Rate in a DCF Model?
The discount rate represents the minimum annual return an investor requires to compensate for the risk of owning the business, and it is usually estimated using the weighted average cost of capital (WACC) — a blend of the cost of equity and the after-tax cost of debt, weighted by how much of each the company uses to finance itself. WACC is not a figure GeminIQ calculates or displays as a platform metric; it is an external assumption every analyst has to bring to the model independently, typically built from the company's Debt-to-Equity Ratio, interest expense, and an estimate of the equity risk premium. What GeminIQ does provide is every one of the raw balance sheet and cash flow inputs needed to build that estimate yourself, sourced directly from the filing rather than smoothed by a third party.
Step 1: Pulling the Free Cash Flow Inputs From the Filing
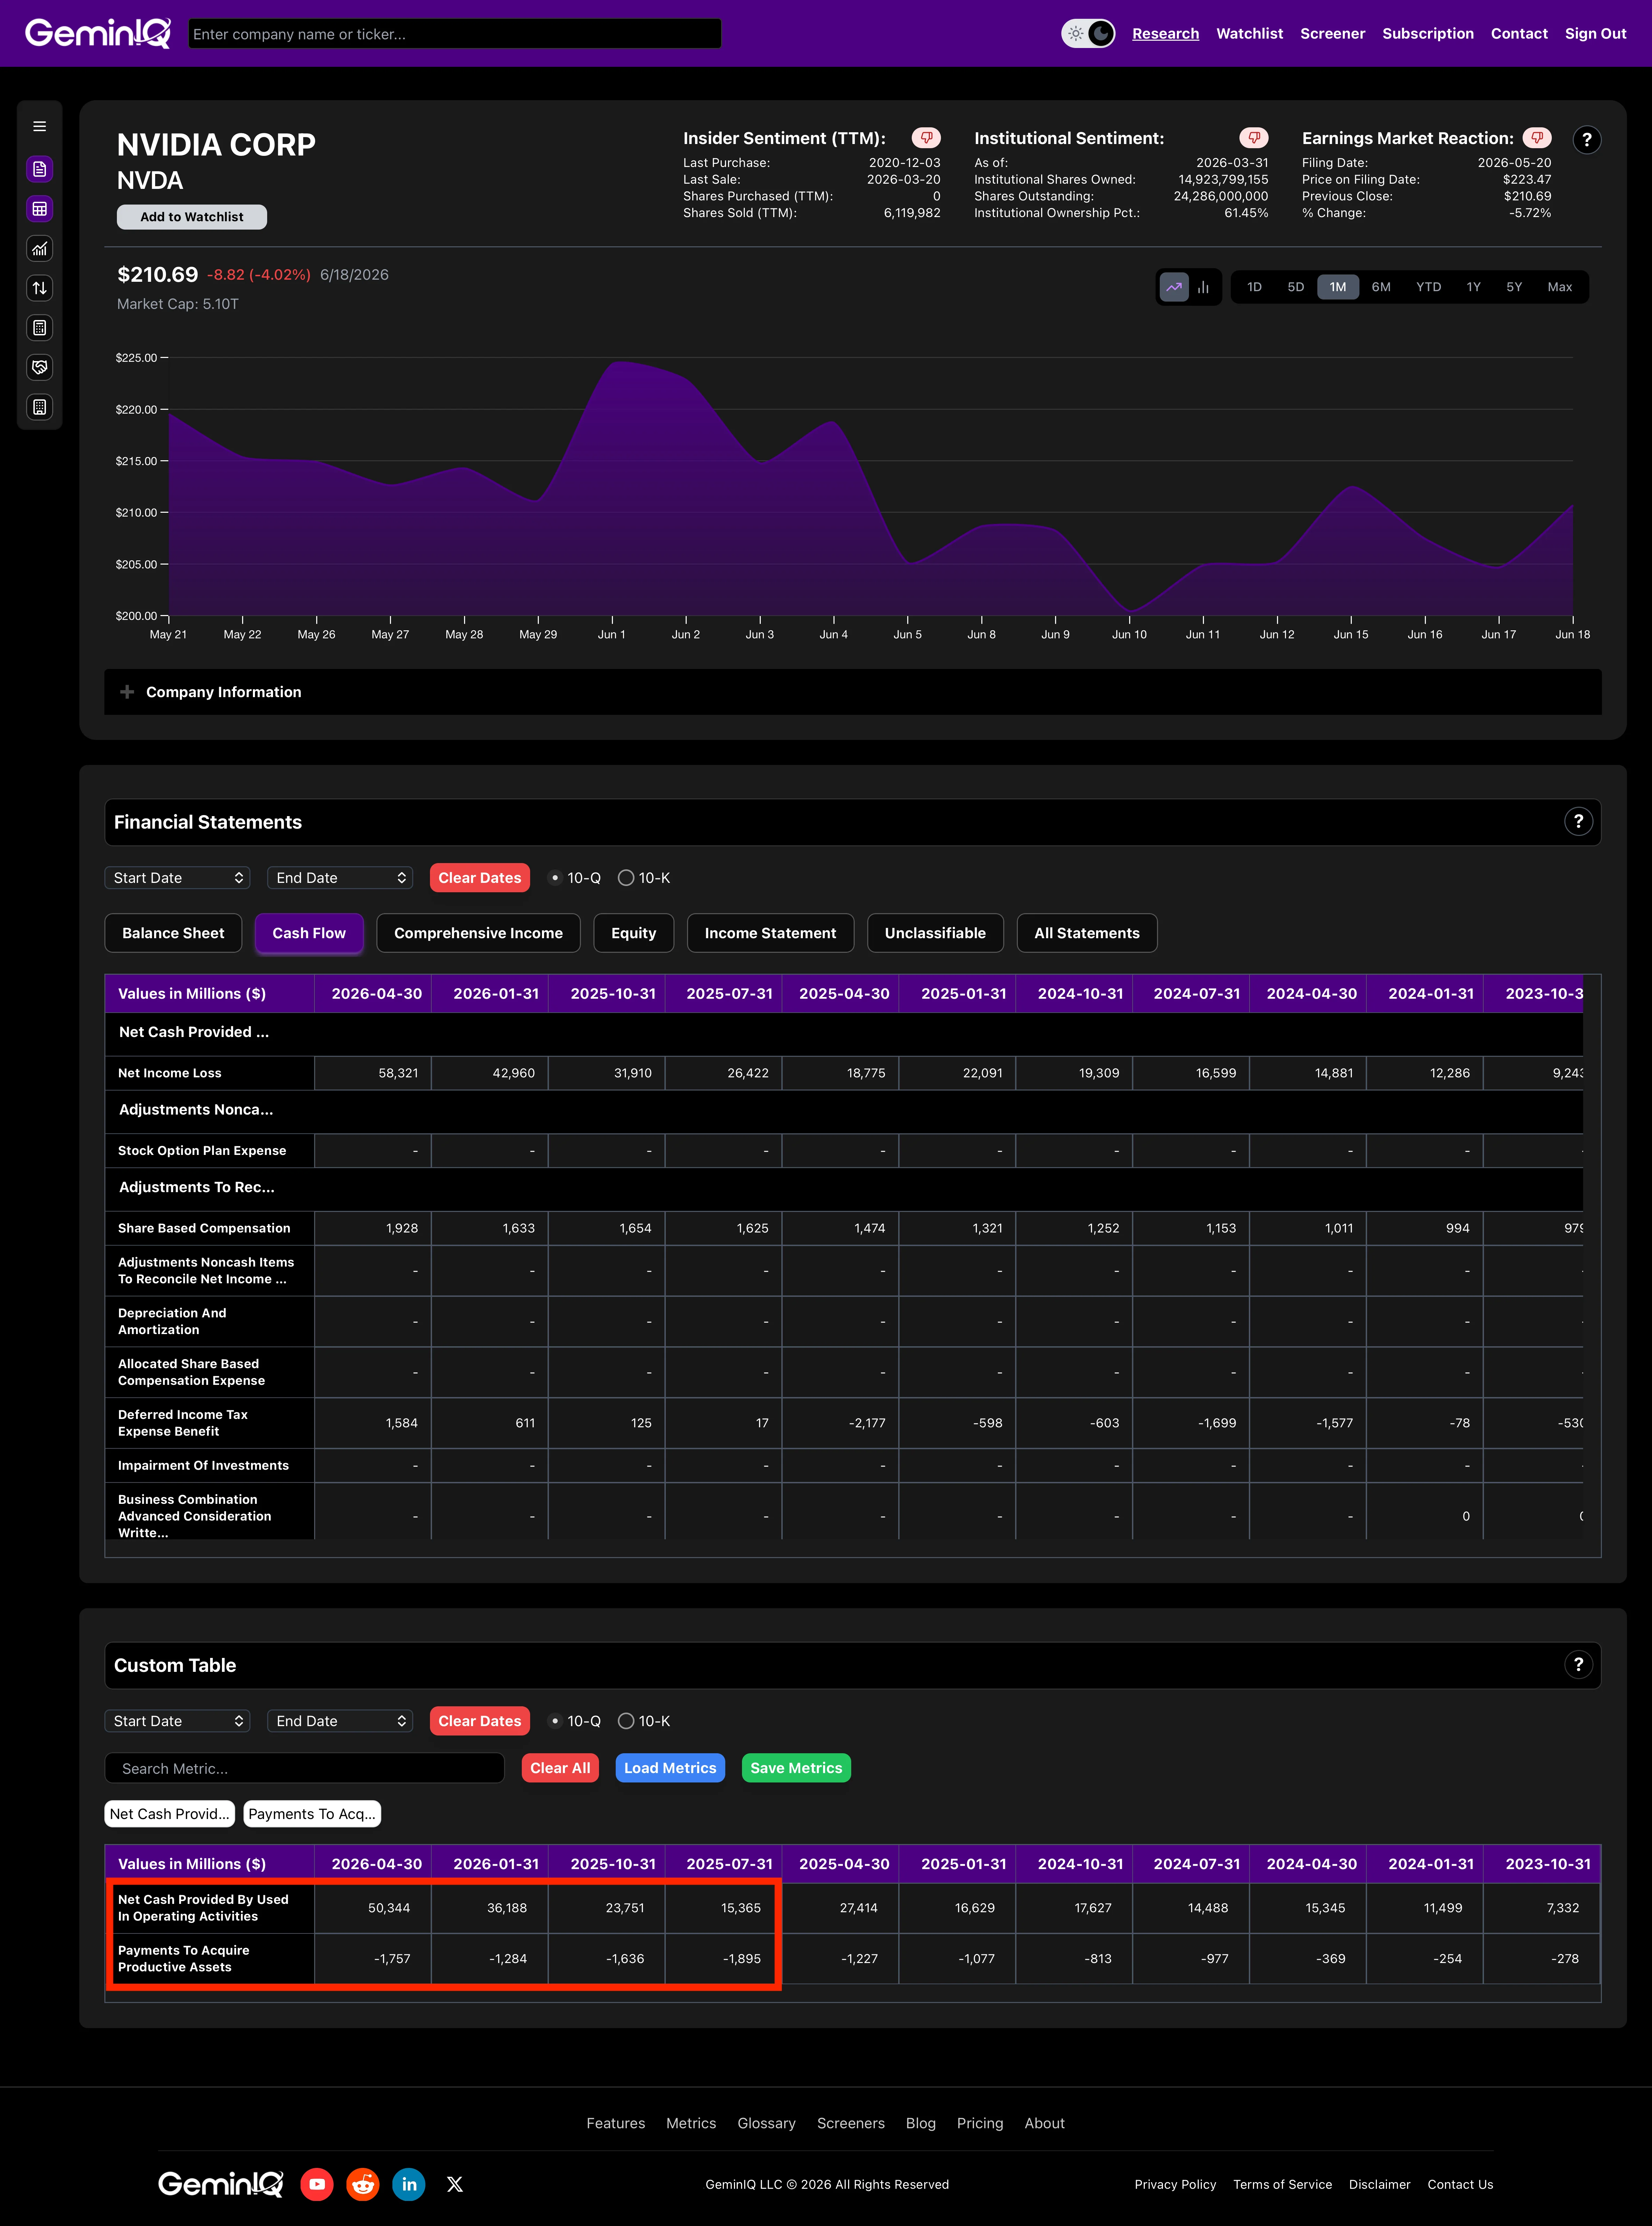
Every DCF model starts with a base year of free cash flow, and that number is only as good as its source. For the quarter, NVIDIA's Q1 FY2027 10-Q reports Net Cash Provided by Operating Activities of $50.34 Billion, tagged under the XBRL identifier NetCashProvidedByUsedInOperatingActivities. Capital expenditures ran $1.76 Billion against that, filed under the line item "Purchases Related to Property and Equipment and Intangible Assets" with the XBRL tag PaymentsToAcquireProductiveAssets. Stretch both figures to a trailing-twelve-month basis instead of a single quarter, and the gap widens: $125.65 Billion in TTM operating cash flow against just $6.57 Billion in TTM capital expenditures — the difference between those two numbers is the model's entire starting point.
GeminIQ's Free Cash Flow metric calculates that subtraction automatically — TTM operating cash flow minus TTM capex — producing $119.08 Billion in trailing twelve-month free cash flow for the period ending April 30, 2026. Divide that by NVIDIA's basic shares outstanding and GeminIQ's Free Cash Flow Per Share metric returns $4.90 — the actual per-share cash base every projection in this walkthrough builds from. This is also the number most likely to be quietly altered by a third-party aggregator before you ever see it: some platforms sweep acquisition spending or capitalized software costs into the capex line, shrinking reported free cash flow without disclosing the change. GeminIQ takes capital expenditures exactly as filed, nothing added, nothing smoothed.
Step 2: Projecting Future Free Cash Flow
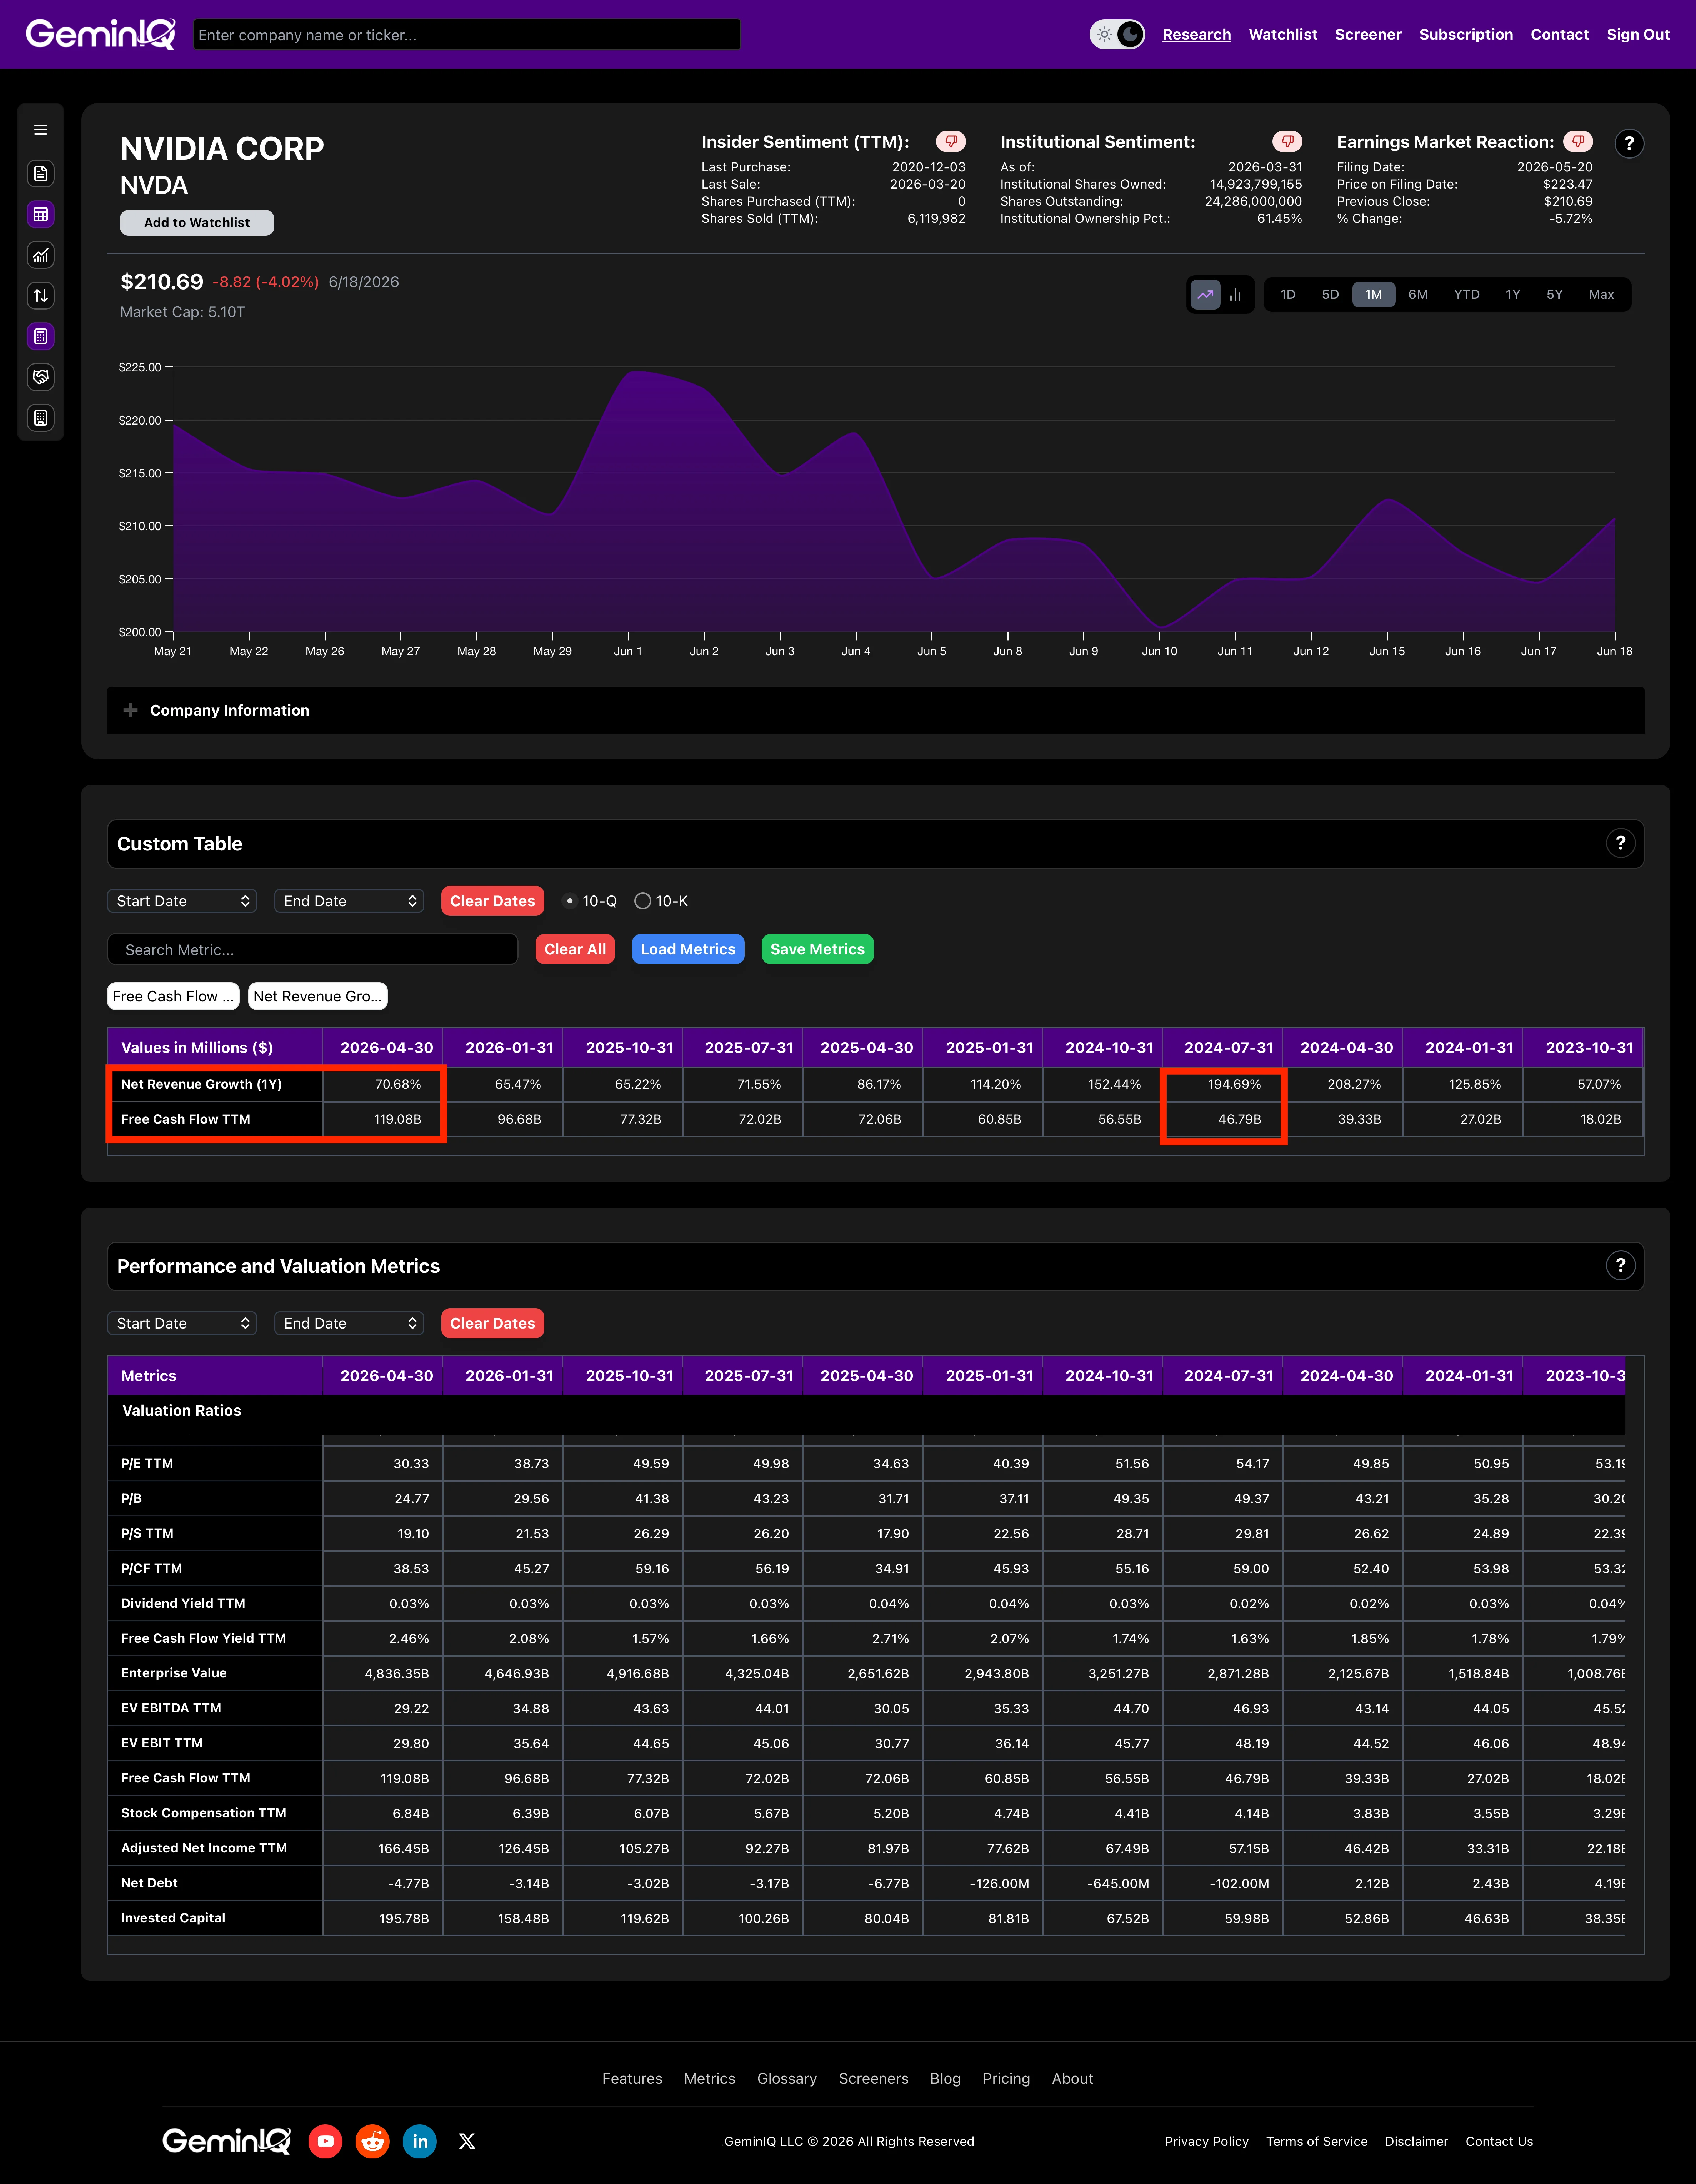
A base year of free cash flow is only useful once it's extended forward, and that projection should be grounded in the company's actual growth trajectory rather than a number pulled from thin air. GeminIQ's Revenue Growth metric shows NVIDIA's trailing-twelve-month revenue growth decelerating sharply over the past two years — from as high as 194.69% in mid-2024 down to 70.68% in the most recent quarter, with a slight reacceleration from 65.47% the quarter prior. That deceleration curve is the entire justification for tapering a growth assumption forward rather than projecting a flat rate to infinity, which is the single most common error in amateur DCF models.
For this walkthrough, the explicit forecast applies a fading growth rate to the $119.08 Billion base: 40% in Year 1, tapering to 30%, 22%, 16%, and 12% by Year 5. This taper is the analyst's own assumption, built to reflect a hyper-growth business normalizing toward a sustainable pace — it is not a GeminIQ-calculated output, and a different analyst could reasonably choose a different curve. Applied to the base, the projection very nearly triples free cash flow over five years: $166.71 Billion in Year 1, climbing to $216.72 Billion, $264.40 Billion, and $306.70 Billion through Years 2 to 4, before reaching $343.50 Billion in Year 5. That trajectory, not the discount rate, is where most of a DCF model's optimism actually lives.
Step 3: Choosing a Discount Rate
With five years of projected free cash flow in hand, the next decision is the one most tutorials gloss over — and the one with the largest swing on the final output: the discount rate. For this walkthrough, the rate is set at 10%, a reasonable starting estimate for a highly profitable, low-leverage company, but explicitly an assumption rather than a platform-calculated figure. NVIDIA's balance sheet supports a relatively low cost of capital: total debt of $8.47 Billion against total equity of $195.47 Billion, and a net cash position of $4.77 Billion once that debt is offset against cash on hand. A heavily leveraged company would warrant a higher discount rate to compensate for added financial risk; a balance sheet this clean argues for something closer to the equity risk premium alone.
A terminal growth rate of 3.5% is applied beyond Year 5 — roughly in line with long-run nominal GDP growth, the standard ceiling for a perpetuity assumption, since no company can structurally outgrow the economy forever without eventually becoming the entire economy.
Step 4: Terminal Value and Discounting to Present Value
The terminal value captures every dollar of free cash flow beyond the explicit five-year window, calculated using the Gordon Growth formula:
Terminal Value = FCF₅ × (1 + g) / (r − g)
Applying the 3.5% terminal growth rate and 10% discount rate to Year 5's $343.50 Billion in projected free cash flow produces an undiscounted terminal value of $5.47 Trillion — discounted back five years at 10%, that shrinks to $3.40 Trillion in present-value terms. The same discounting applies to each of the five explicit years individually, dividing each by (1.10) raised to the power of its respective year; summed together, they contribute $952.07 Billion in present value. Together, the discounted cash flows and the discounted terminal value produce an implied enterprise value of $4.35 Trillion.
From enterprise value to equity value requires one more adjustment: subtracting net debt. Because NVIDIA carries a net cash position rather than net debt — confirmed directly by GeminIQ's Net Debt metric at -$4.77 Billion — that cash is added back rather than subtracted, bringing implied equity value to $4.35 Trillion.
The Full Walkthrough: NVIDIA's Implied Value
Divide that $4.35 Trillion implied equity value by NVIDIA's 24.39 Billion diluted shares outstanding and the model produces an intrinsic value of $178.47 per share. Compare that to the $199.34 closing price embedded in this same filing snapshot, and the model implies the market is pricing in roughly 10.47% more value than this base-case assumption set supports.
That gap is not a verdict on whether the stock is cheap or expensive — a DCF model is not a buy or sell signal, and no single discount rate or growth taper deserves that much confidence. It is a transparent record of which assumptions an investor would need to hold in order to justify the price the market is already paying, built from a free cash flow base that traces directly back to the filing rather than a black box.
Why Most DCF Models Are Wrong Before the Math Even Starts
The textbook criticism of DCF models is that they are wildly sensitive to small changes in assumptions — and the math bears that out. Move the discount rate from 8% to 12% at a 2.5% terminal growth rate, and the implied per-share value falls from $220 to $123. Raise terminal growth from 2.5% to 4.5% instead, and the spread widens further: at an 8% discount rate, fair value ranges from $220 to $328; at 12%, from $123 to $148. A handful of percentage points in two assumptions can swing the output by more than 150%.
That sensitivity is real, but it obscures a more practical problem that gets far less attention: garbage in, garbage out doesn't start at the discount rate. It starts at the free cash flow base. If the operating cash flow or capital expenditure figure feeding Year 1 of the model is itself wrong — smoothed by an aggregator, miscategorized, or pulled from a stale data source — every projected year inherits that error, compounding it forward five years and then baking it permanently into the terminal value. A discount rate assumption is at least visible and adjustable; a corrupted base-year cash flow figure usually isn't, because most platforms don't show their work. For a deeper look at how aggregator normalization choices distort the inputs that feed models like this one, see Third-Party Financial Data: What Gets Lost When the Data Is Processed and What "Normalized" Financial Data Actually Means. The discount rate is the part of a DCF model you're supposed to argue about. The free cash flow base shouldn't be.
Building Your Own DCF With GeminIQ's Raw Filing Data
Replicating this walkthrough for any company starts in the same place: GeminIQ's Financial Statements view, pulled directly from the company's most recent 10-Q or 10-K, to source operating cash flow and capital expenditures exactly as filed. From there, the Calculated Metrics tab surfaces Free Cash Flow, Free Cash Flow Per Share, Revenue Growth, and Return on Invested Capital (ROIC) — NVIDIA's ROIC currently sits at 99.15% TTM, a useful sanity check on whether the growth taper assumed in Step 2 is consistent with how efficiently the company is actually deploying new capital. GeminIQ's Visualizations feature charts free cash flow and revenue growth across eight or more quarters in one view, which is the fastest way to build a defensible taper curve rather than guessing at one.
None of this replaces the judgment a DCF model requires — the discount rate, the growth taper, the terminal multiple are still yours to defend. But the free cash flow base, the capital structure, and the growth history that those judgments should be built on are not things worth guessing at. They're in the filing. The only question is whether the platform you're using shows them to you as filed, or as someone else decided to round them.
Related Reading
- Return on Invested Capital (ROIC) Explained — ROIC measures whether a company's reinvested capital is actually earning a return above its cost, the same question a DCF's growth taper implicitly answers.
- Free Cash Flow Yield Explained: How to Find Undervalued Stocks — a simpler, single-number alternative to a full DCF that uses the same free cash flow base built in Step 1 of this guide.
- Third-Party Financial Data: What Gets Lost When the Data Is Processed — how aggregator capex and cash flow definitions quietly distort the base-year inputs every DCF model depends on.
- NVIDIA 10-K Analysis (2026): 66% ROIC and the $120 Billion Cash Machine — a full capital-return audit of the same company using its prior annual filing.
- Value Investing Glossary: Terms, Ratios, and Mental Models Defined — full definitions of intrinsic value, book value, and the other valuation anchors referenced in this guide.
Wall Street's data. Main Street's price.
Institutional terminals charge thousands a year for as-filed accuracy. GeminIQ gives you the same thing for a fraction of the cost: financials built directly from raw SEC EDGAR filings, not third-party APIs, with full XBRL traceability back to the original 10-K or 10-Q. No normalized guesswork, just calculated metrics, charts, screeners, and watchlists built on numbers exactly as the company reported them. Start researching now at GeminIQ.com.
All financial figures cited in this article reference NVIDIA Corporation's Q1 FY2027 10-Q (filed May 20, 2026, period ending April 26, 2026). All SEC filings are publicly available at SEC EDGAR.
Disclaimer: The content in this blog is for educational and entertainment purposes only and does not constitute financial, legal, or tax advice. Investing involves risk, including the loss of principal. The views expressed are my own and not intended as financial advice or a guarantee of future performance.