
NVIDIA 10-K Analysis (2026): Inventory Grew Twice as Fast as Sales

By Chad Hartman
Published · Last updated
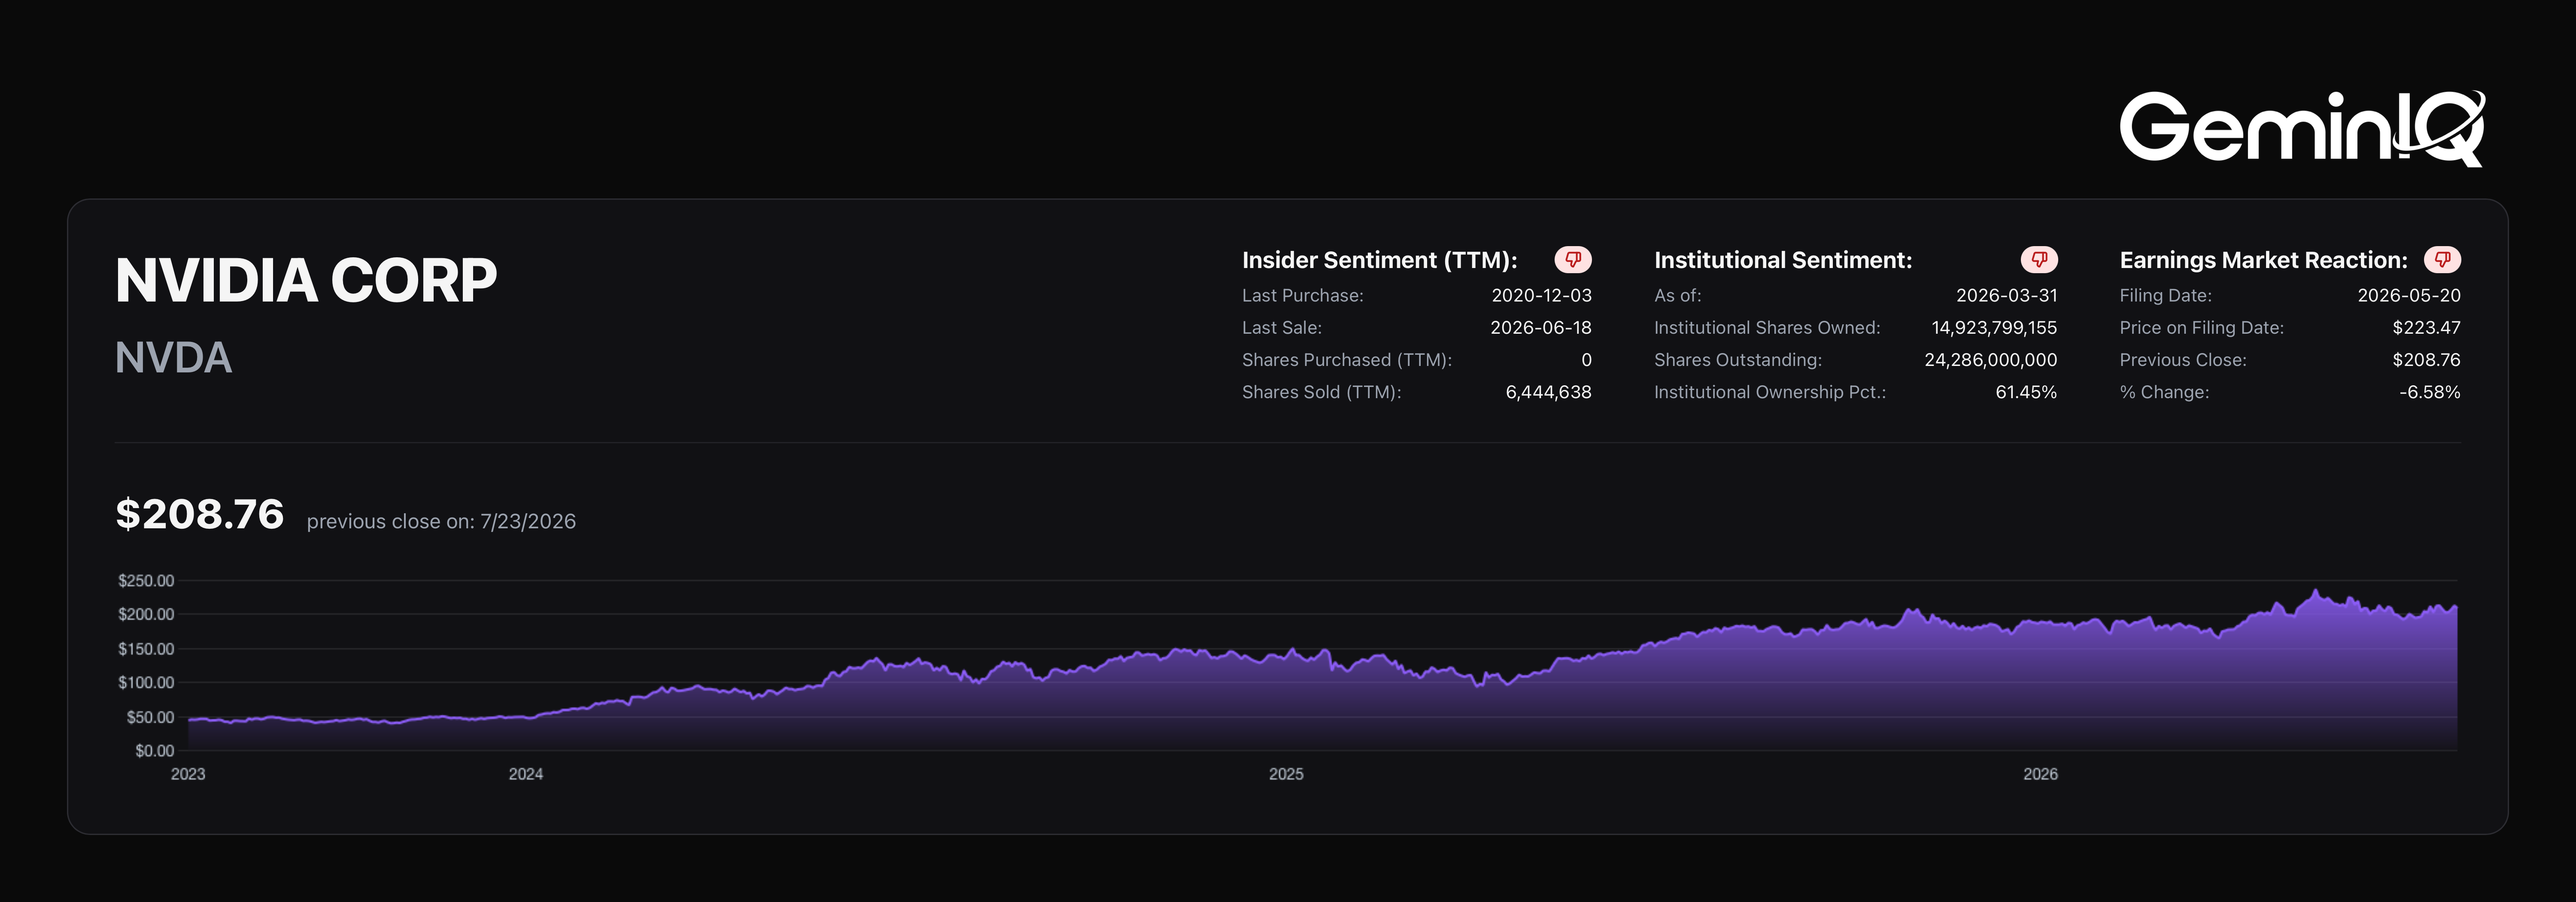
NVIDIA ($NVDA) filed its FY2026 10-K on February 25, 2026, covering the fiscal year ended January 25, 2026. Revenue grew 65.5% to $215.94 Billion, one of the largest single-year dollar increases any company has ever reported. Beneath that number, two things moved faster than sales and one moved the wrong way: inventory grew 112.3%, receivables grew 66.8%, and gross margin fell from 74.99% to 71.07%. None of these is a warning on its own. Together they describe a business whose working capital is starting to stretch under the weight of its own growth.
| Field | Value |
|---|---|
| Ticker | $NVDA |
| Filing | FY2026 10-K |
| Filed | February 25, 2026 |
| Period End | January 25, 2026 |
| Revenue Growth | +65.5% |
| Inventory Growth | +112.3% |
| Gross Profit Margin (TTM) | 71.07% |
| Cash Conversion Cycle | 96.9 Days |
Inventory Grew Twice as Fast as Revenue
When a company's inventory outgrows its sales by a wide margin, it is either building for demand it expects or accumulating product it hasn't sold. The filing shows which lines moved.
The Data: NVIDIA's Revenues grew 65.5%, from $130.50 Billion to $215.94 Billion. Over the same year, Inventory grew 112.3%, from $10.08 Billion to $21.40 Billion. That is inventory expanding at roughly 1.7x the rate of sales. GeminIQ's Days Inventory Outstanding extended to 91.97 days from 85.9 days, and Inventory Turnover slowed to 3.97x from 4.25x.
Receivables tell a calmer story. Accounts receivable grew 66.8%, from $23.06 Billion to $38.47 Billion, almost exactly in line with revenue, though Days Sales Outstanding still crept up to 52.0 days from 46.24 days.
The GeminIQ Edge: Inventory growth outrunning revenue growth by nearly two to one is the kind of divergence a headline revenue figure completely hides. Reading Inventory and Revenues as their own lines from the Financial Statements, and pulling the turnover metrics alongside, is what turns a 65.5% growth story into a question about what's sitting in the warehouse.
The Margin Came Down
The most profitable hardware business at scale in the market gave back nearly four points of gross margin in a single year.
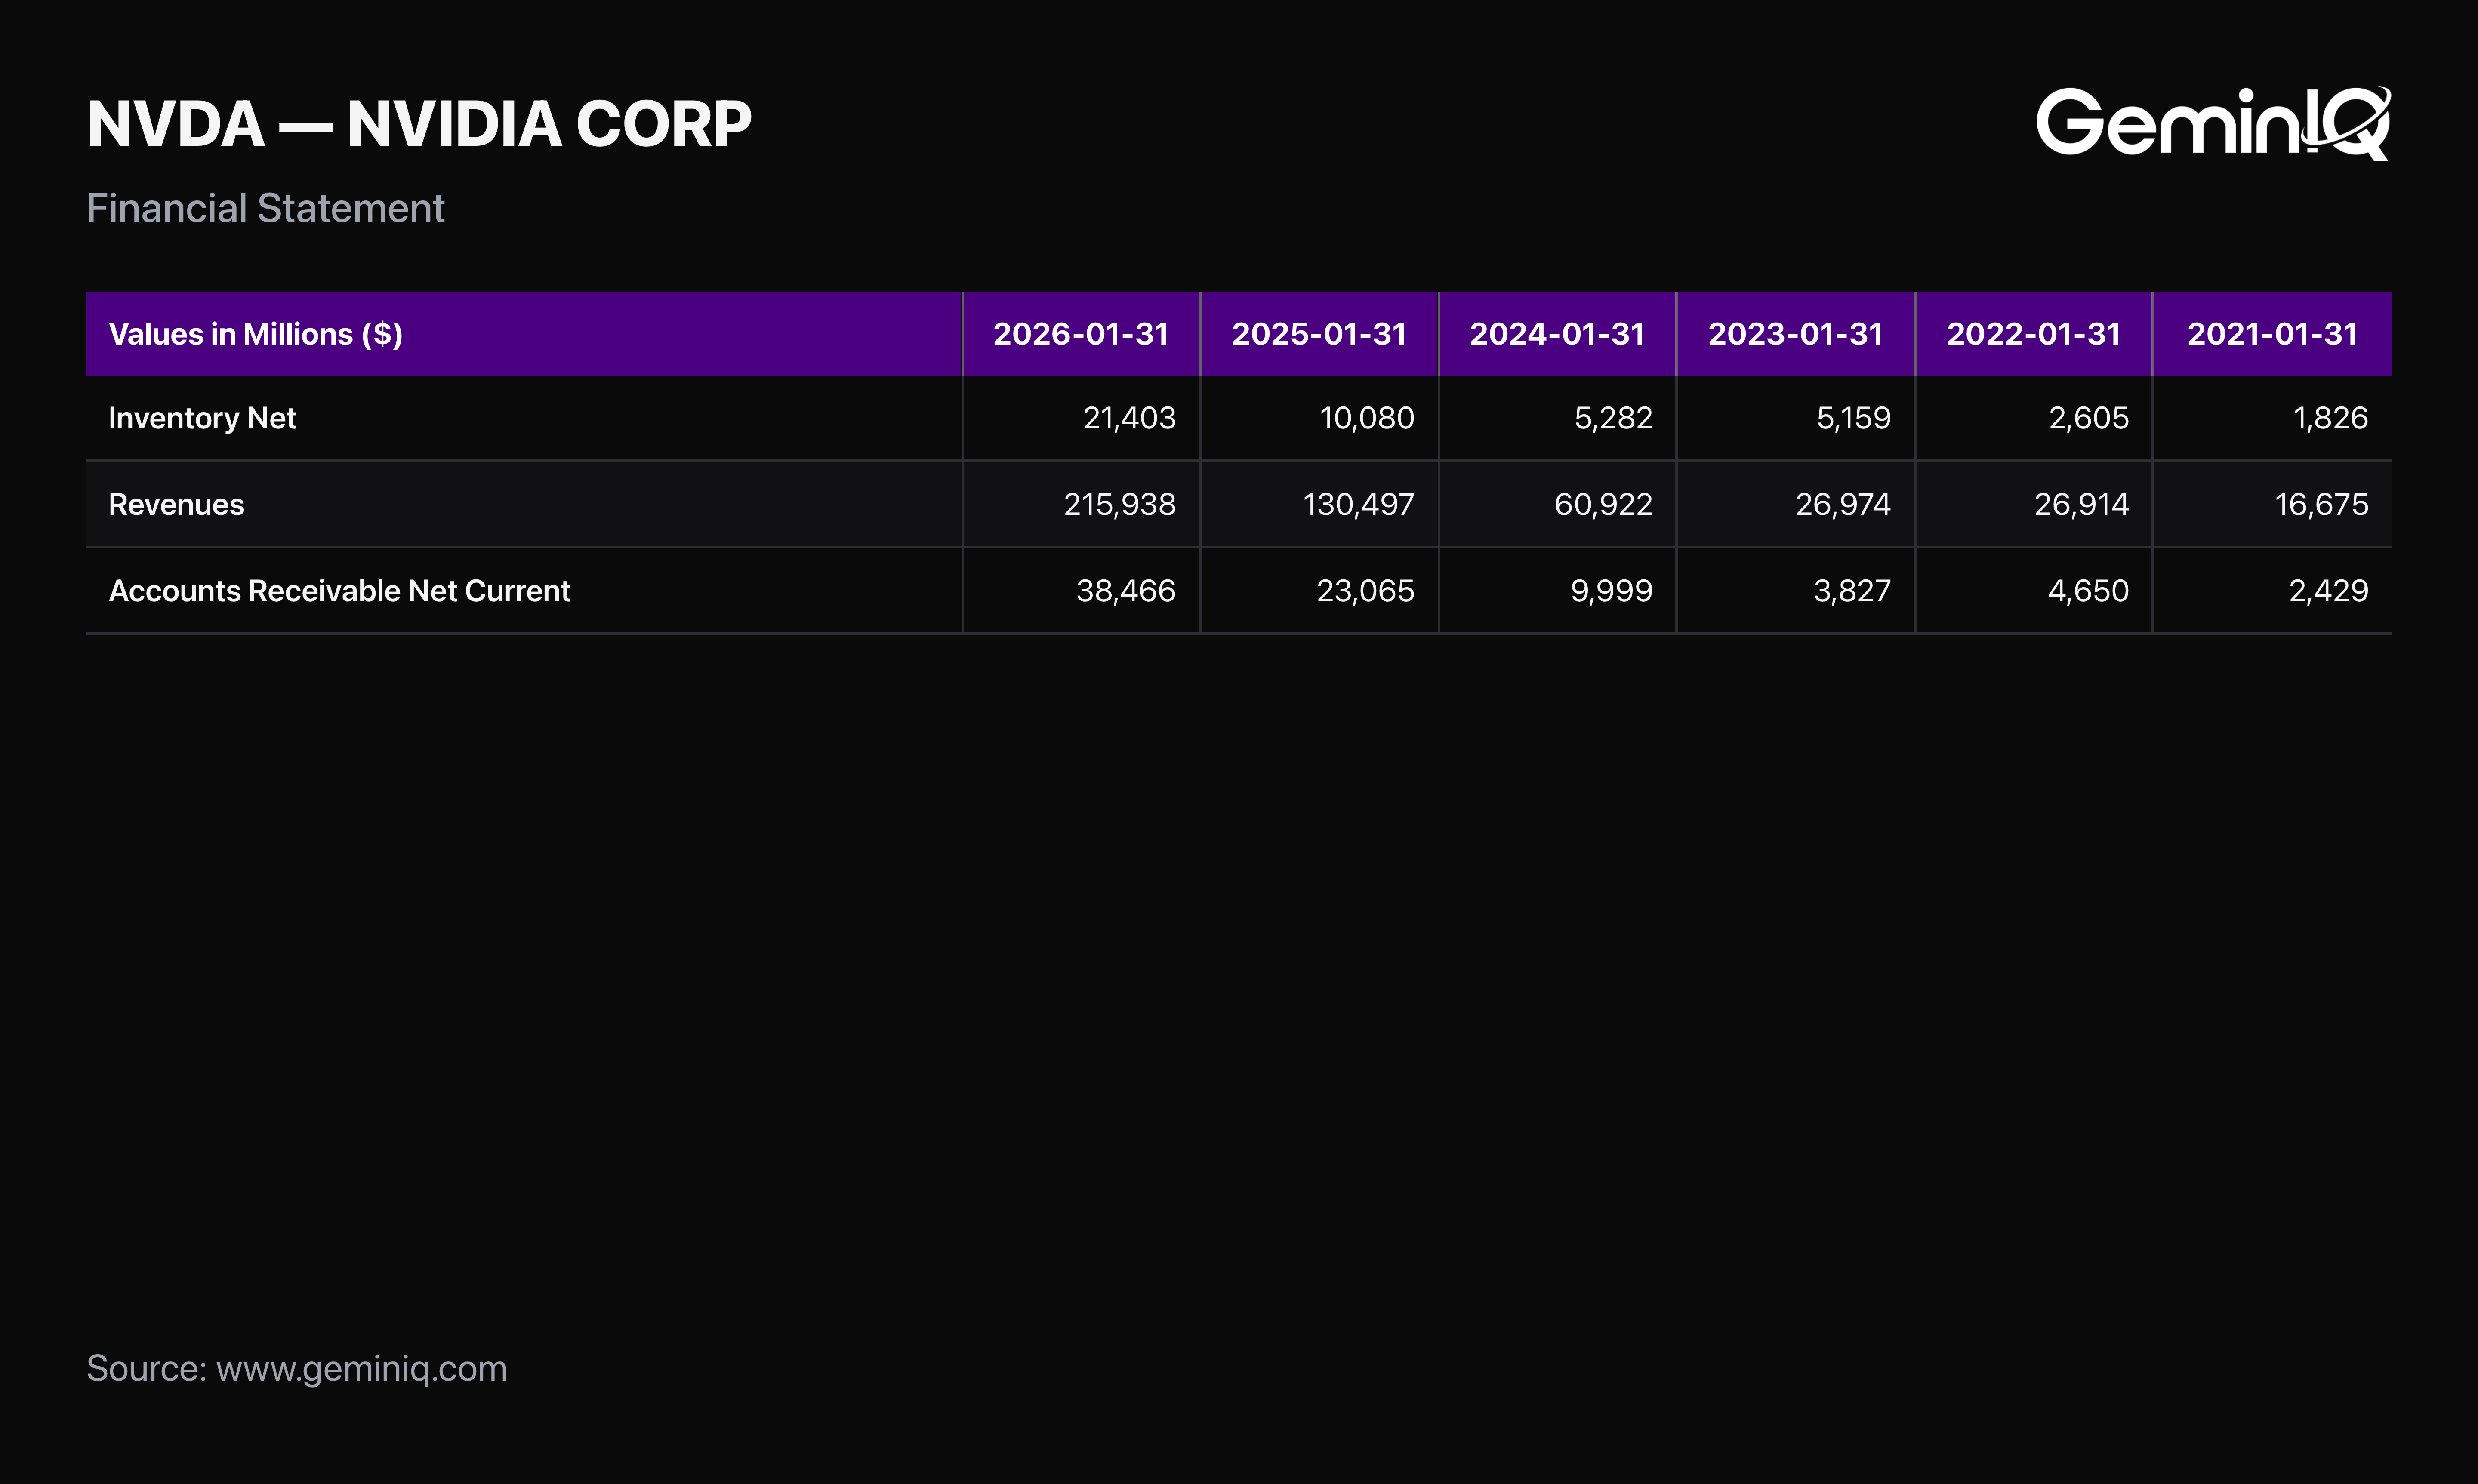
The Data: NVIDIA's GeminIQ Gross Profit Margin fell to 71.07% from 74.99%, a decline of 3.9 percentage points. In dollar terms Gross Profit still grew, to $153.46 Billion from $97.86 Billion, but Cost Of Sales grew faster than revenue: Cost Of Goods Sold rose 91.4%, from $32.64 Billion to $62.48 Billion, against the 65.5% revenue increase. GeminIQ's Operating Profit Margin also eased, to 60.38% from 62.42%.
The 74.99% gross margin in FY2025 was an extraordinary figure that reflected acute supply scarcity and pricing power. A move to 71.07% is still exceptional for hardware, and the decline is worth understanding rather than alarming over: cost of goods grew faster than sales, which is consistent with a richer mix of lower-margin systems and rising input costs as volume scaled.
The GeminIQ Edge: A gross margin falling from 74.99% to 71.07% while gross profit dollars rose 56.8% is a genuinely ambiguous signal, and the way to read it is to watch the cost line rather than the margin percentage. Cost Of Goods Sold growing 91.4% against 65.5% revenue growth is the specific fact underneath the margin move.
The Cash Conversion Cycle Extended
Inventory building faster than sales and receivables creeping up have the same downstream effect: cash gets tied up in working capital for longer.
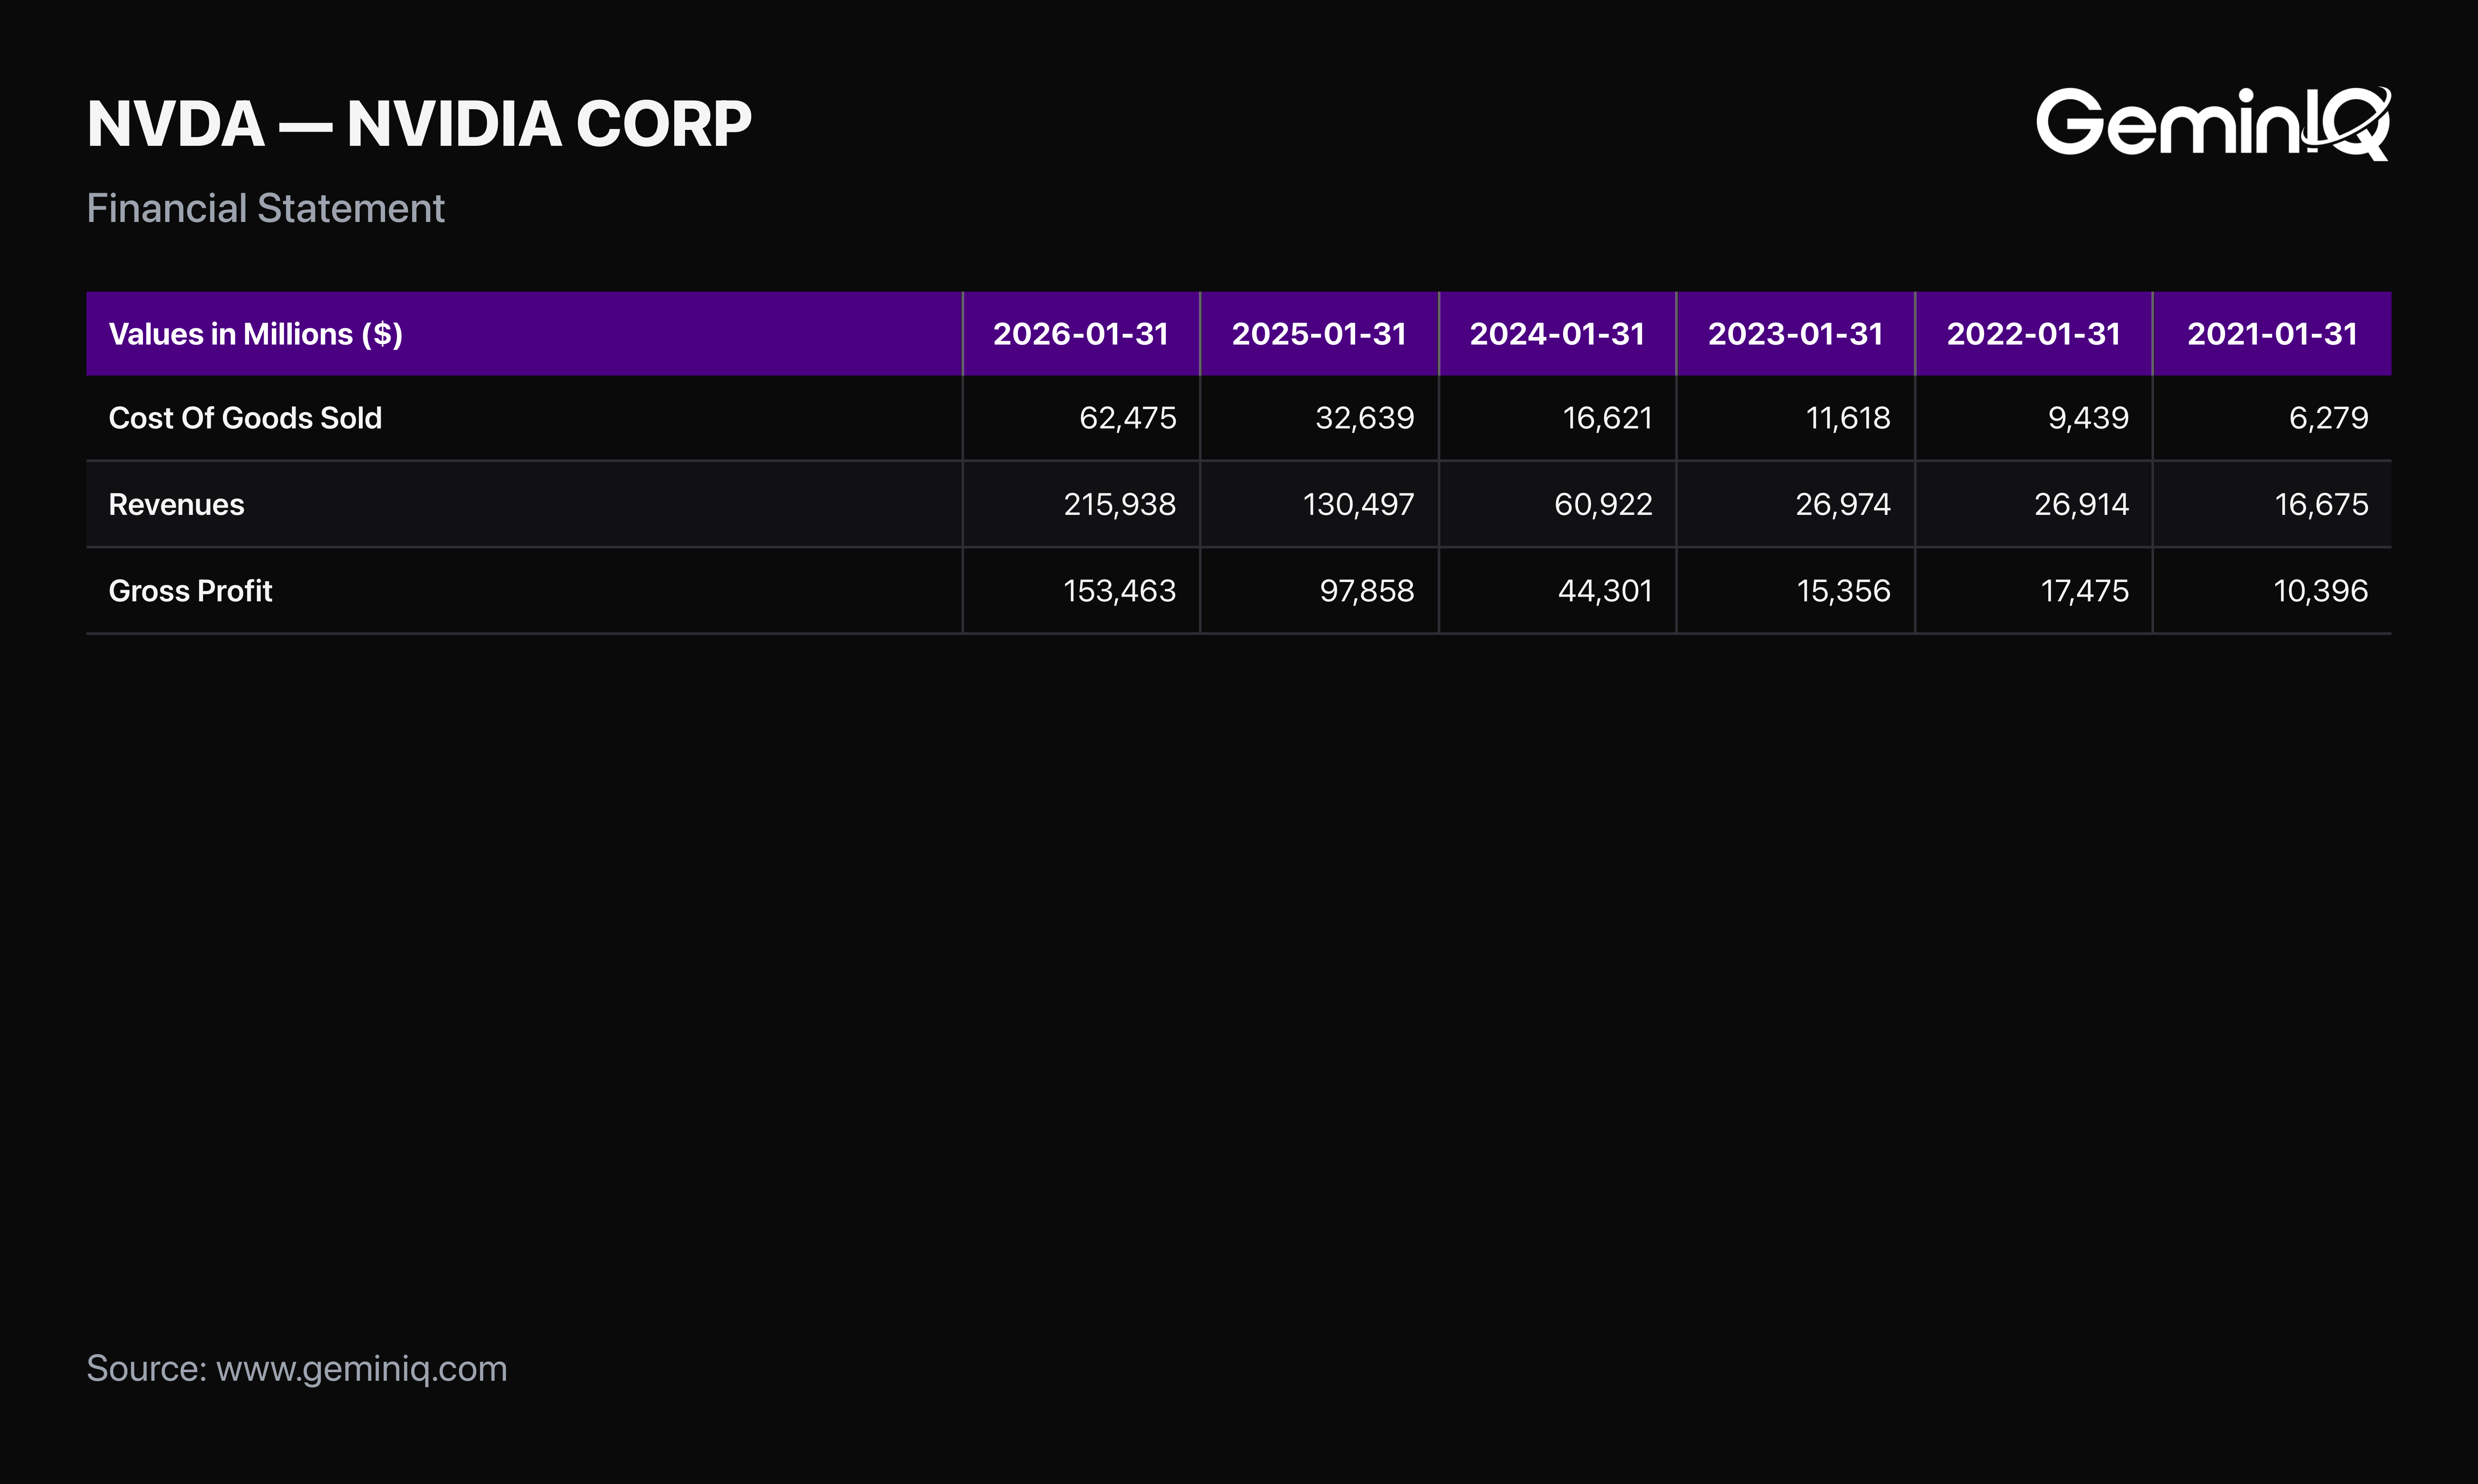
The Data: GeminIQ's Cash Conversion Cycle for NVIDIA extended to 96.9 days, the combination of 91.97 days of inventory and 52.0 days of receivables, offset by payables. That means NVIDIA now waits roughly three months and change between paying for the components in a product and collecting the cash from selling it. The absolute cash generation remains enormous: Net Cash Provided By Operating Activities was $102.7 Billion and Free Cash Flow was $96.68 Billion, both up roughly 60%.
Despite the working capital drag, the cash machine kept pace with earnings. Net Income was $120.07 Billion, up 64.7%, and free cash flow grew 58.9%, so the lengthening cycle slowed the conversion but did not break it.
The GeminIQ Edge: A cash conversion cycle near 97 days at a company generating $96.68 Billion of free cash flow is not a liquidity concern. It is a leading indicator. The cycle extends before the cash flow shows strain, which is exactly why reading the working capital metrics matters when the headline cash figure still looks pristine.
What You Pay for the Growth
The valuation compressed even as the business grew, because earnings grew faster than the price.
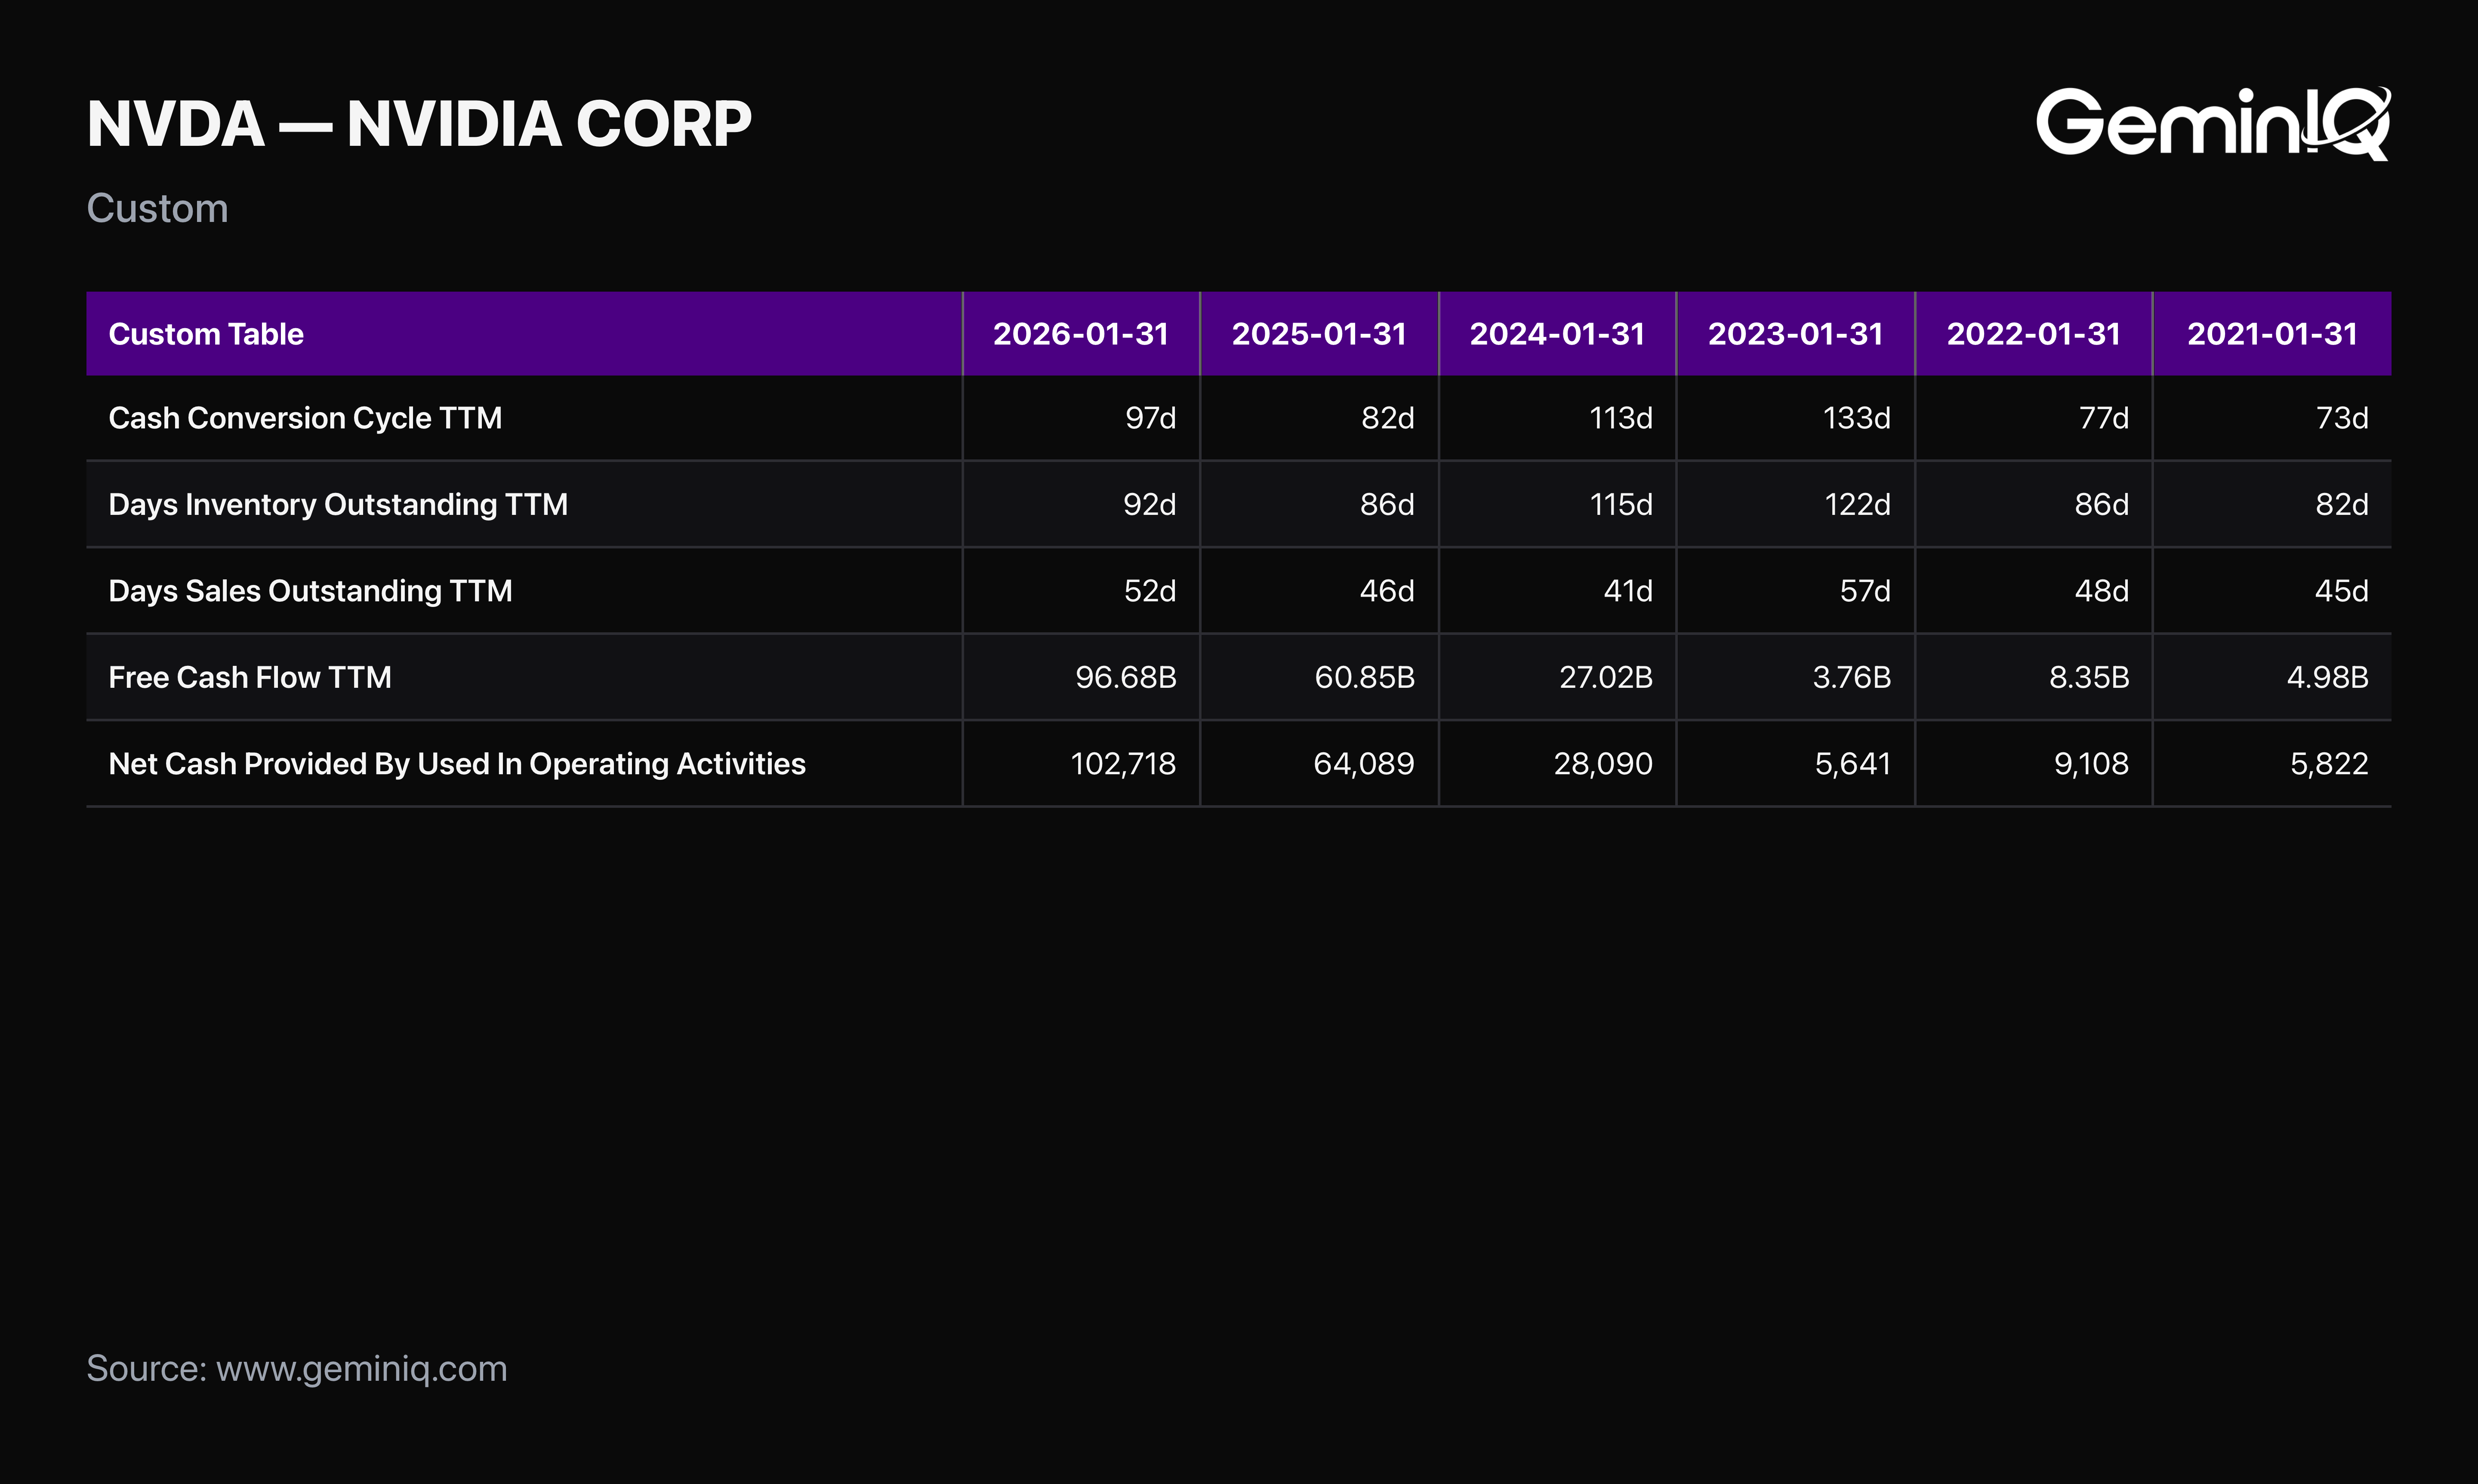
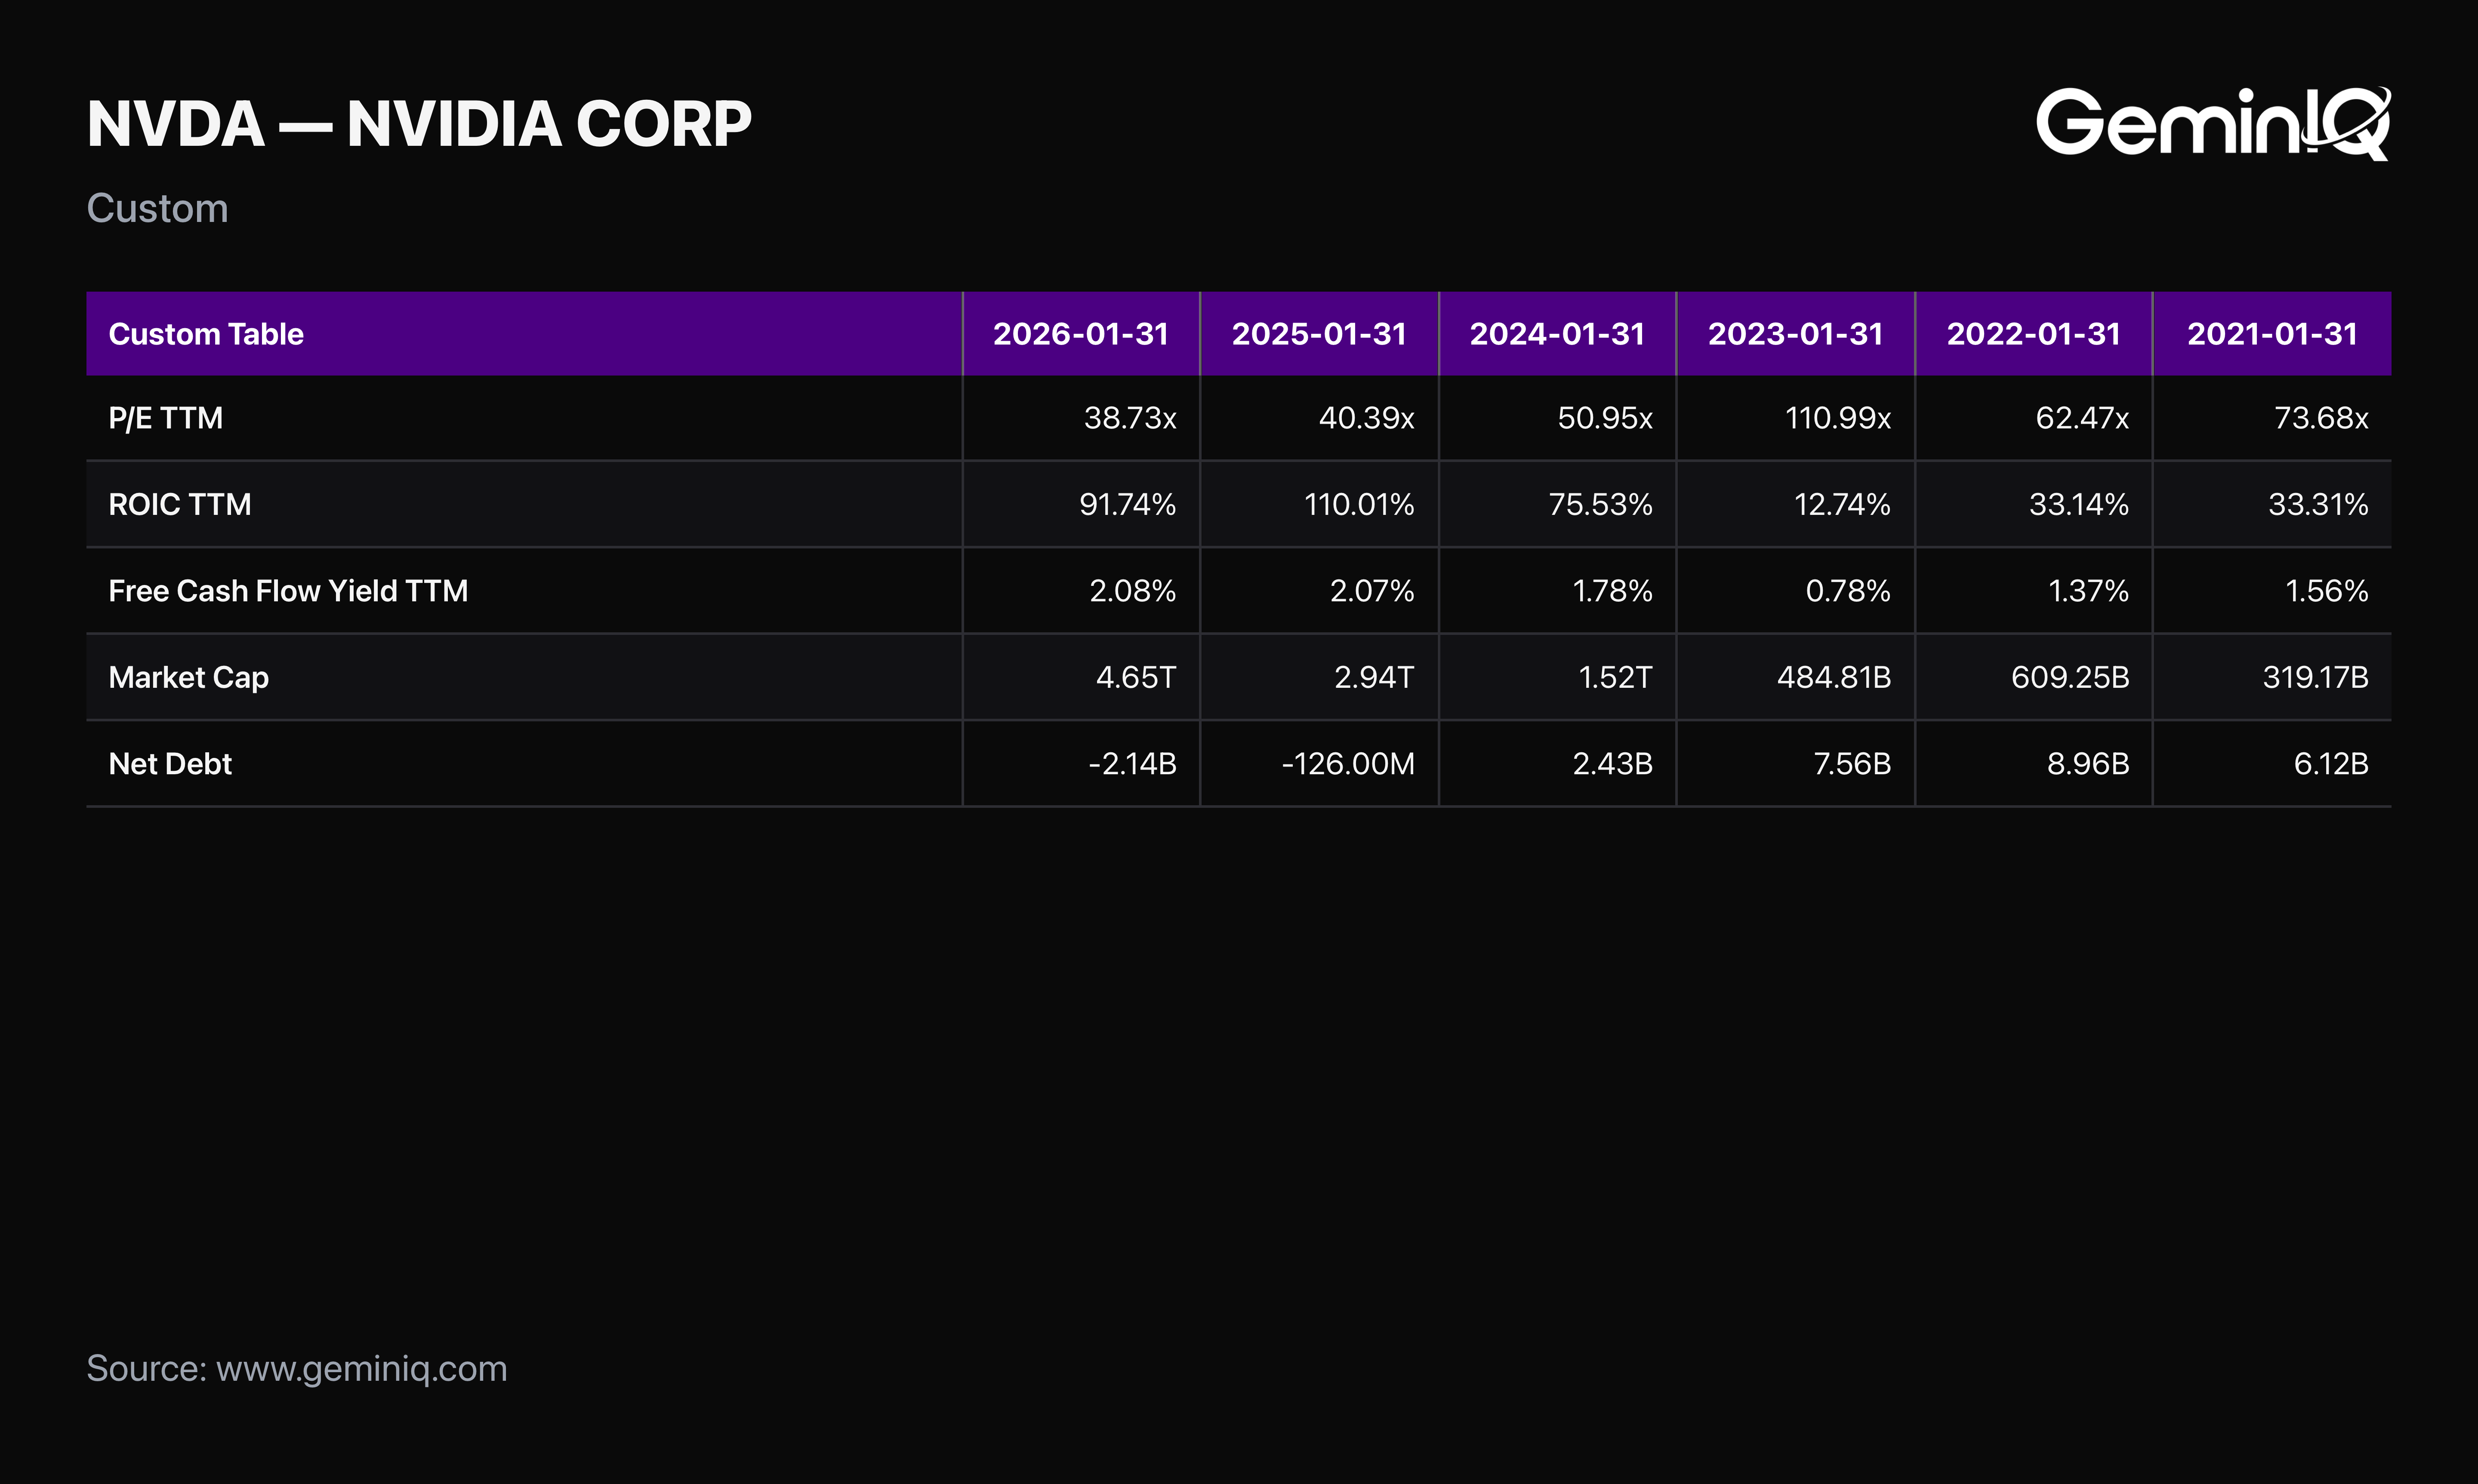
The Data: NVIDIA's market capitalization reached $4.65 Trillion at fiscal year end, and the trailing Price to Earnings Ratio actually fell to 38.73 from 40.39 a year earlier, because Net Income growth of 64.7% outpaced the share price. GeminIQ's Free Cash Flow Yield held at 2.08%, essentially flat against 2.07%.
Capital efficiency remained in a category of its own. GeminIQ's Return on Invested Capital was 91.74%, down from an extraordinary 110.0% the prior year but still among the highest of any large company on record. GeminIQ's Net Debt is negative at -$2.14 Billion, a net cash position.
The GeminIQ Edge: A stock that grew into a lower multiple while compounding earnings at 64.7% is doing something unusual, and it complicates any simple "expensive" or "cheap" verdict. The working capital signals matter precisely because the valuation and cash metrics give no warning at all.
Smart Money and the Insider Record
What are the people actually running the company doing with their own money?
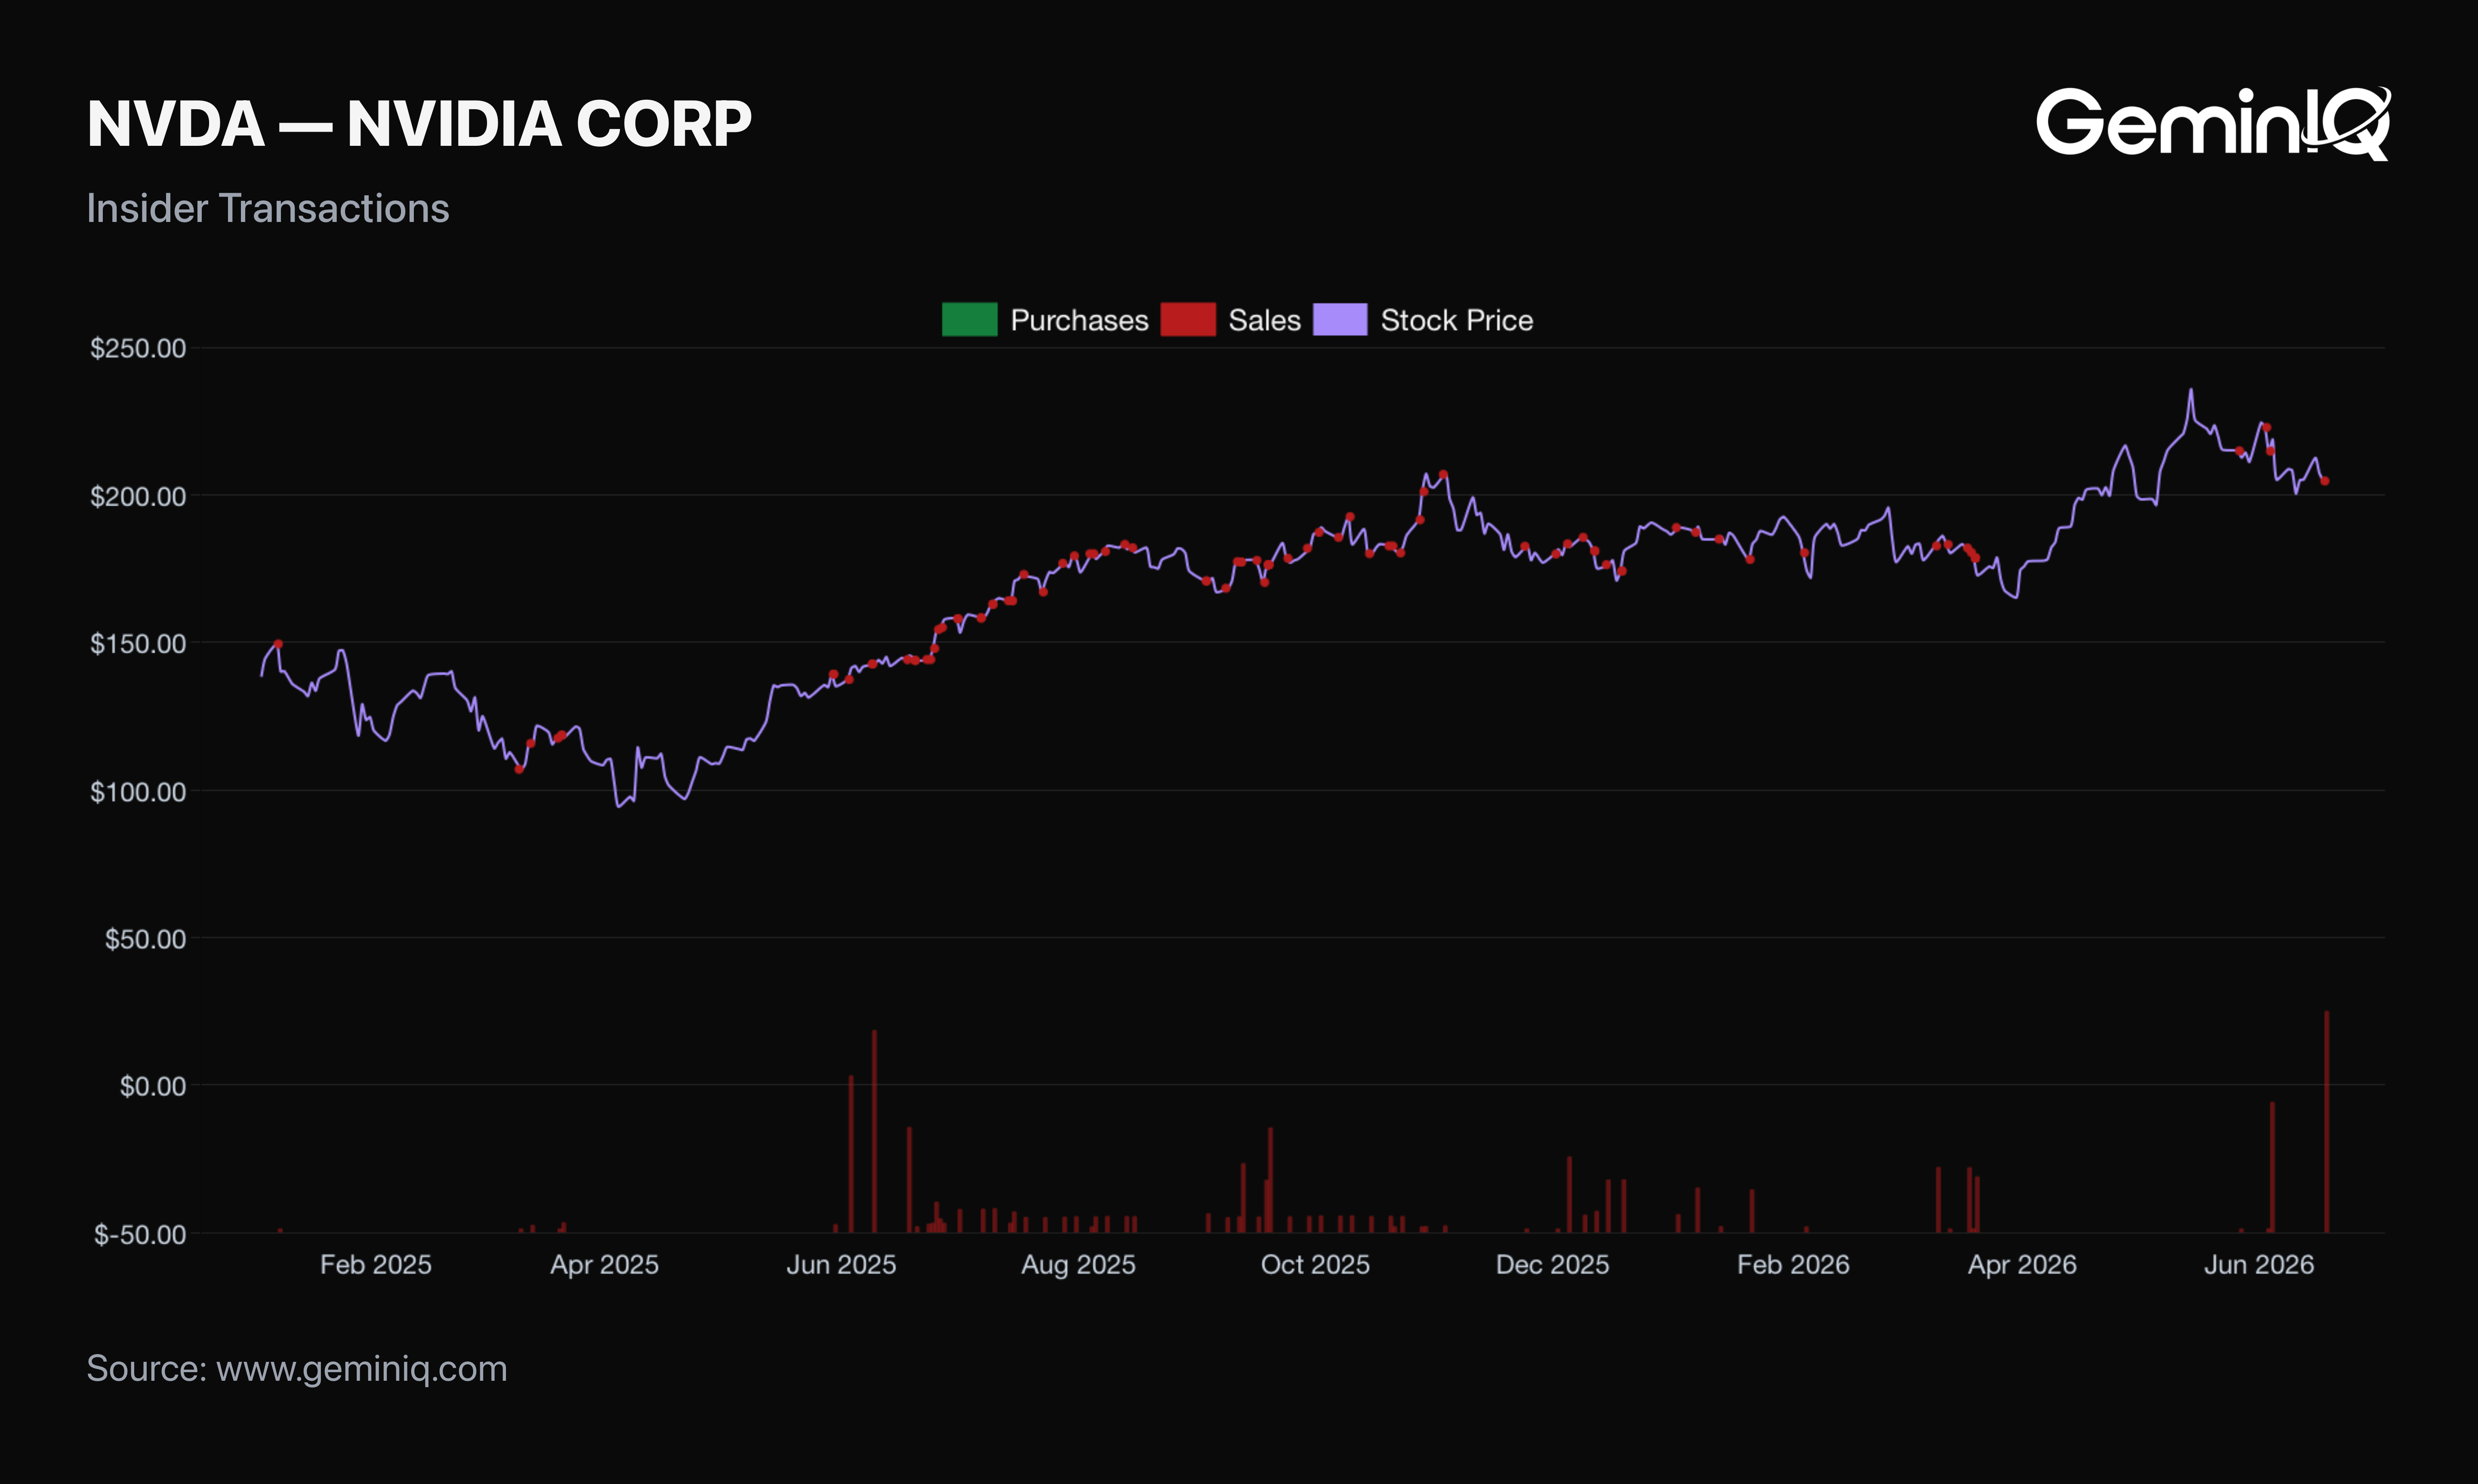
The Data: Since January 1, 2025, GeminIQ's Insider Transactions records 158 sale filings by NVIDIA insiders totaling $2.79 Billion, and zero purchases. The largest is 885,000 shares by a Director at $210.07 on June 18, 2026, for $185.91 Million, followed by 1,000,000 shares at $142.80 on June 9, 2025, for $142.80 Million.
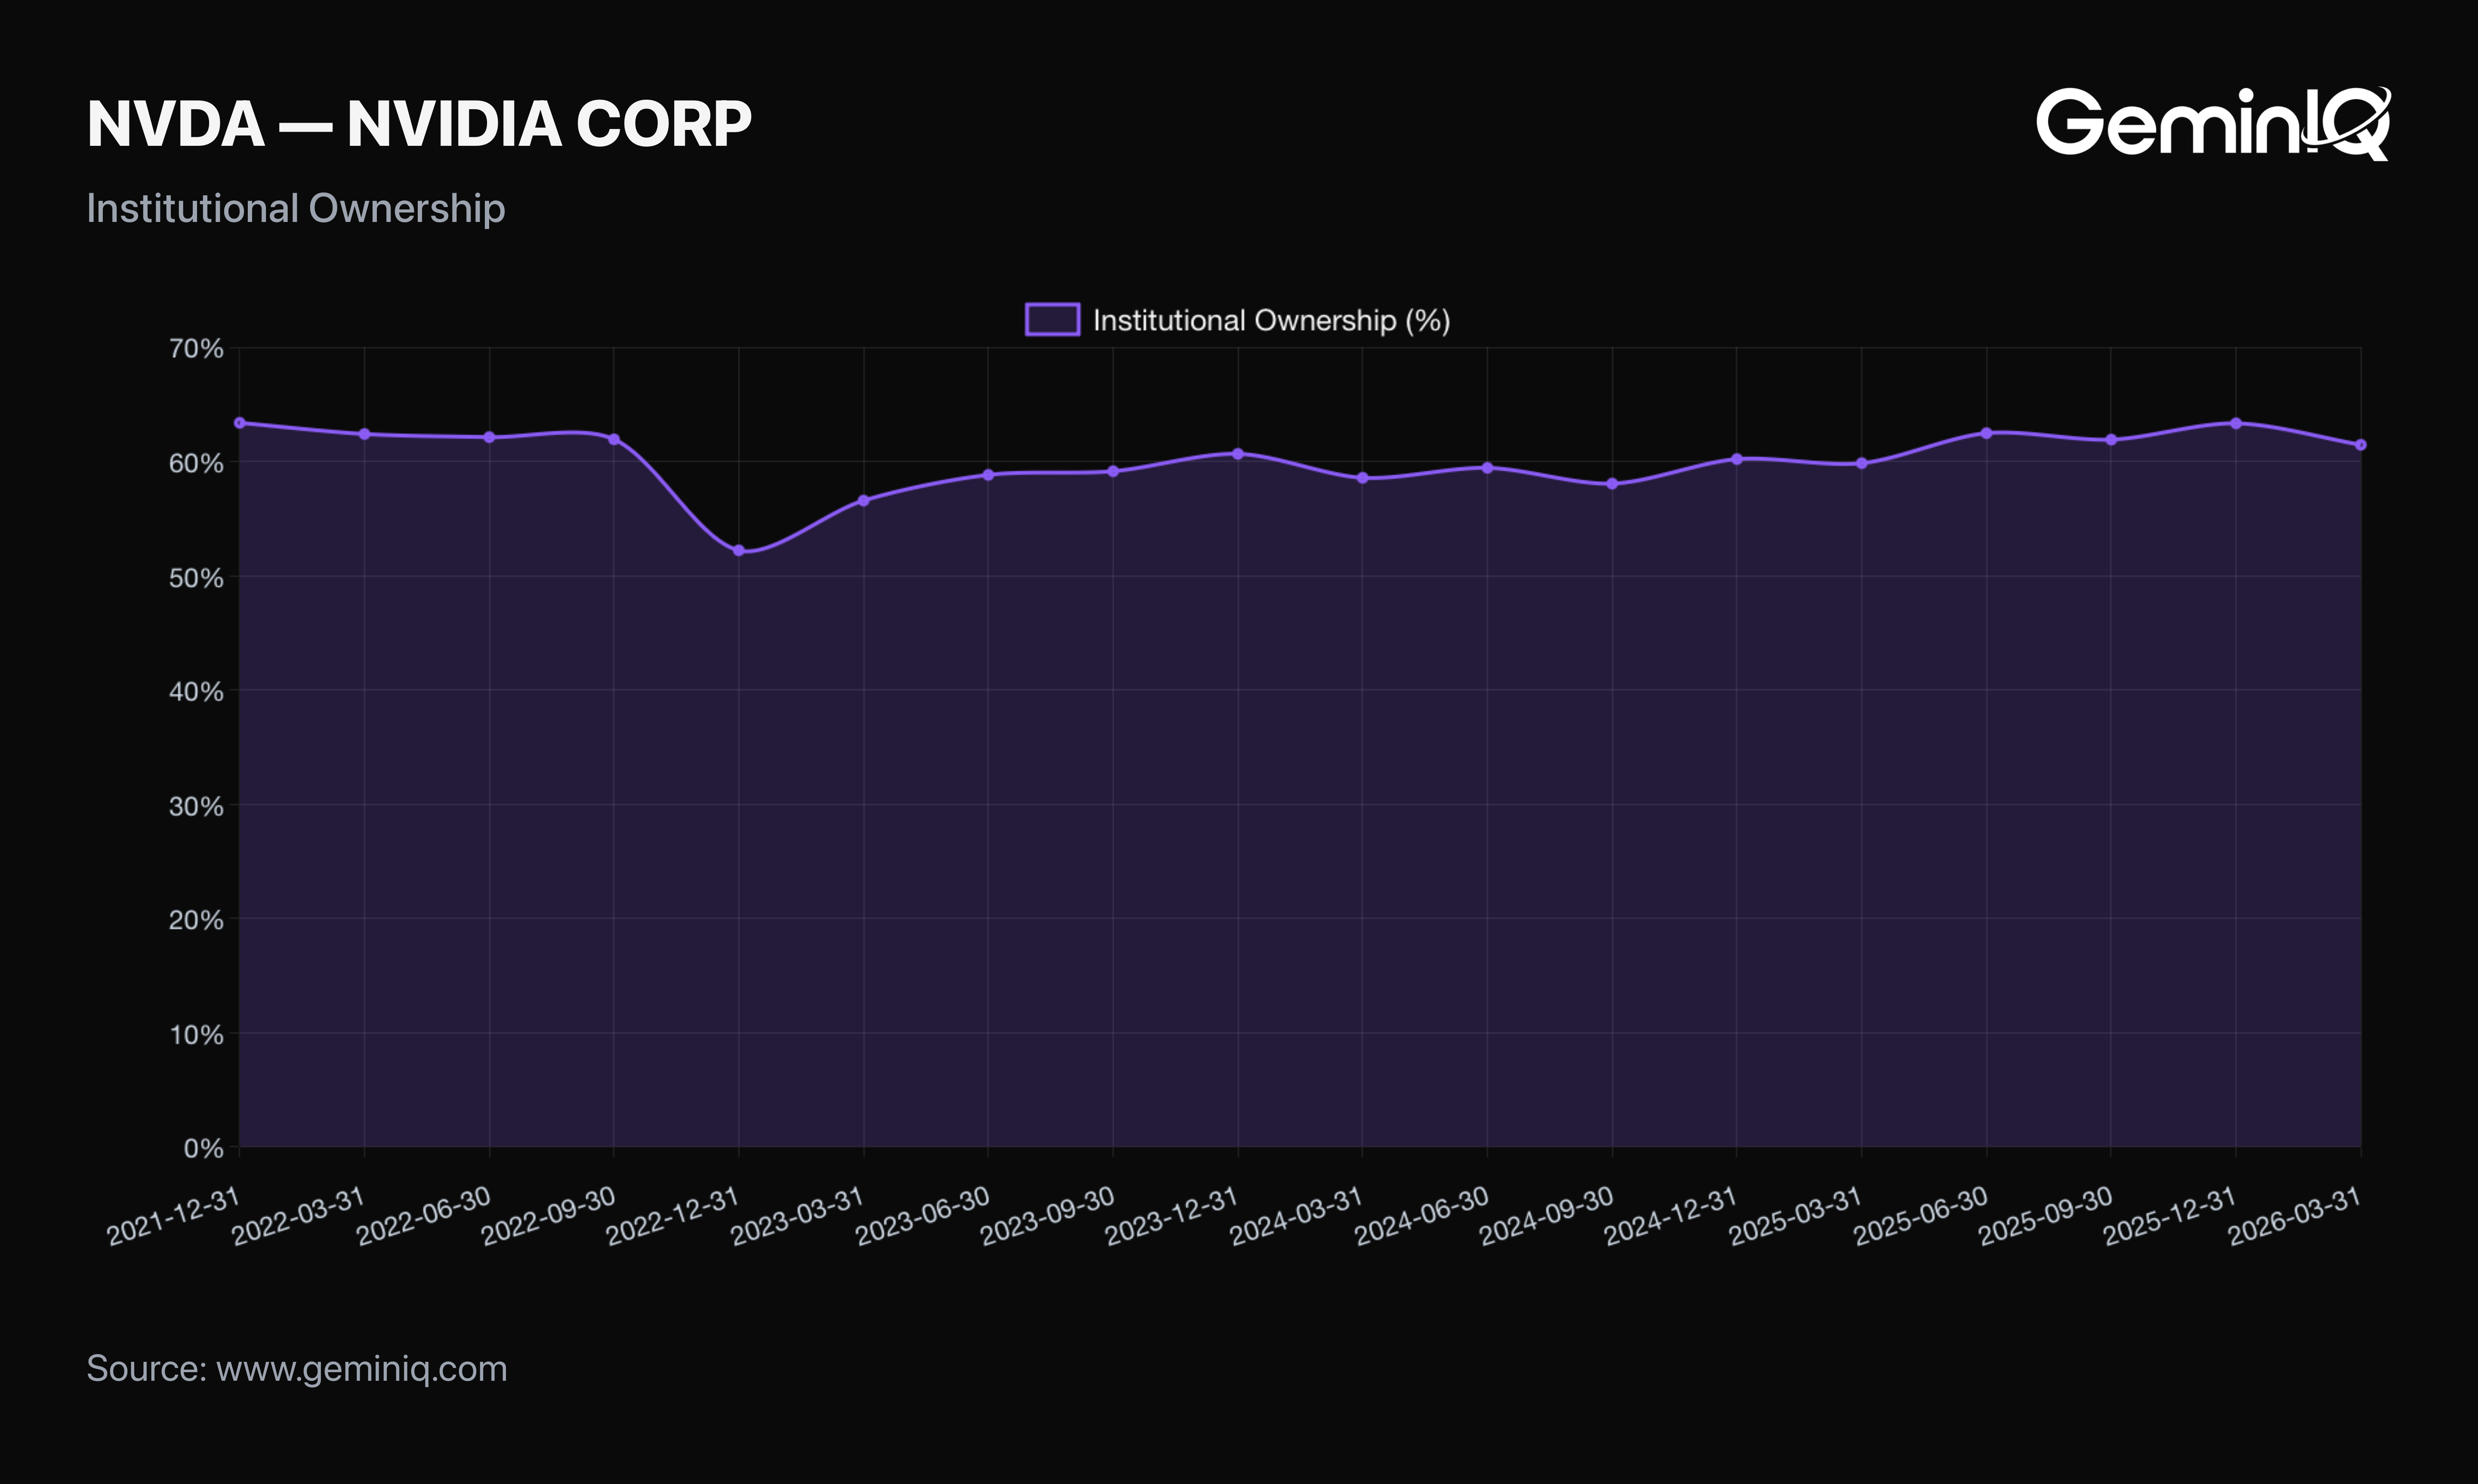
Institutional Ownership reached 63.33% of shares outstanding as of the quarter ending December 31, 2025, easing to 61.45% as of March 31, 2026. Both come from quarterly 13F filings and describe positioning as of those quarter-ends rather than current holdings.
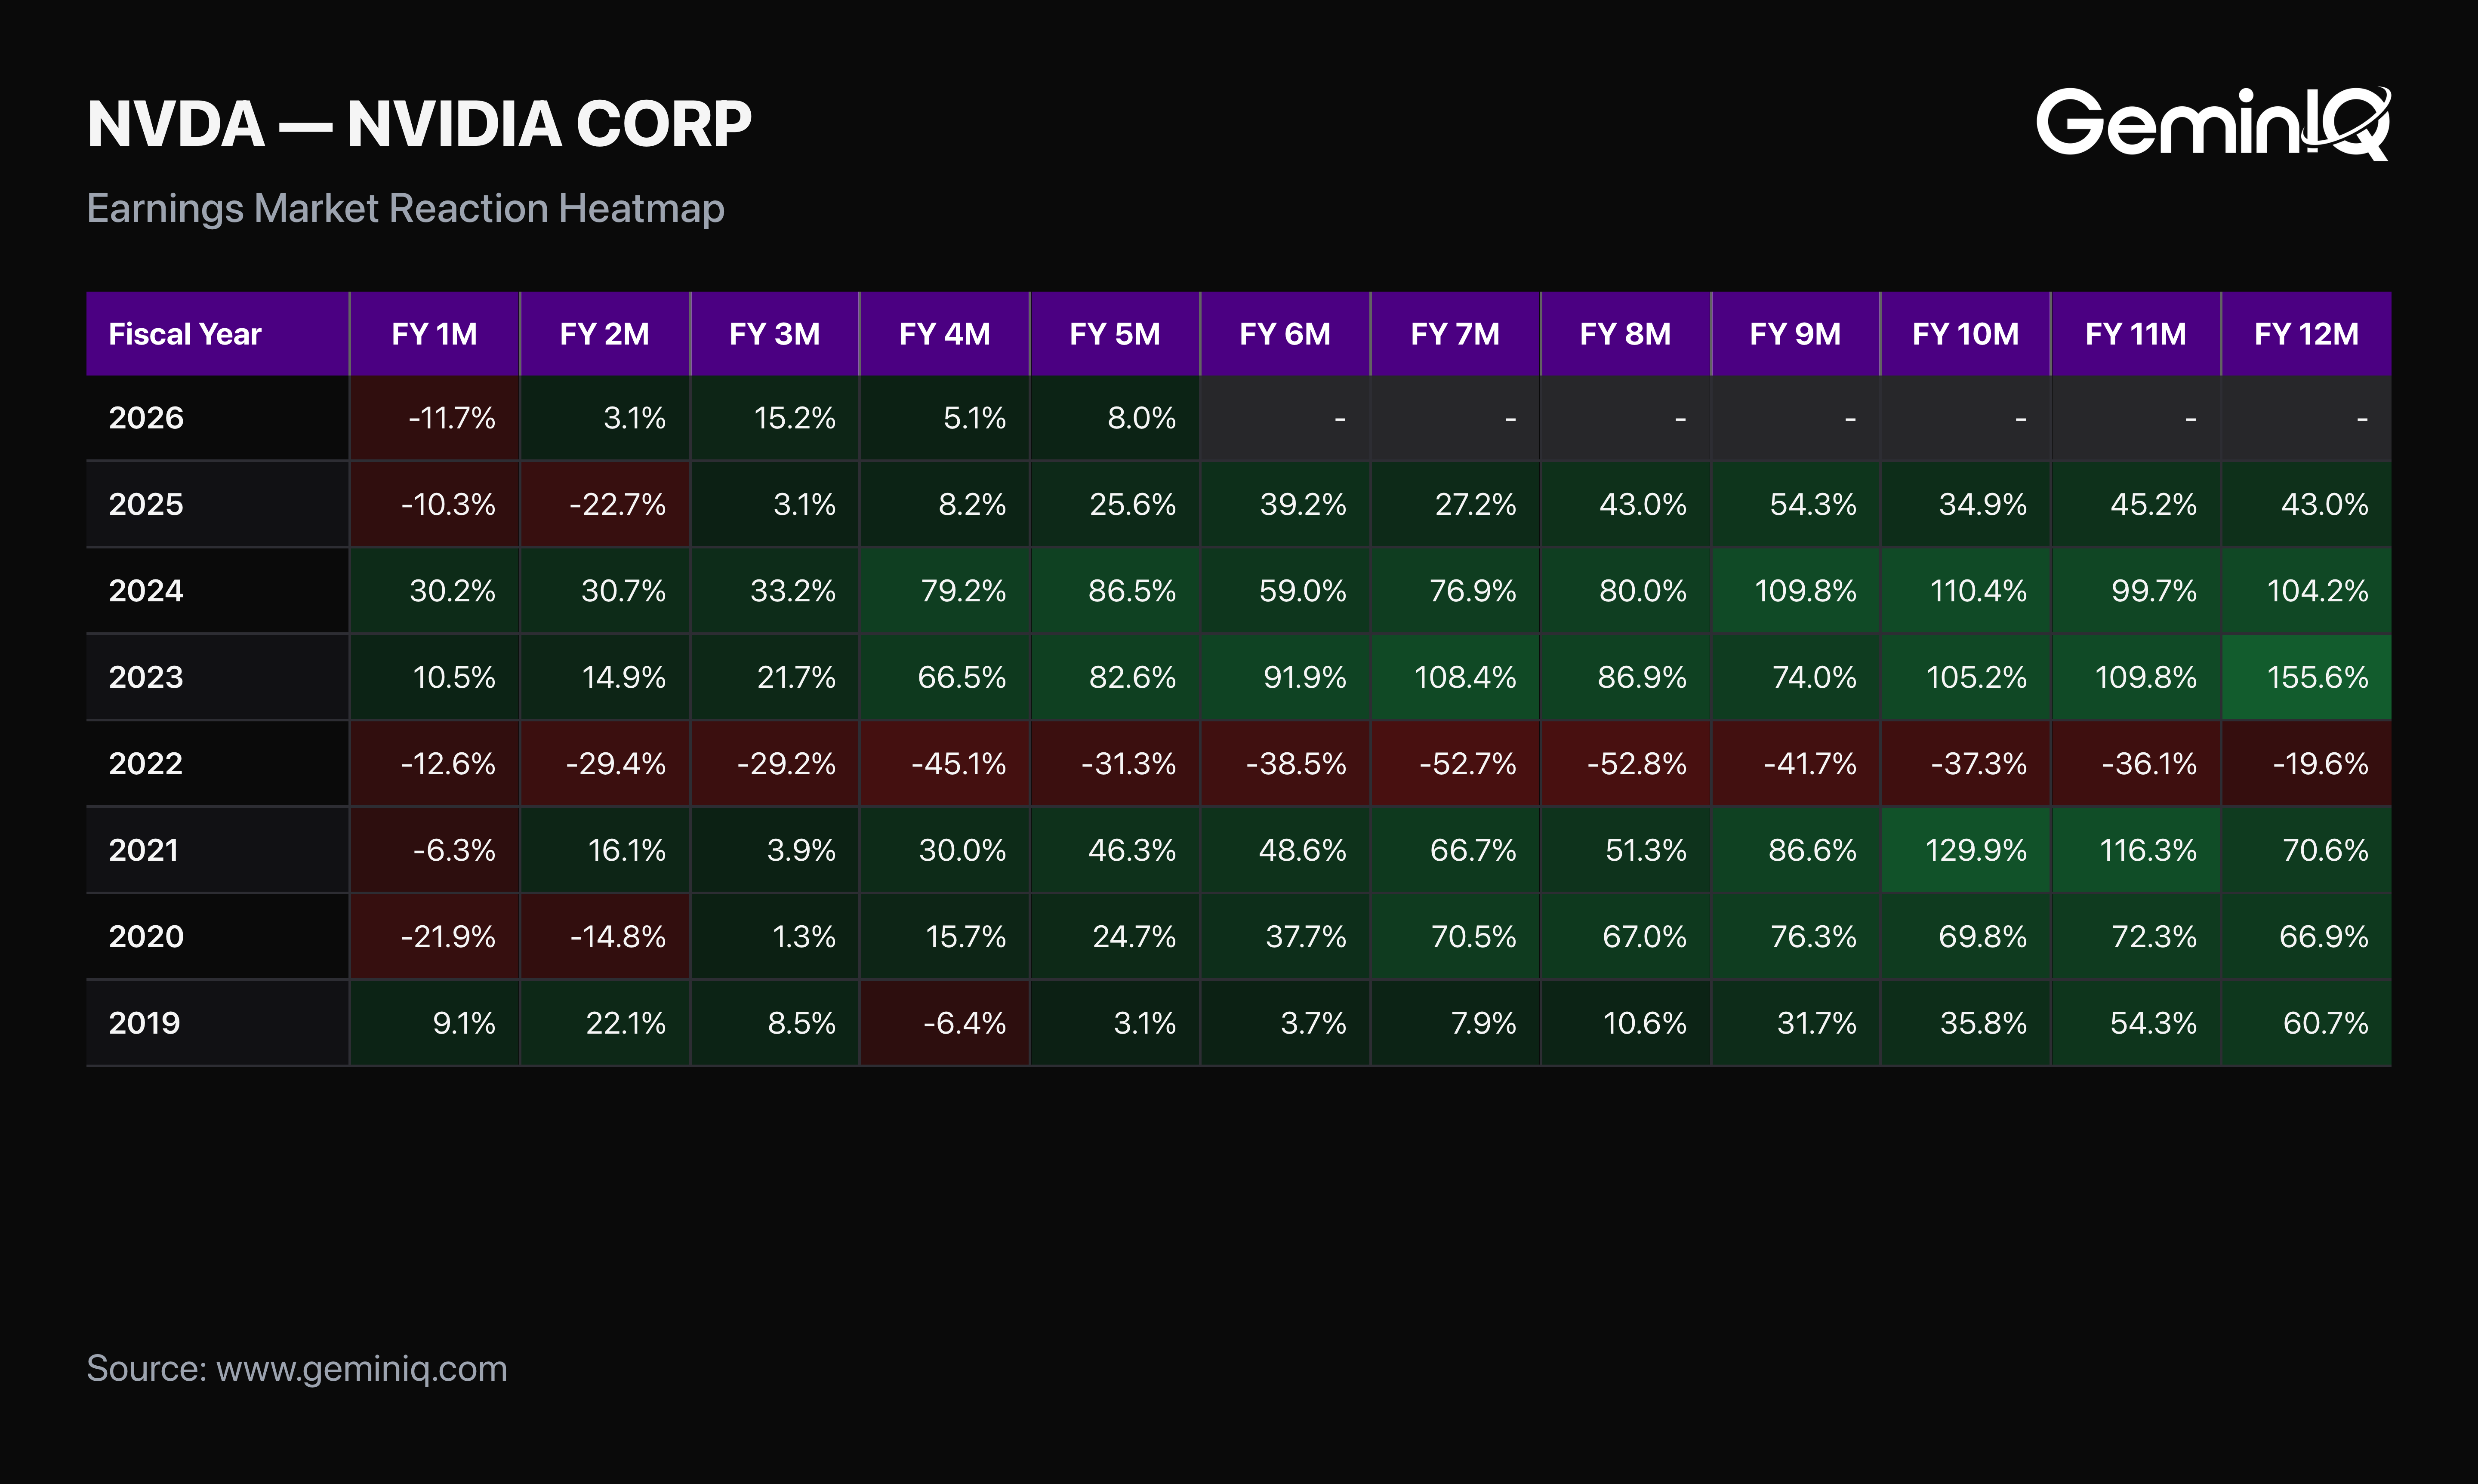
The GeminIQ Edge: Heavy insider selling at a stock that has appreciated this much is expected, scheduled, and close to uninformative, which is why the dollar figure matters less than it looks. GeminIQ's Earnings Market Reaction Heatmap carries more signal here: the stock fell 11.68% one month after this 10-K was filed, then recovered to gain 3.14% at two months, 15.22% at three and 8.01% at five. The full twelve-month window has not yet elapsed.
Frequently Asked Questions
Did NVIDIA's inventory grow faster than its sales in FY2026?
Yes, by a wide margin. Inventory grew 112.3%, from $10.08 Billion to $21.40 Billion, while revenue grew 65.5%. That is inventory expanding at roughly 1.7x the rate of sales, extending Days Inventory Outstanding to 91.97 days from 85.9 days.
Why did NVIDIA's gross margin fall?
Cost of goods sold grew faster than revenue. Cost Of Goods Sold rose 91.4% against 65.5% revenue growth, pulling Gross Profit Margin to 71.07% from 74.99%. The prior year's figure reflected acute supply scarcity that has partly normalized.
What is NVIDIA's cash conversion cycle?
96.9 days as of the FY2026 10-K, combining 91.97 days of inventory and 52.0 days of receivables, offset by payables. It extended over the year as inventory and receivables grew, though free cash flow still rose more than 58% to $96.68 Billion.
Is NVIDIA still generating strong free cash flow?
Yes. Free Cash Flow was $96.68 Billion in FY2026, up 58.9%, on operating cash flow of $102.7 Billion. The working capital buildup slowed cash conversion but did not stop it.
How do I check whether a company's growth is straining its working capital?
Compare the growth rates of inventory and receivables against revenue growth for the same period. When inventory grows materially faster than sales, cash is being tied up in unsold or pre-positioned product, and the cash conversion cycle will lengthen before the cash flow statement shows any strain.
NVIDIA's most recent annual filing is a Form 10-K filed February 25, 2026, covering the fiscal year ended January 25, 2026 (FY2026).
Wall Street's data. Main Street's price.
Institutional terminals charge thousands a year for as-filed accuracy. GeminIQ gives you the same thing for a fraction of the cost: financials built directly from raw SEC EDGAR filings, not third-party APIs, with full XBRL traceability back to the original 10-K or 10-Q. No normalized guesswork, just calculated metrics, charts, screeners, and watchlists built on numbers exactly as the company reported them. Start researching now at GeminIQ.com.
All financial figures cited in this article reference NVIDIA Corporation's FY2026 10-K (filed February 25, 2026, period ending January 25, 2026). All SEC filings are publicly available at SEC EDGAR.
Disclaimer: The content in this blog is for educational and entertainment purposes only and does not constitute financial, legal, or tax advice. Investing involves risk, including the loss of principal. The views expressed are my own and not intended as financial advice or a guarantee of future performance.