Free Cash Flow Yield Explained: How to Find Undervalued Stocks
By Chad Hartman
Published June 7, 2026 · Last updated June 14, 2026
The P/E ratio is the most widely reported valuation metric in financial media. It appears in every earnings headline, every analyst note, every stock comparison table. And it is built entirely on net income — an accounting figure that management teams have meaningful latitude to shape through depreciation schedules, amortization choices, one-time charges, and non-cash items. Free cash flow is not immune to all forms of manipulation, but it is substantially more resistant. Cash either moved through the bank account or it did not. Free cash flow yield converts that reality into a valuation multiple — expressing the cash a business generates as a percentage of the price you are paying for it. It is the metric that separates companies that merely look cheap from companies that actually are.
Table of Contents
- What Is Free Cash Flow Yield?
- How Is Free Cash Flow Yield Calculated?
- Why FCF Yield Is a More Reliable Valuation Metric Than P/E
- How to Interpret FCF Yield: The Thresholds That Matter
- When High FCF Yield Is a Warning Sign, Not a Buy Signal
- Why FCF Yield Numbers Differ Across Platforms
- How to Find High FCF Yield Stocks Using GeminIQ
What Is Free Cash Flow Yield?
Free cash flow yield is the ratio of a company's free cash flow to its market capitalization. It answers one of the most fundamental questions in investing: for every dollar you invest in a business at its current price, how many cents of real cash does that business generate each year?
Think of it as the cash-flow equivalent of earnings yield — which is itself the inverse of the P/E ratio. Where earnings yield divides net income by market cap, free cash flow yield divides actual cash generation by market cap. The result is expressed as a percentage: a 5% FCF yield means the business generates $5 of free cash for every $100 of market value. A 2% FCF yield means you are paying 50x free cash flow for the business — and you need to believe strongly in its future growth to justify that price.
The metric gained serious traction in the early 2000s as analysts searched for valuation frameworks that had not failed catastrophically during the dot-com collapse. P/E multiples had expanded to absurd levels for companies that barely had revenue, let alone earnings. FCF yield, rooted in actual cash generation, became the corrective — and it has remained a core valuation tool for fundamental investors ever since. Academic research has generally found that high FCF yield is a positive predictor of subsequent equity returns, aligning with the intuition that paying less per dollar of cash is a sound long-term approach.
How Is Free Cash Flow Yield Calculated?
The formula has two components: free cash flow and market capitalization.
Free Cash Flow Yield = Free Cash Flow (TTM) ÷ Market Capitalization
Where free cash flow itself equals:
Free Cash Flow = Operating Cash Flow − Capital Expenditures
Operating cash flow is the cash the business generates from its core operations, after working capital movements and before financing or investing activities. It comes directly from the cash flow statement in the company's 10-K or 10-Q, where it is tagged under the XBRL identifier NetCashProvidedByUsedInOperatingActivities. Capital expenditures — the cash the company spends on property, plant, equipment, and other long-lived assets — appears as a cash outflow in the investing activities section of the same statement, tagged as PaymentsToAcquirePropertyPlantAndEquipment.
Market capitalization is shares outstanding multiplied by the current stock price. Because market cap changes continuously while financial data updates only at filing dates, FCF yield is typically calculated using the most recent four quarters of cash flow data (trailing twelve months, or TTM) against a recent market price.
GeminIQ's Free Cash Flow Yield TTM metric calculates this directly from XBRL-tagged cash flow statement data in SEC filings, using as-filed operating cash flow and capital expenditure figures alongside period-end shares outstanding. Because the calculation uses as-filed numbers rather than normalized or adjusted inputs, it reflects the actual economics of the business as reported — not a version that a third-party aggregator decided was more representative.
Why FCF Yield Is a More Reliable Valuation Metric Than P/E
The core argument for preferring FCF yield over P/E comes down to one word: cash.
Net income is the product of accounting rules. A company that aggressively capitalizes software development costs will report higher current earnings than one that expenses them immediately — even if the two businesses are economically identical. A company using longer depreciation schedules on its equipment will report higher earnings than one using accelerated depreciation for the same asset base. Strategic tax timing can inflate earnings in specific periods. None of these choices affect cash.
Consider Apple's FY2025 financial results as an illustration. The company reported net income of $112.0 billion. Its operating cash flow was $111.5 billion — nearly identical. But bridging those two numbers requires accounting for $12.9 billion in stock-based compensation (a non-cash expense added back in the cash flow statement), $11.7 billion in depreciation and amortization, and roughly $20 billion in working capital movements and one-time items. Apple's earnings quality happens to be exceptional — the gap between net income and operating cash flow is small relative to the scale of the business. As a result, Apple's free cash flow of $98.8 billion (operating cash flow of $111.5 billion minus capital expenditures of $12.7 billion) closely tracks what the income statement shows. That alignment is not a feature of every company.
For businesses where the gap between net income and operating cash flow is wide — driven by large accrual items, aggressive accounting, or non-recurring benefits — the P/E ratio will significantly overstate the true earning power of the business. A company reporting $500 million in net income but generating only $50 million in free cash flow is priced very differently under FCF yield than under P/E. That difference matters for long-term returns.
The other advantage of FCF yield is that it incorporates capital discipline. Two companies can report identical earnings, but if one requires twice the capital expenditure to generate that income, it is a fundamentally worse business. Free cash flow captures that difference naturally. The company that earns the same operating profit but requires less investment to maintain and grow it will have a higher FCF yield at the same market cap — because its actual cash generation is higher. The P/E ratio obscures this distinction entirely. The FCF yield does not.
How to Interpret FCF Yield: The Thresholds That Matter
Not every FCF yield number carries the same implication. The absolute level of the yield matters, and so does the context: the current interest rate environment, the quality of the underlying business, and whether the free cash flow is recurring or episodic.
Above 5% is broadly considered the floor of attractiveness for mature, profitable businesses. A 5% FCF yield means you are paying 20x free cash flow — which historically has been a zone where patient value investors have found durable returns. Companies consistently generating yields above 7% to 8% deserve close examination: the market is either pricing in significant future deterioration, or it has not fully recognized the business's cash generation capability. One of those interpretations represents a potential opportunity. The other is a warning. Distinguishing between them is the analytical work that follows the screen.
Between 3% and 5% is a moderate zone. This range typically reflects established businesses with steady cash generation and no particularly concerning quality concerns. The question at this level is whether the growth trajectory justifies the modest premium over higher-yield alternatives.
Below 2% means you are paying more than 50x free cash flow. At this level, the business must demonstrate significant future growth in free cash flow to justify the price. Companies in this range are not automatically overvalued — a high-quality compounder growing free cash flow at 20% annually may be well worth 50x TTM FCF if that growth proves durable. But the margin for error is thin, and the investor is paying almost entirely for the future rather than the present.
A practical calibration benchmark: compare the FCF yield to the prevailing risk-free rate. When the 10-year Treasury yield sits at a given level, an FCF yield below that level means you are receiving less cash-based return from the equity than from a government bond — and equities carry far more uncertainty. The FCF yield must exceed the risk-free rate by a meaningful margin to compensate for business risk and the uncertainty of future cash flows. When that spread compresses or disappears, the equity is doing little work for the additional risk it carries.
When High FCF Yield Is a Warning Sign, Not a Buy Signal
A standard screener flags stocks above 5% FCF yield as potentially undervalued. But high FCF yield is not automatically a buy signal — three specific situations produce elevated yields that do not reflect genuine value.
The first is the capex cycle trap. Capital-intensive businesses — mining, energy infrastructure, utilities, heavy manufacturing — have lumpy capital expenditure patterns. A company in a low-capex year following a major construction or expansion project will show an elevated FCF yield that does not reflect normalized business economics. Within a few years, maintenance and replacement capex will return, and the true normalized FCF yield is materially lower. The trailing TTM figure does not capture this dynamic. Always examine the capex trend over multiple periods, not a single year in isolation.
The second is the declining business case. A company in secular decline can generate excellent free cash flow precisely because it is harvesting its asset base rather than reinvesting in growth. Capital expenditures fall, working capital liquidates, and the FCF yield rises — even as revenue and competitive position erode. High FCF yield on a declining revenue base is a different investment thesis than high FCF yield on a stable or growing business. Any screening process that treats these two situations identically will surface poor candidates.
The third is the one-time working capital release. Operational changes — extended supplier payment terms, accelerated customer collections, inventory reduction programs — can temporarily inflate operating cash flow without reflecting any durable improvement in the business. These events produce a spike in FCF yield during the period they occur and then normalize in subsequent quarters. If FCF yield is significantly elevated relative to what the earnings picture would suggest for the same period, investigate the working capital movements before assuming the number is sustainable. The cash flow statement shows exactly where that cash came from — and whether it is likely to repeat.
GeminIQ's Visualizations feature lets you chart operating cash flow, net income, and capital expenditures across eight or more quarters for any company. The shape of those three lines over time tells a far more complete story than any single-period yield figure. The ideal FCF yield candidate shows operating cash flow consistently above net income — a signature of high earnings quality — alongside stable or declining capex and a yield that has remained elevated for multiple periods rather than appearing in one anomalous quarter.
Why FCF Yield Numbers Differ Across Platforms
Free cash flow is one of the most definitionally variable metrics in financial analysis, and the differences across platforms can be material — not rounding errors, but multi-percentage-point divergences that lead to fundamentally different conclusions about the same company.
The primary source of disagreement is capex definition. The most precise approach — and the one GeminIQ uses — is to take capital expenditures exactly as reported on the cash flow statement: the cash paid to acquire property, plant, and equipment, as filed under the XBRL tag PaymentsToAcquirePropertyPlantAndEquipment. But aggregators make different choices. Some platforms add capitalized software development costs to the capex figure, which reduces the reported free cash flow for technology companies. Others include content acquisition spending, critical for streaming and media businesses. Some platforms sweep acquisition payments — which appear in the investing section of the cash flow statement alongside organic capex — into the free cash flow calculation. Each of these choices produces a different free cash flow figure, and therefore a different FCF yield.
The second source of variation is market cap timing. Market capitalization changes every trading day. Platforms that use end-of-period market cap will show a different FCF yield than platforms using the current price. For a company whose stock has moved significantly since its last filing date, the FCF yield on two platforms can differ by several full percentage points — not because the underlying data is wrong, but because the price reference point is different.
This is precisely the problem that makes aggregated financial data unreliable as a consistent screening foundation. When one financial website shows a 6.2% FCF yield and a different platform shows 5.1% for the same company in the same period, those are not errors — they are different definitional choices, none of which are labeled as such. You cannot compare companies meaningfully if the metric definition shifts beneath you from one ticker to the next. GeminIQ's Calculated Metrics apply a consistent methodology across every company in the database, drawn directly from as-filed SEC EDGAR data. The definition does not change. That consistency is what makes a screener built on FCF yield actually reliable for cross-company comparison — and why the number you screen on in GeminIQ is the same number that went into the filing. For a deeper look at how aggregator normalization choices distort financial data, see Third-Party Financial Data: What Gets Lost When the Data Is Processed.
How to Find High FCF Yield Stocks Using GeminIQ
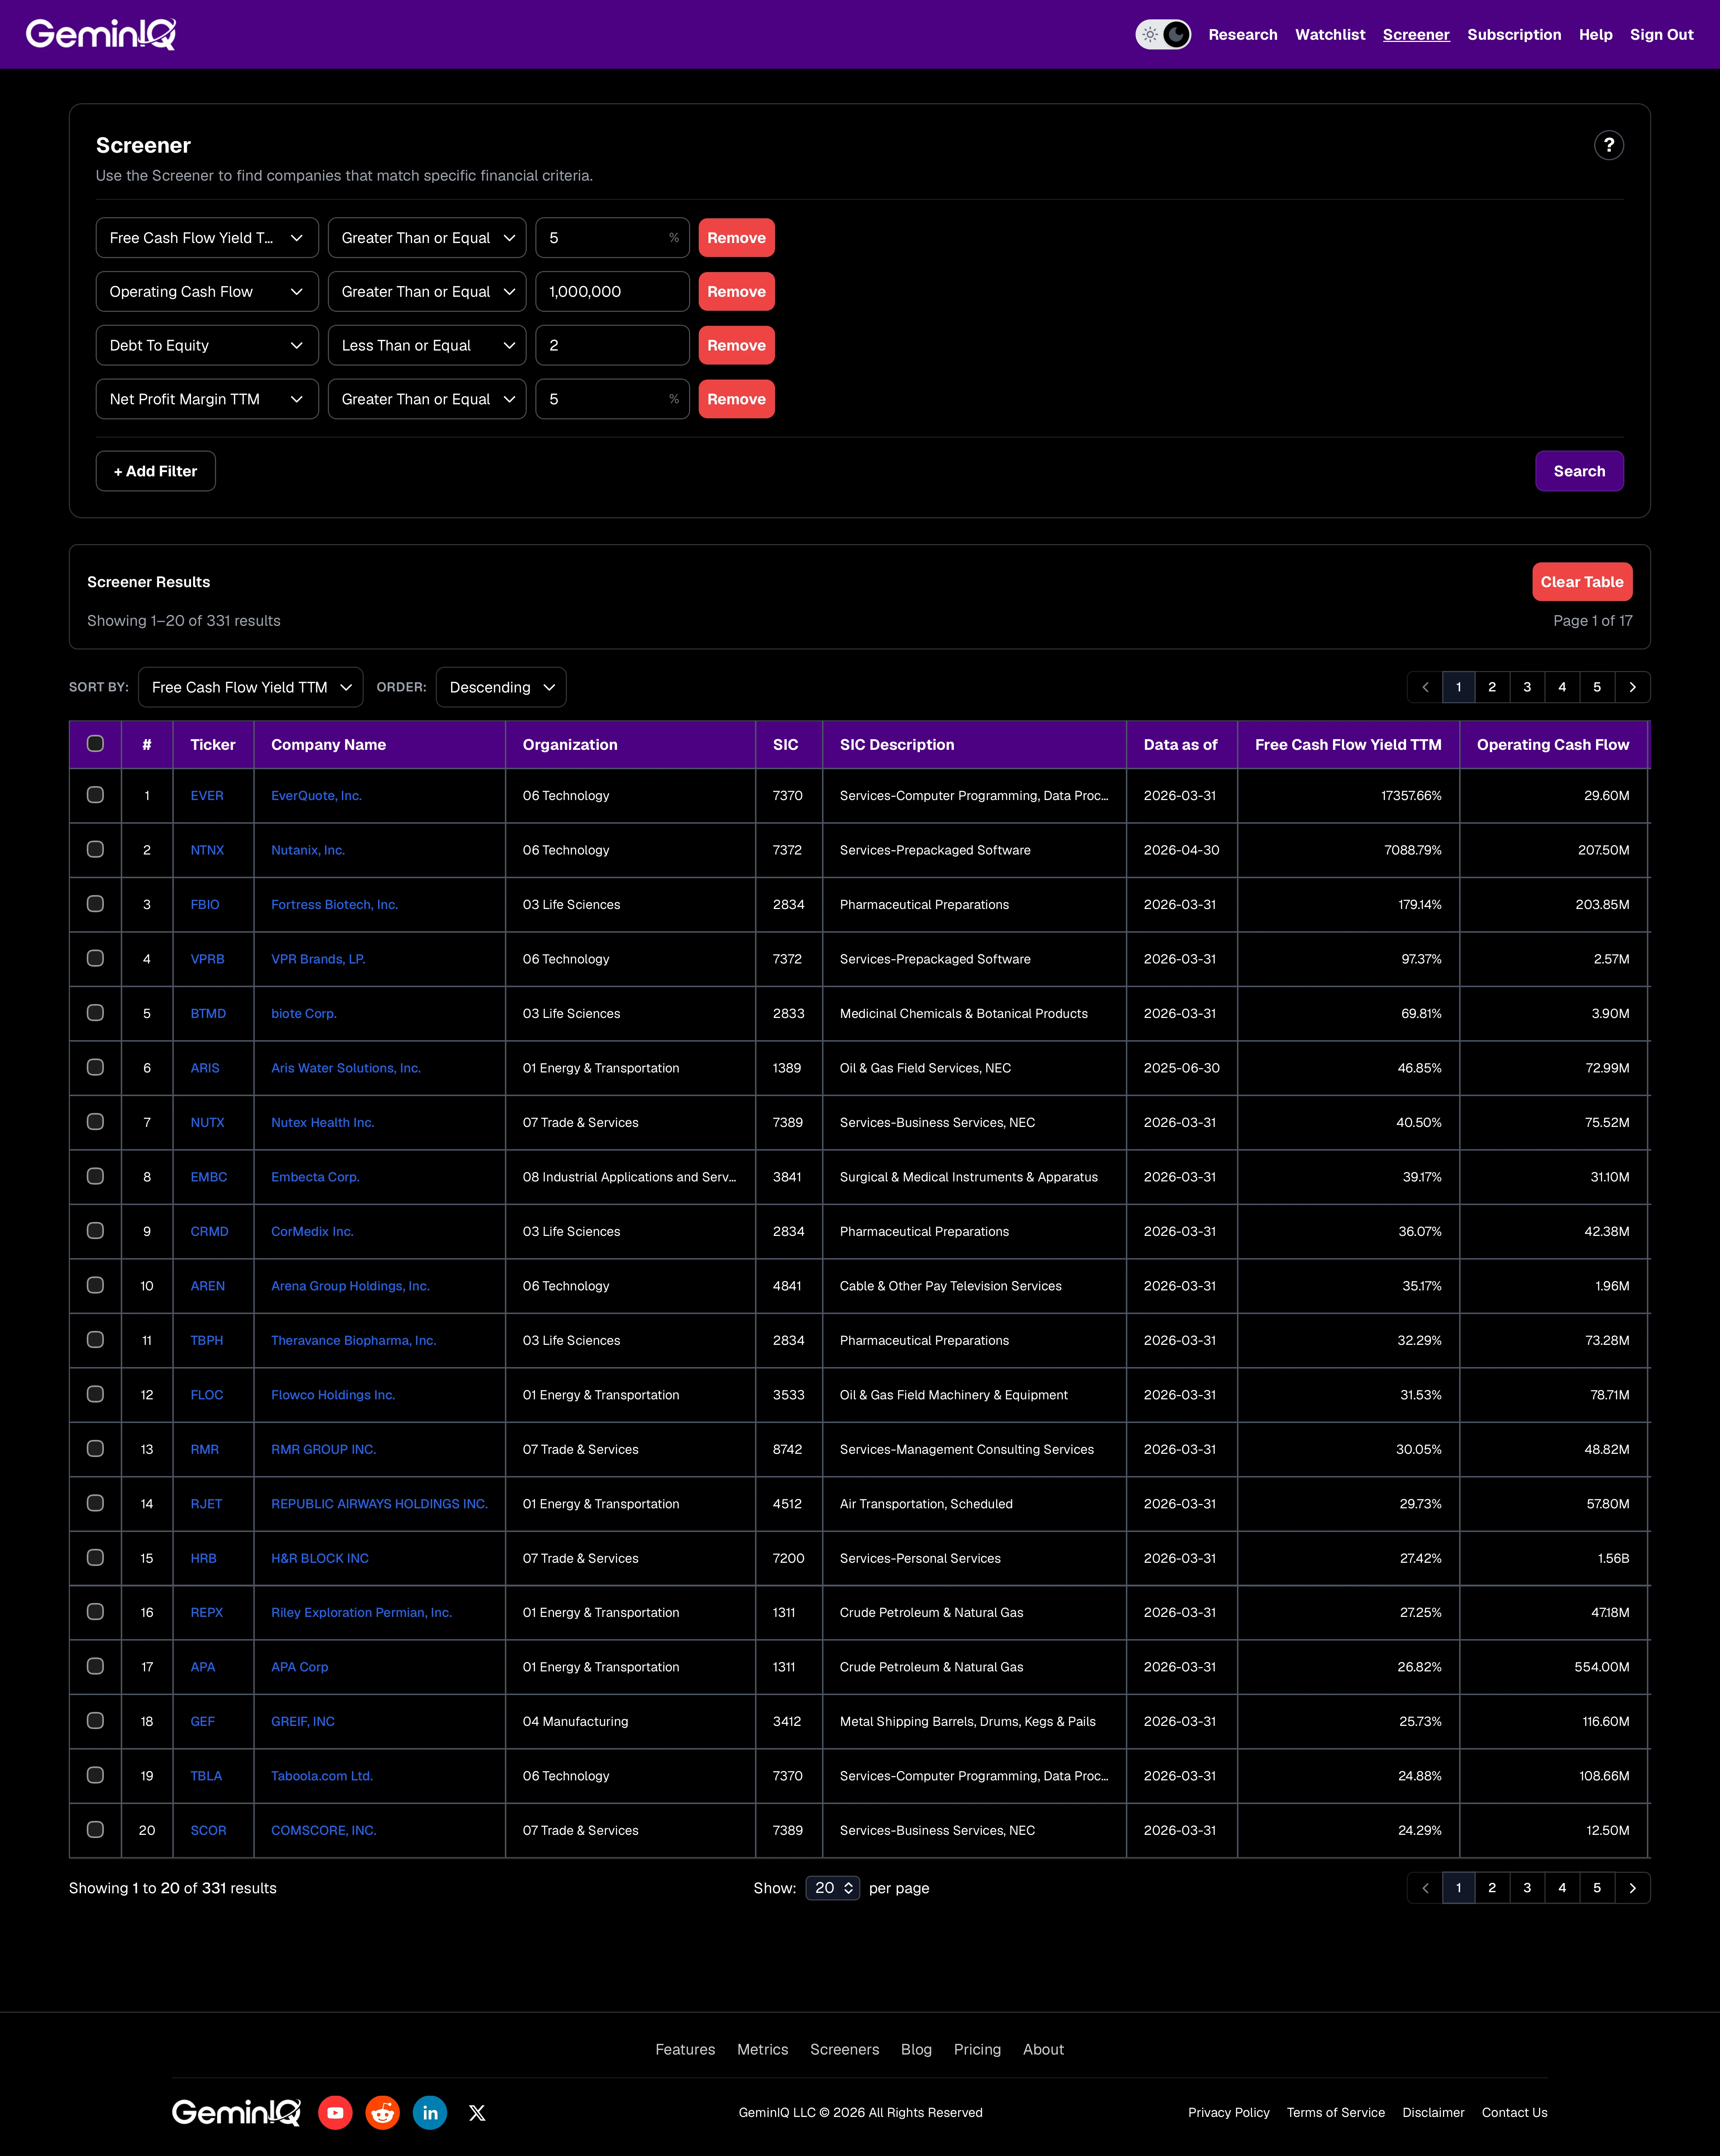
The High Free Cash Flow Yield Screener on GeminIQ is built around four filters that, in combination, identify businesses with genuine cash generation relative to their market price — while removing the false signals described above.
The core filter is Free Cash Flow Yield TTM ≥ 5%. This sets the floor: the company must generate at least five cents of free cash for every dollar of market capitalization on a trailing twelve-month basis. The 5% threshold has long served as a practical reference point for value-oriented investors because it sits meaningfully above typical risk-free alternatives and signals a business not excessively priced relative to its actual cash production.
The second filter — operating cash flow ≥ $1 million — ensures the free cash flow is grounded in real operating activity. Without this guard, companies with negative operating cash flow but reduced capital expenditures can appear above the FCF yield threshold on paper. The operating cash floor eliminates that distortion.
The third filter — Debt To Equity ≤ 2.0 — removes companies where the high FCF yield is real but where debt service claims a significant portion of that cash before it reaches shareholders. A heavily leveraged company generating strong free cash flow is generating it primarily for creditors. The leverage filter narrows the universe to companies where more of the free cash flow is genuinely available to equity holders.
The optional fourth filter — Net Profit Margin TTM ≥ 5% — adds a quality layer that most basic screeners omit entirely. Companies with high FCF yield but very low net margins often achieve that yield through heavy depreciation against thin earnings — the signature of a capital-intensive business where accounting depreciation understates true economic asset consumption. When a business combines strong FCF yield with strong net margins simultaneously, the probability that the cash generation is both real and durable increases substantially.
Sort the results by Free Cash Flow Yield TTM descending — highest cash yield first — then move from the screener to the filing. Open each candidate in GeminIQ's Financial Statements view and pull the operating activities section of the cash flow statement. Verify that operating cash flow consistently exceeds net income across multiple periods. That relationship — when stable over time — is one of the most reliable signals of accounting quality available in fundamental analysis. A one-period spike in FCF yield requires explanation. A multi-year pattern of strong FCF yield from a business with stable or growing revenue and disciplined capex is a different category of evidence entirely, and it is the pattern that the screener is designed to surface.
Related Reading
- Return on Invested Capital (ROIC) Explained — ROIC measures the quality of capital deployment; FCF yield measures the cash price of that deployment. Together they are the two most powerful lenses for identifying genuinely exceptional businesses at reasonable prices.
- Magic Formula Investing Explained — Joel Greenblatt's framework uses earnings yield (EBIT/EV) rather than FCF yield for its valuation component, but the underlying logic — buying quality businesses at cheap prices — is the same. Understanding both approaches clarifies when each is the more appropriate tool.
- What Investors Miss in SEC Filings — the cash flow adjustments that bridge net income and operating cash flow are hiding in plain sight in every 10-K and 10-Q. Reading them correctly is how you verify whether a high FCF yield is real or manufactured.
- Third-Party Financial Data: What Gets Lost When the Data Is Processed — how aggregator capex definitions and market cap timing produce FCF yield figures that appear comparable but are not.
- Value Investing Glossary: Terms, Ratios, and Mental Models Defined — full definitions of FCF yield, earnings yield, P/E, ROIC, and every other ratio referenced in this post.
Research Faster. Invest Smarter.
Most financial websites rely on third-party aggregators that simplify or process data before you ever see it. We built GeminIQ because we believe you deserve a better fundamental analysis tool—one that goes beyond basic price charts and processed numbers. We extract our data directly from SEC 10-K and 10-Q filings to ensure that when you look at a balance sheet or a cash flow statement, you are seeing the numbers exactly how the company reported them. Our goal is to give you the tools to verify the narrative for yourself using clean, traceable data. Start researching now at GeminIQ.com.
Disclaimer: The content in this blog is for educational and entertainment purposes only and does not constitute financial, legal, or tax advice. Investing involves risk, including the loss of principal. The views expressed are my own and not intended as financial advice or a guarantee of future performance.