EV/EBITDA vs. P/E: Which Valuation Multiple Should You Use?
By Chad Hartman
Published June 14, 2026 · Last updated June 14, 2026
P/E is the ratio that every financial headline quotes, every brokerage app displays by default, and every new investor learns first. EV/EBITDA is the multiple that private equity firms, M&A advisors, and institutional analysts reach for when they are actually trying to determine whether a business is cheap. Both ratios answer the same surface-level question — what am I paying relative to what this company earns? — but they answer it from completely different starting points, and the difference matters far more than most investors realize. Understanding what each multiple actually measures, where each one misleads, and which to reach for in a given situation is one of the more practical upgrades a fundamental investor can make.
What P/E Actually Measures — and Where It Breaks
The price-to-earnings ratio is deceptively simple: divide the company's market capitalization by its trailing twelve-month net income, and you have the number of dollars investors are paying for each dollar of annual earnings. A P/E of 20x means investors are paying $20 for every $1 of net income — an implicit earnings yield of 5%. The S&P 500 has historically traded in the 15x–18x range; growth stocks routinely command 30x–50x or higher. The ratio is intuitive, and for a company with a clean capital structure and stable earnings, it is a reasonable quick filter.
The problem is not the price side. The problem is the earnings side — specifically, what net income is and what it leaves out. Net income is calculated after interest expense, after taxes, and after depreciation and amortization. Each of those deductions is sensitive to choices that have nothing to do with how well the underlying business operates.
Consider two businesses with identical operations: each generates $100 million of operating profit per year from the same asset base. Company A is financed entirely with equity. Company B carries $500 million of debt at a 5% interest rate, costing it $25 million per year in interest expense. After a 25% effective tax rate, Company A reports net income of $75 million. Company B reports $56 million. If both trade at the same market capitalization of $1.5 billion, Company A shows a P/E of 20x and Company B shows a P/E of roughly 27x — making Company B look significantly more expensive despite having operationally identical earnings power. The entire difference is capital structure. The underlying business is the same.
This is the capital structure blindspot that standard financial media does not flag. A P/E comparison between two companies in the same sector can be entirely misleading if their debt loads differ — which, in telecommunications, energy, real estate, and media, they routinely do. But standard financial media doesn't read the footnotes.
Tax rates introduce a second distortion. A company with a 21% effective tax rate reports different net income than an identical operation paying 28%, even though operating performance is identical. For cross-border comparisons — European versus US companies in the same industry — P/E becomes nearly useless as a relative valuation tool. And non-recurring items are the third distortion: a large restructuring charge, an asset impairment, or a one-time gain from a property sale can swing net income dramatically in a single period, producing a P/E that bears no relationship to normalized earning power. A company absorbing a $500 million write-down in one year will show an astronomical P/E; after the charge rolls off the TTM window, the ratio reverts to normal. The headline number gets quoted regardless.
What Enterprise Value Changes About the Equation
Enterprise value is the cleaner numerator. It is the theoretical total acquisition price for the business: market capitalization plus total debt minus cash and cash equivalents. The formula captures what a buyer would actually pay — you acquire the equity, you assume the debt, and you gain access to the cash. It is capital-structure-aware by construction.
GeminIQ's Enterprise Value is built directly from as-filed balance sheet data: market cap using period-end price and basic shares, plus short-term and long-term debt as reported, minus cash and cash equivalents as reported. Every input is traceable to the XBRL-tagged filing.
The EV framework dissolves the capital structure comparison problem. Return to Company A and Company B. If Company A has a market cap of $1.5 billion and no debt, its EV is $1.5 billion. If Company B carries the same $1.5 billion market cap but $500 million in debt, its EV is roughly $2 billion. Now compare both against their operating earnings — before the interest and tax decisions that distort net income — and the picture changes. The market cap said both were priced identically. The enterprise value reveals that Company B costs significantly more per dollar of underlying operating output.
This is why an acquirer always thinks in enterprise value. When one company buys another, the buyer assumes the target's debt. The market cap is not the full check being written.
How EV/EBITDA Corrects for Capital Structure
EV/EBITDA pairs enterprise value with EBITDA — earnings before interest, taxes, depreciation, and amortization — to create a multiple that is capital-structure-neutral, tax-neutral, and largely accounting-method-neutral. The denominator removes the three sources of net income distortion described above: interest (capital structure), taxes (jurisdiction), and D&A (depreciation method and acquisition history).
A company with $200 million of EBITDA trading at $2 billion of enterprise value has a multiple of 10x. A private equity firm evaluating that business knows it is paying ten years of pre-investment operating cash flow for the business as it stands. Whether the company is financed with equity or debt, headquartered in Texas or Frankfurt, whether it built its asset base organically or through a decade of acquisitions — the EV/EBITDA multiple provides a consistent comparison benchmark.
GeminIQ's EV/EBITDA TTM is derived directly from SEC filing data — EBITDA taken from the filing or calculated as EBIT plus depreciation and amortization as reported, without adjustments for stock-based compensation, restructuring charges, or other items that platforms commonly strip out. Aggregators that report "adjusted EBITDA" can produce materially different multiples for the same company in the same period. A business with $800 million of GAAP EBITDA and $1.2 billion of adjusted EBITDA looks very different at the same enterprise value depending on which denominator your platform uses. GeminIQ uses the as-filed number. The multiple you see reflects what the company actually reported.
The ratio became standard in leveraged buyout analysis during the 1980s and remains the primary valuation tool in institutional M&A and private equity. The S&P 500 median EV/EBITDA has historically traded in the 12x–14x range. Private equity firms typically target acquisitions in the 6x–10x range, with below 8x generally considered value territory and above 15x requiring a compelling growth or quality argument to justify.
The Capex Problem — When EV/EBITDA Misleads Too
Warren Buffett has asked, in substance, whether management believes the tooth fairy pays for capital expenditures. The point was directed at EBITDA specifically. The "DA" added back — depreciation and amortization — is treated as a non-cash accounting entry, but for businesses with significant physical assets, depreciation is not arbitrary. It approximates the real, recurring cost of replacing or maintaining the asset base that makes the business run.
For a software company or a consumer brand, this distinction barely matters. Software requires minimal physical reinvestment; maintenance capex might represent 5%–10% of EBITDA. But for an airline carrying tens of billions of dollars of aircraft, a telecom operator maintaining thousands of miles of physical network, or an energy company running refining capacity, the D&A added back in the denominator represents genuine future cash expenditures the business cannot avoid. A company generating $3 billion of EBITDA with $2 billion of annual maintenance capex has very different economic earning power than a software company generating the same $3 billion of EBITDA with $150 million of capex. At the same EV/EBITDA multiple, the capital-intensive business is substantially more expensive on any cash-based measure.
This is the capex trap. EV/EBITDA adds D&A back and never returns to it. The multiple works well for asset-light businesses where capital expenditure is genuinely minimal relative to earnings. It misleads significantly for capital-intensive businesses — it makes expensive operations appear cheap.
The practical cross-check: compare EV/EBITDA against GeminIQ's pre-calculated Free Cash Flow Yield TTM. A company with a low EV/EBITDA and a high FCF yield is one where EBITDA and free cash flow are reasonably aligned — depreciation is not concealing significant real capital requirements. A company with a low EV/EBITDA and a low FCF yield is one where the multiple is flattering a capex-heavy business. For a full treatment of FCF yield as a valuation lens, see Free Cash Flow Yield Explained. That gap between the two signals is the information EV/EBITDA alone cannot show you.
EV/EBIT: The More Conservative Alternative
EV/EBIT uses the same enterprise value numerator but does not add back depreciation and amortization in the denominator. Because EBIT deducts D&A, it produces a more conservative — and for capital-intensive companies, more honest — measure of operating earnings.
GeminIQ's EV/EBIT TTM is derived from TTM EBIT as filed or calculated as net income plus income tax plus interest expense. For any given company, EV/EBIT will always be higher than EV/EBITDA because EBIT is a smaller number — D&A remains in the denominator rather than being added back. The gap between the two multiples is itself informative: a company where EV/EBIT is 12x and EV/EBITDA is 11.5x has very low depreciation relative to EBITDA — a light-asset business where the add-back is genuinely modest. A company where EV/EBIT is 14x and EV/EBITDA is 7x carries very high D&A relative to its earnings — a capital-intensive or heavily acquisitive business where EV/EBITDA significantly overstates true earning power.
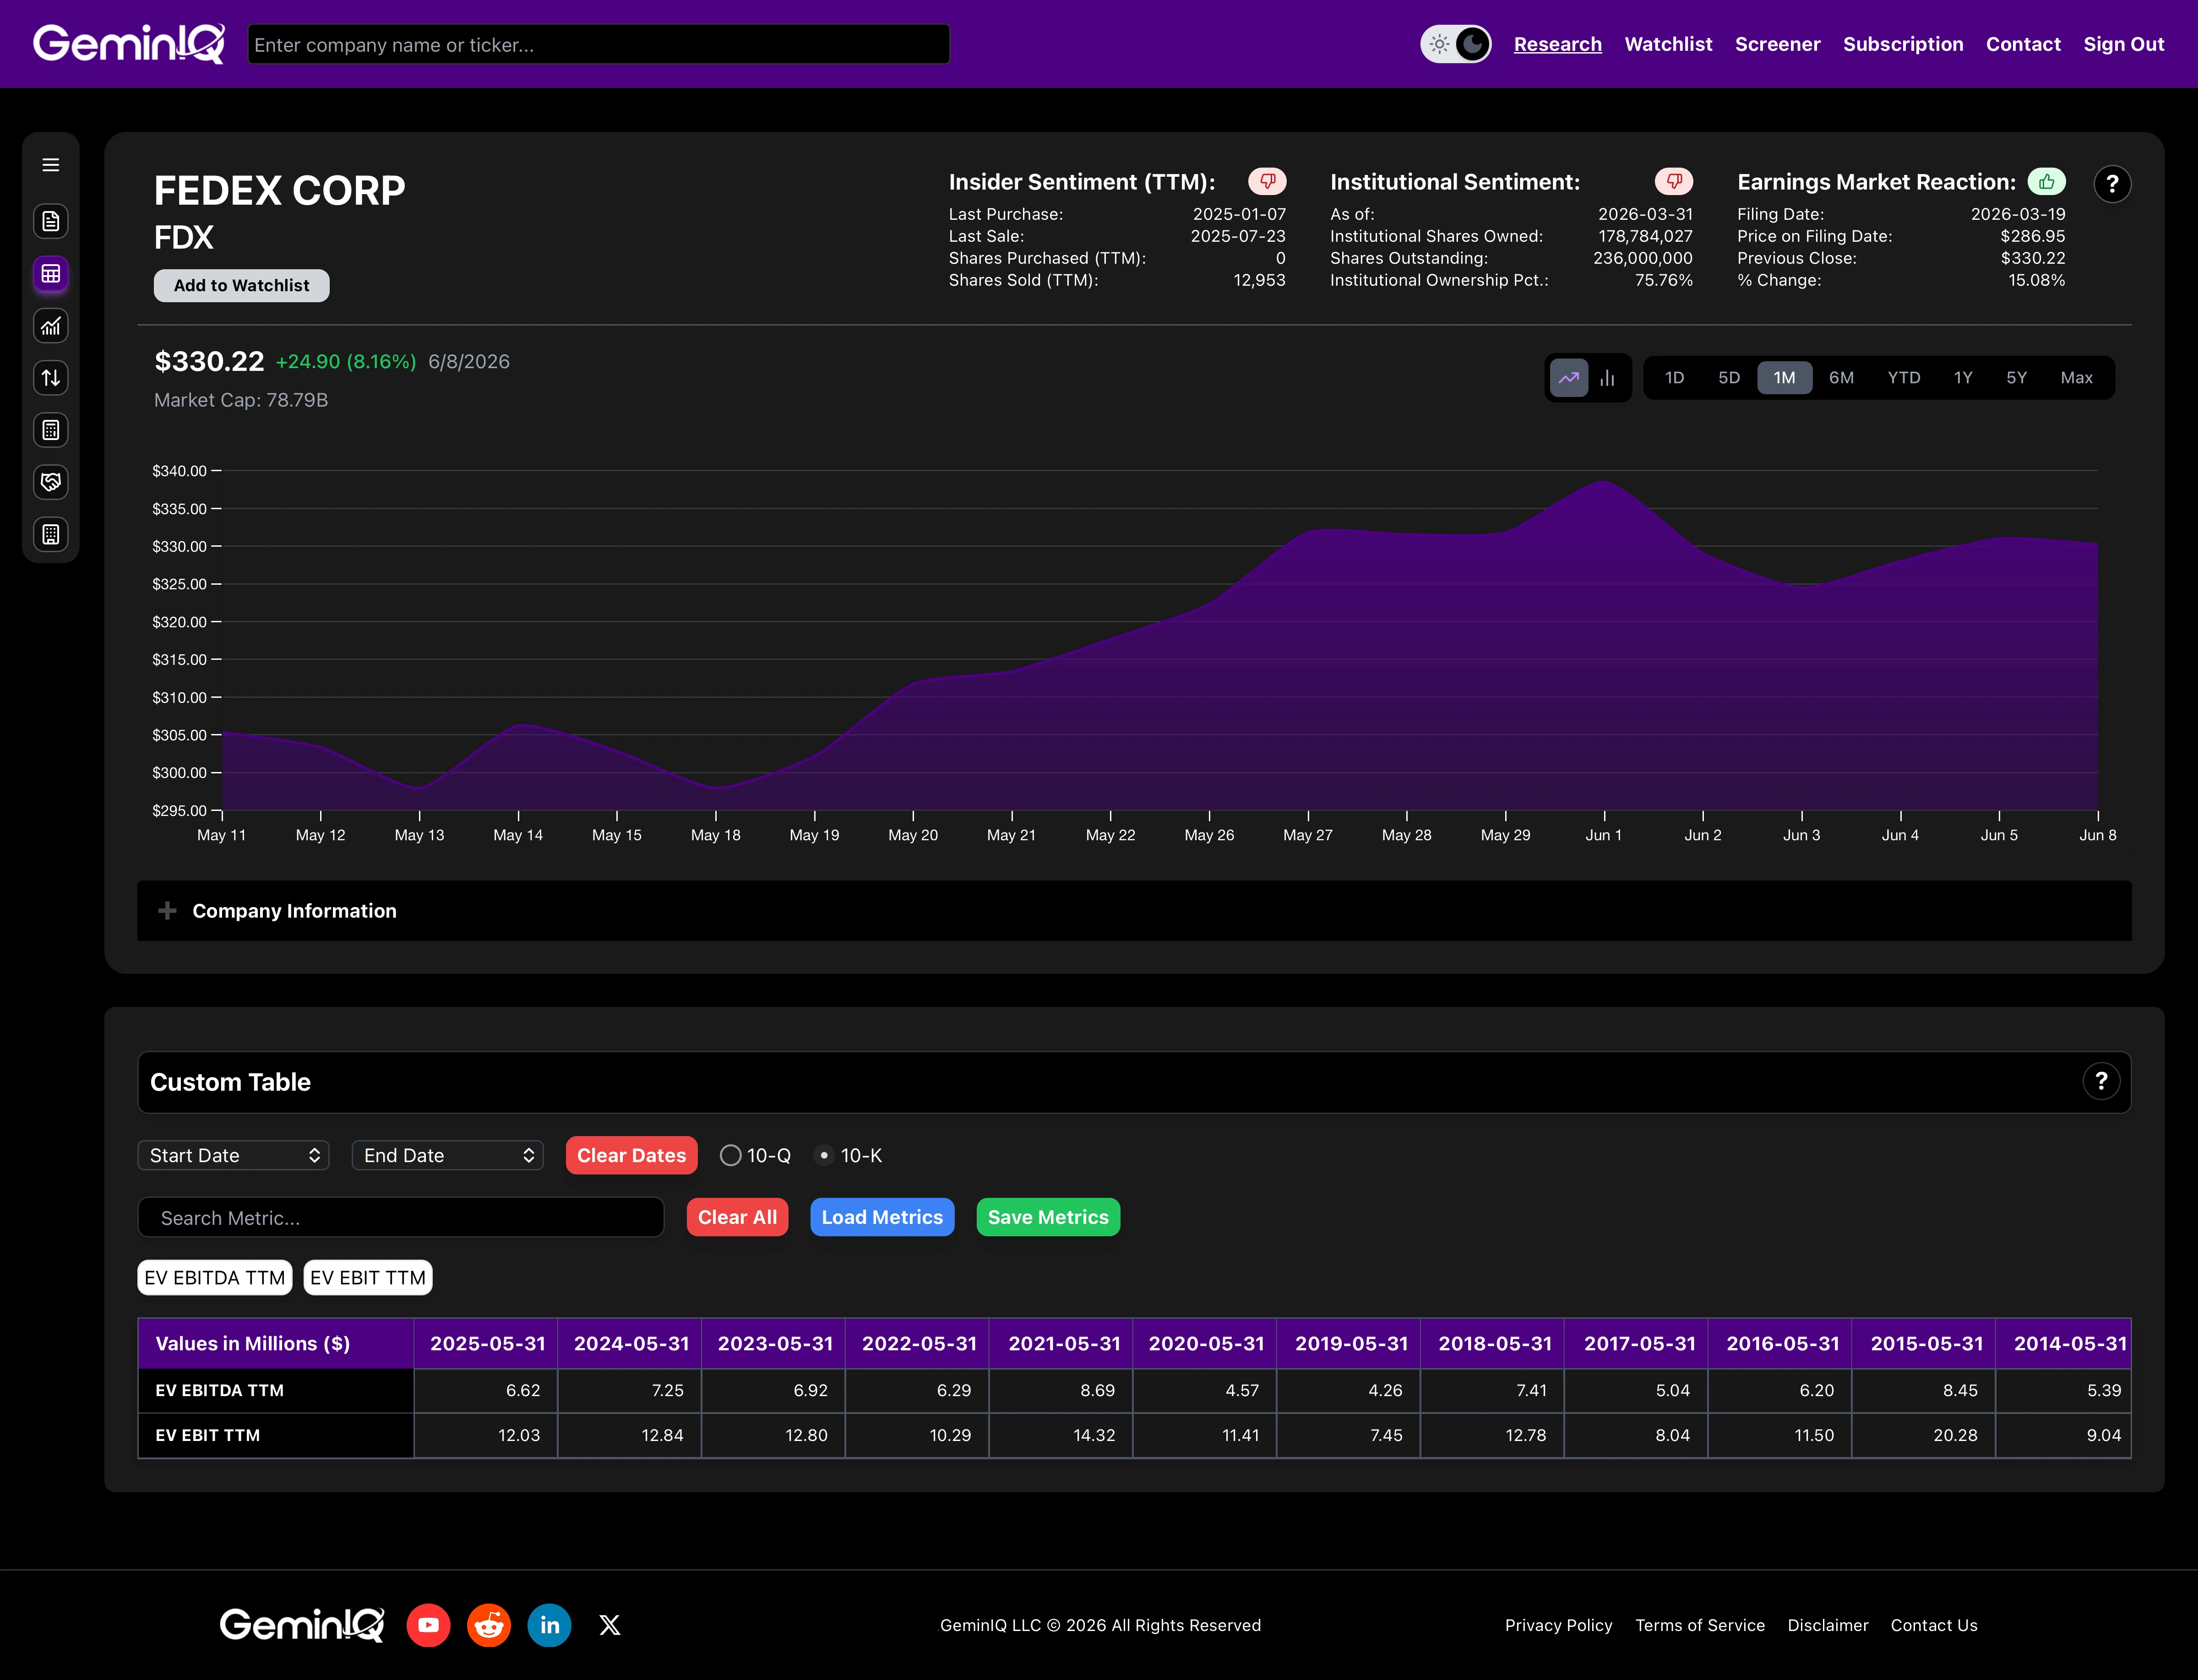
FedEx Corp (FDX) is a direct example of this dynamic. Pulling GeminIQ's EV EBITDA TTM and EV EBIT TTM directly from the Custom Table for FedEx's most recently filed 10-K (FY2025, period ending 2025-05-31) shows an EV/EBITDA of 6.62x and an EV/EBIT of 12.03x — a gap of nearly 2x. On an EV/EBITDA screen alone, FedEx appears modestly priced. EV/EBIT surfaces the reality: a substantial share of that apparent EBITDA is depreciation on one of the world's largest commercial aircraft fleets, truck networks, and logistics sorting facilities. The two multiples are telling materially different stories about the same business.
Joel Greenblatt's Magic Formula uses EBIT/EV — the inverse of EV/EBIT, expressed as an earnings yield — as its valuation component precisely because it normalizes for capital structure while keeping depreciation in the denominator. Greenblatt argues this is the most honest single number for comparing the cheapness of different businesses across sectors. For the full treatment of how the Magic Formula uses earnings yield alongside return on invested capital, see Magic Formula Investing Explained.
GeminIQ's High Earnings Yield Screener runs on EV/EBIT below 10x — a starting pool of businesses generating operating earnings at a rate substantially above their enterprise cost.
Which Multiple to Use and When
No single multiple covers every situation. The choice depends on the type of business, the comparison being made, and which distortion is most likely to mislead.
For highly leveraged companies — where debt service consumes a large share of operating income — P/E is structurally unreliable. Interest expense directly inflates or deflates net income depending on the outstanding balance and prevailing rate, and the equity P/E gives no information about the cost relative to the whole business. EV/EBITDA or EV/EBIT is the appropriate lens.
For capital-intensive companies — airlines, telecom operators, manufacturers, energy producers — EV/EBITDA flatters by adding back depreciation that approximates real economic cost. EV/EBIT is the more conservative screen, and FCF yield is the most direct test of cash generation after capex is accounted for.
For asset-light businesses with minimal physical investment — software companies, consumer platforms, professional services firms — EV/EBITDA works well because D&A is genuinely small relative to earnings. In these businesses, EV/EBITDA and EV/EBIT will be close to each other, which is itself the confirmation that the add-back is not masking capex intensity.
For cross-border comparisons where tax rates differ materially, P/E comparisons are unreliable. EV/EBITDA neutralizes the tax variable entirely.
For loss-making companies, both P/E and EV/EBITDA break down — negative earnings produce meaningless multiples. Price-to-sales or EV/Revenue becomes the relevant anchor, supplemented by cash burn analysis.
Within a single sector where companies share similar capital structures and effective tax rates, P/E is a reasonable quick filter — but a starting point, not a conclusion. The moment leverage, depreciation policies, or tax rates diverge between the companies being compared, the P/E comparison stops being informative and EV/EBITDA takes over.
GeminIQ's Low EV/EBITDA Screener runs on EV/EBITDA below 8x with positive EBITDA — a capital-structure-neutral value starting pool. Pairing it with a FCF yield overlay isolates companies where the low multiple reflects genuine cash generation rather than depreciation-heavy add-backs. For the quality dimension, Return on Invested Capital is the natural companion — a business with a low EV/EBITDA, a high FCF yield, and a high ROIC is the combination that value screens are built to surface.
Why the Data Behind the Multiple Matters
EV/EBITDA and P/E are formulas. The outputs are only as reliable as the inputs, and the inputs vary significantly depending on how and where they are sourced.
Enterprise value depends on how debt is defined. Does a platform include operating lease liabilities — which have appeared on the balance sheet since ASC 842 took effect in 2019 — in its debt figure? A large retailer with $3 billion of operating lease liabilities will show materially different enterprise values depending on whether those leases are included. A company with $2 billion of operating lease liabilities and $500 million of pension obligations can show EV/EBITDA of 6.5x on one platform and 9.0x on another based entirely on what each platform includes in enterprise value. GeminIQ constructs enterprise value from as-filed balance sheet components — short-term debt, long-term debt, and cash and equivalents as reported — with full visibility into each input.
EBITDA depends on whether a platform uses the GAAP-derived figure or an adjusted version. A company reporting $800 million of GAAP EBITDA alongside $1.2 billion of adjusted EBITDA — a gap driven by stock-based compensation and restructuring charges added back — looks very different on each basis. GeminIQ's EBITDA is derived from as-filed operating income plus as-filed depreciation and amortization. No adjustments. The number reflects what the company actually reported under GAAP.
P/E depends on share count methodology. GeminIQ uses period-end basic shares and TTM net income from the filing. Platforms using diluted share counts or forward consensus estimates produce different multiples for the same company in the same period.
These are not edge cases or rounding differences. A standard screener shows you a number labeled EV/EBITDA without disclosing how it was built. GeminIQ's Calculated Metrics view exposes every component so the inputs are visible and verifiable, and the underlying Financial Statements pull directly from XBRL-tagged SEC filings — the same source document the company filed. The metric tells the story. The filing confirms it.
Research Faster. Invest Smarter.
Most financial websites rely on third-party aggregators that simplify or process data before you ever see it. We built GeminIQ because we believe you deserve a better fundamental analysis tool—one that goes beyond basic price charts and processed numbers. We extract our data directly from SEC 10-K and 10-Q filings to ensure that when you look at a balance sheet or a cash flow statement, you are seeing the numbers exactly how the company reported them. Our goal is to give you the tools to verify the narrative for yourself using clean, traceable data. Start researching now at GeminIQ.com.
Disclaimer: The content in this blog is for educational and entertainment purposes only and does not constitute financial, legal, or tax advice. Investing involves risk, including the loss of principal. The views expressed are my own and not intended as financial advice or a guarantee of future performance.