
Free Cash Flow Inflection: The Quarter It Turns Positive

By Chad Hartman
Published · Last updated
Crossings where Free Cash Flow (TTM) stayed positive through the following four quarters were followed by a median three-month return of +4.11%, against a universe base rate of +2.36%. Crossings that relapsed back negative within four quarters returned a median of +0.00%.
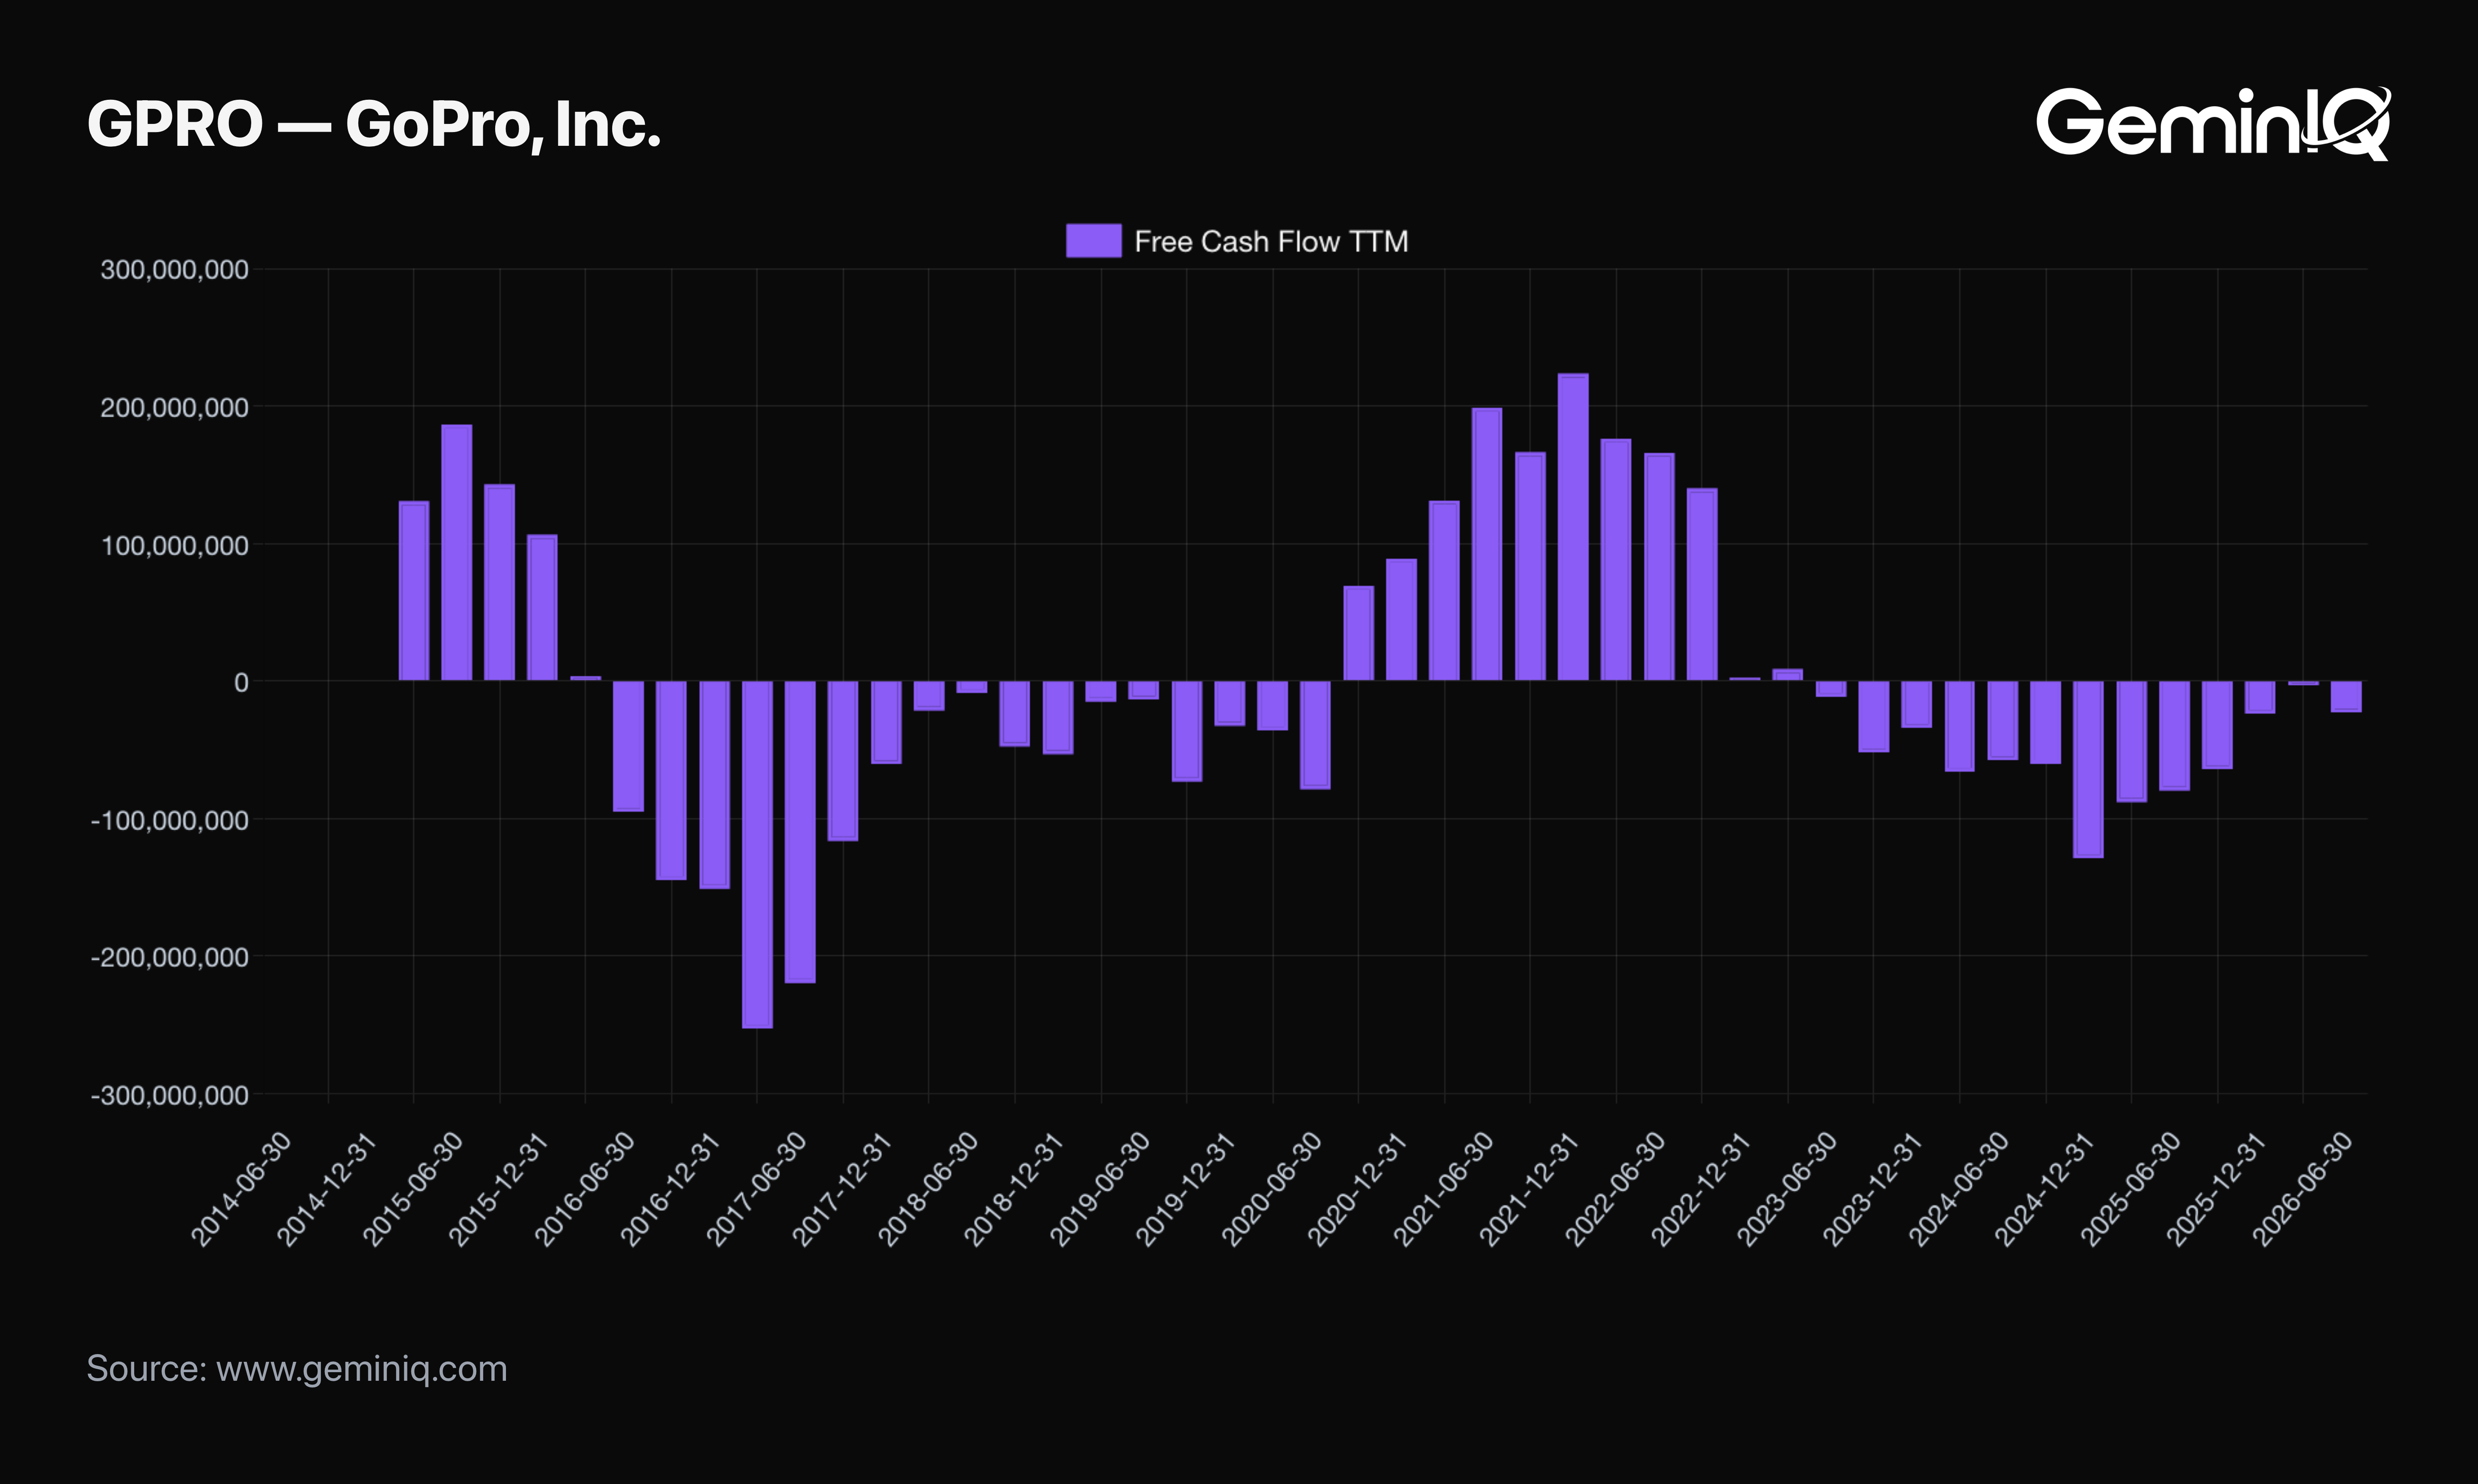
GoPro spent 17 straight quarters posting negative trailing-twelve-month Free Cash Flow before that figure finally crossed positive in the third quarter of 2020 — and the stock moved 33.08% over the next three months. That is a good story on its own. It is also, by itself, worthless, because the question a "first positive FCF quarter" study actually has to answer isn't whether the market reacted. It's whether the reaction meant anything once the next four quarters played out.
This is a Filing Data Study built from GeminIQ's as-filed 10-K and 10-Q pipeline. It scanned 15,067 companies for each one's first-ever crossing from negative to positive Free Cash Flow (TTM), excluded financial-sector issuers, and found 4,491 crossings filed between March 2010 and June 2026. Of those, 2,076 carry both a resolved four-quarter fundamentals outcome and a three-month post-filing return, and that subset is what the buckets below are built from.
Why One Positive Quarter Isn't the Finding
A single crossing quarter tells you almost nothing on its own. Some companies flip positive because the underlying business turned a real corner — margins expanded, a cost program landed, growth caught up to fixed costs. Others flip positive because a working-capital swing, an asset sale, or a light capex quarter flattered the number for one period before reality reasserted itself. Both look identical on the day of the filing. The only way to tell them apart from the outside is to wait and see whether the positive reading held.
So this study splits every crossing into two outcomes measured four quarters later: did Free Cash Flow (TTM) stay positive, or did it dip back negative at least once. That single follow-up check turns out to carry real information about how the market treated the crossing at the time it happened — not because the market can see four quarters into the future, but because a crossing built on something durable tends to look different, even in month one, from a crossing built on a one-time item that both the company and attentive investors can already sense won't repeat.
The mirror case is worth keeping in mind while reading this: Tesla's Q2 2026 quarter, which crossed the same line in the opposite direction. A company sliding into negative Free Cash Flow (TTM) raises the identical question this study asks about a company climbing out of it — was the quarter that moved the number a genuine shift, or a one-time item working against the trend instead of for it.
Held vs. Relapsed: Three-Month Returns After the Crossing
The split is clean. Crossings that held Free Cash Flow (TTM) positive through the following four quarters were followed by a median three-month return of +4.11% — 1.75 points above the universe base rate of +2.36% established across 76,908 filings in GeminIQ's revenue growth slowdown study. Crossings that relapsed back negative within four quarters were followed by a median of +0.00%, a full 2.36 points below that same base rate.
| Outcome | Filings (N) | Median 3-Mo Return | vs. Base Rate | Share Positive |
|---|---|---|---|---|
| Held past 4 quarters | 1,092 | +4.11% | +1.75 pts | 59.4% |
| Relapsed within 4 quarters | 984 | +0.00% | -2.36 pts | 46.5% |
Both buckets clear the 200-filing floor by a wide margin. The share-positive column is the more honest read of the two: 59.4% of filings in the held bucket posted a positive three-month return, against just 46.5% in the relapsed bucket — the only one of the two buckets to fall below a coin flip.
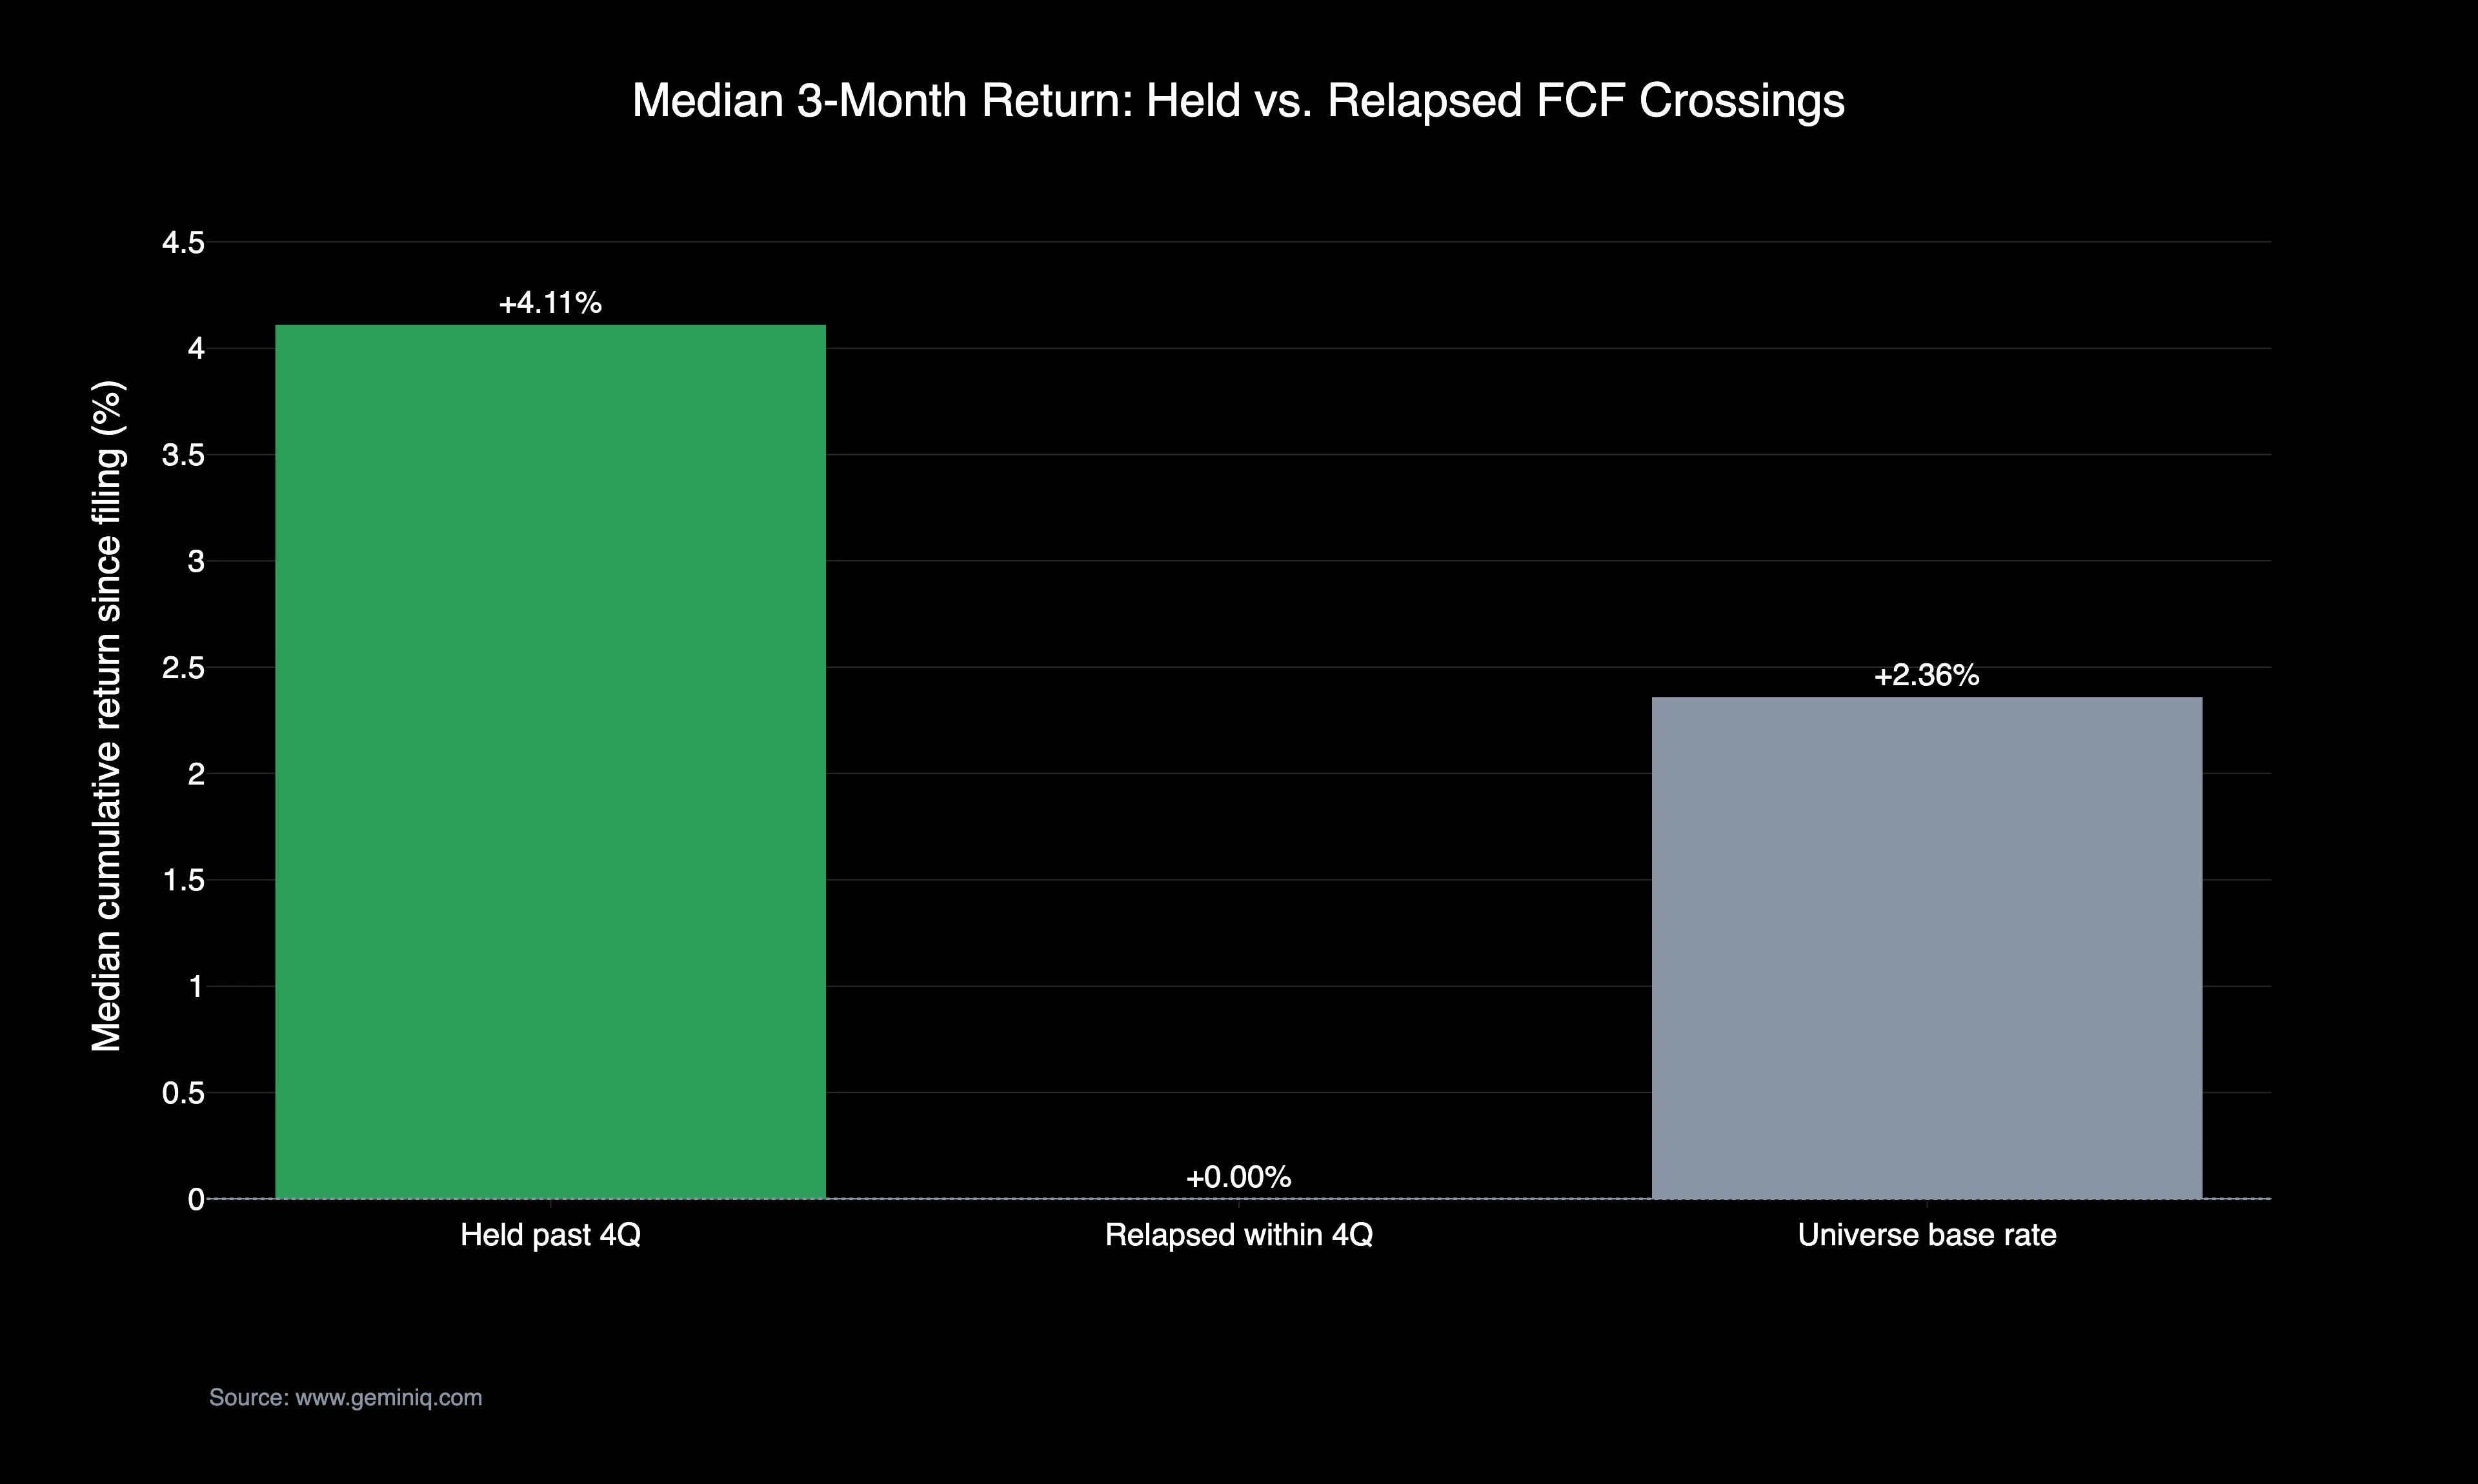
The mean tells a stranger story, and it's worth showing why the median is doing the real work here. The raw mean three-month return in the relapsed bucket is +484.98% — a number driven entirely by a handful of penny-stock and micro-cap filings that happened to rip higher for reasons that had nothing to do with their cash flow statement. Winsorized at the top and bottom 1%, that mean collapses to +6.72%, still well above the median of +0.00%. When the mean and the median disagree by that much even after trimming outliers, the median — not the mean — is the number that describes what happened to the typical filing.
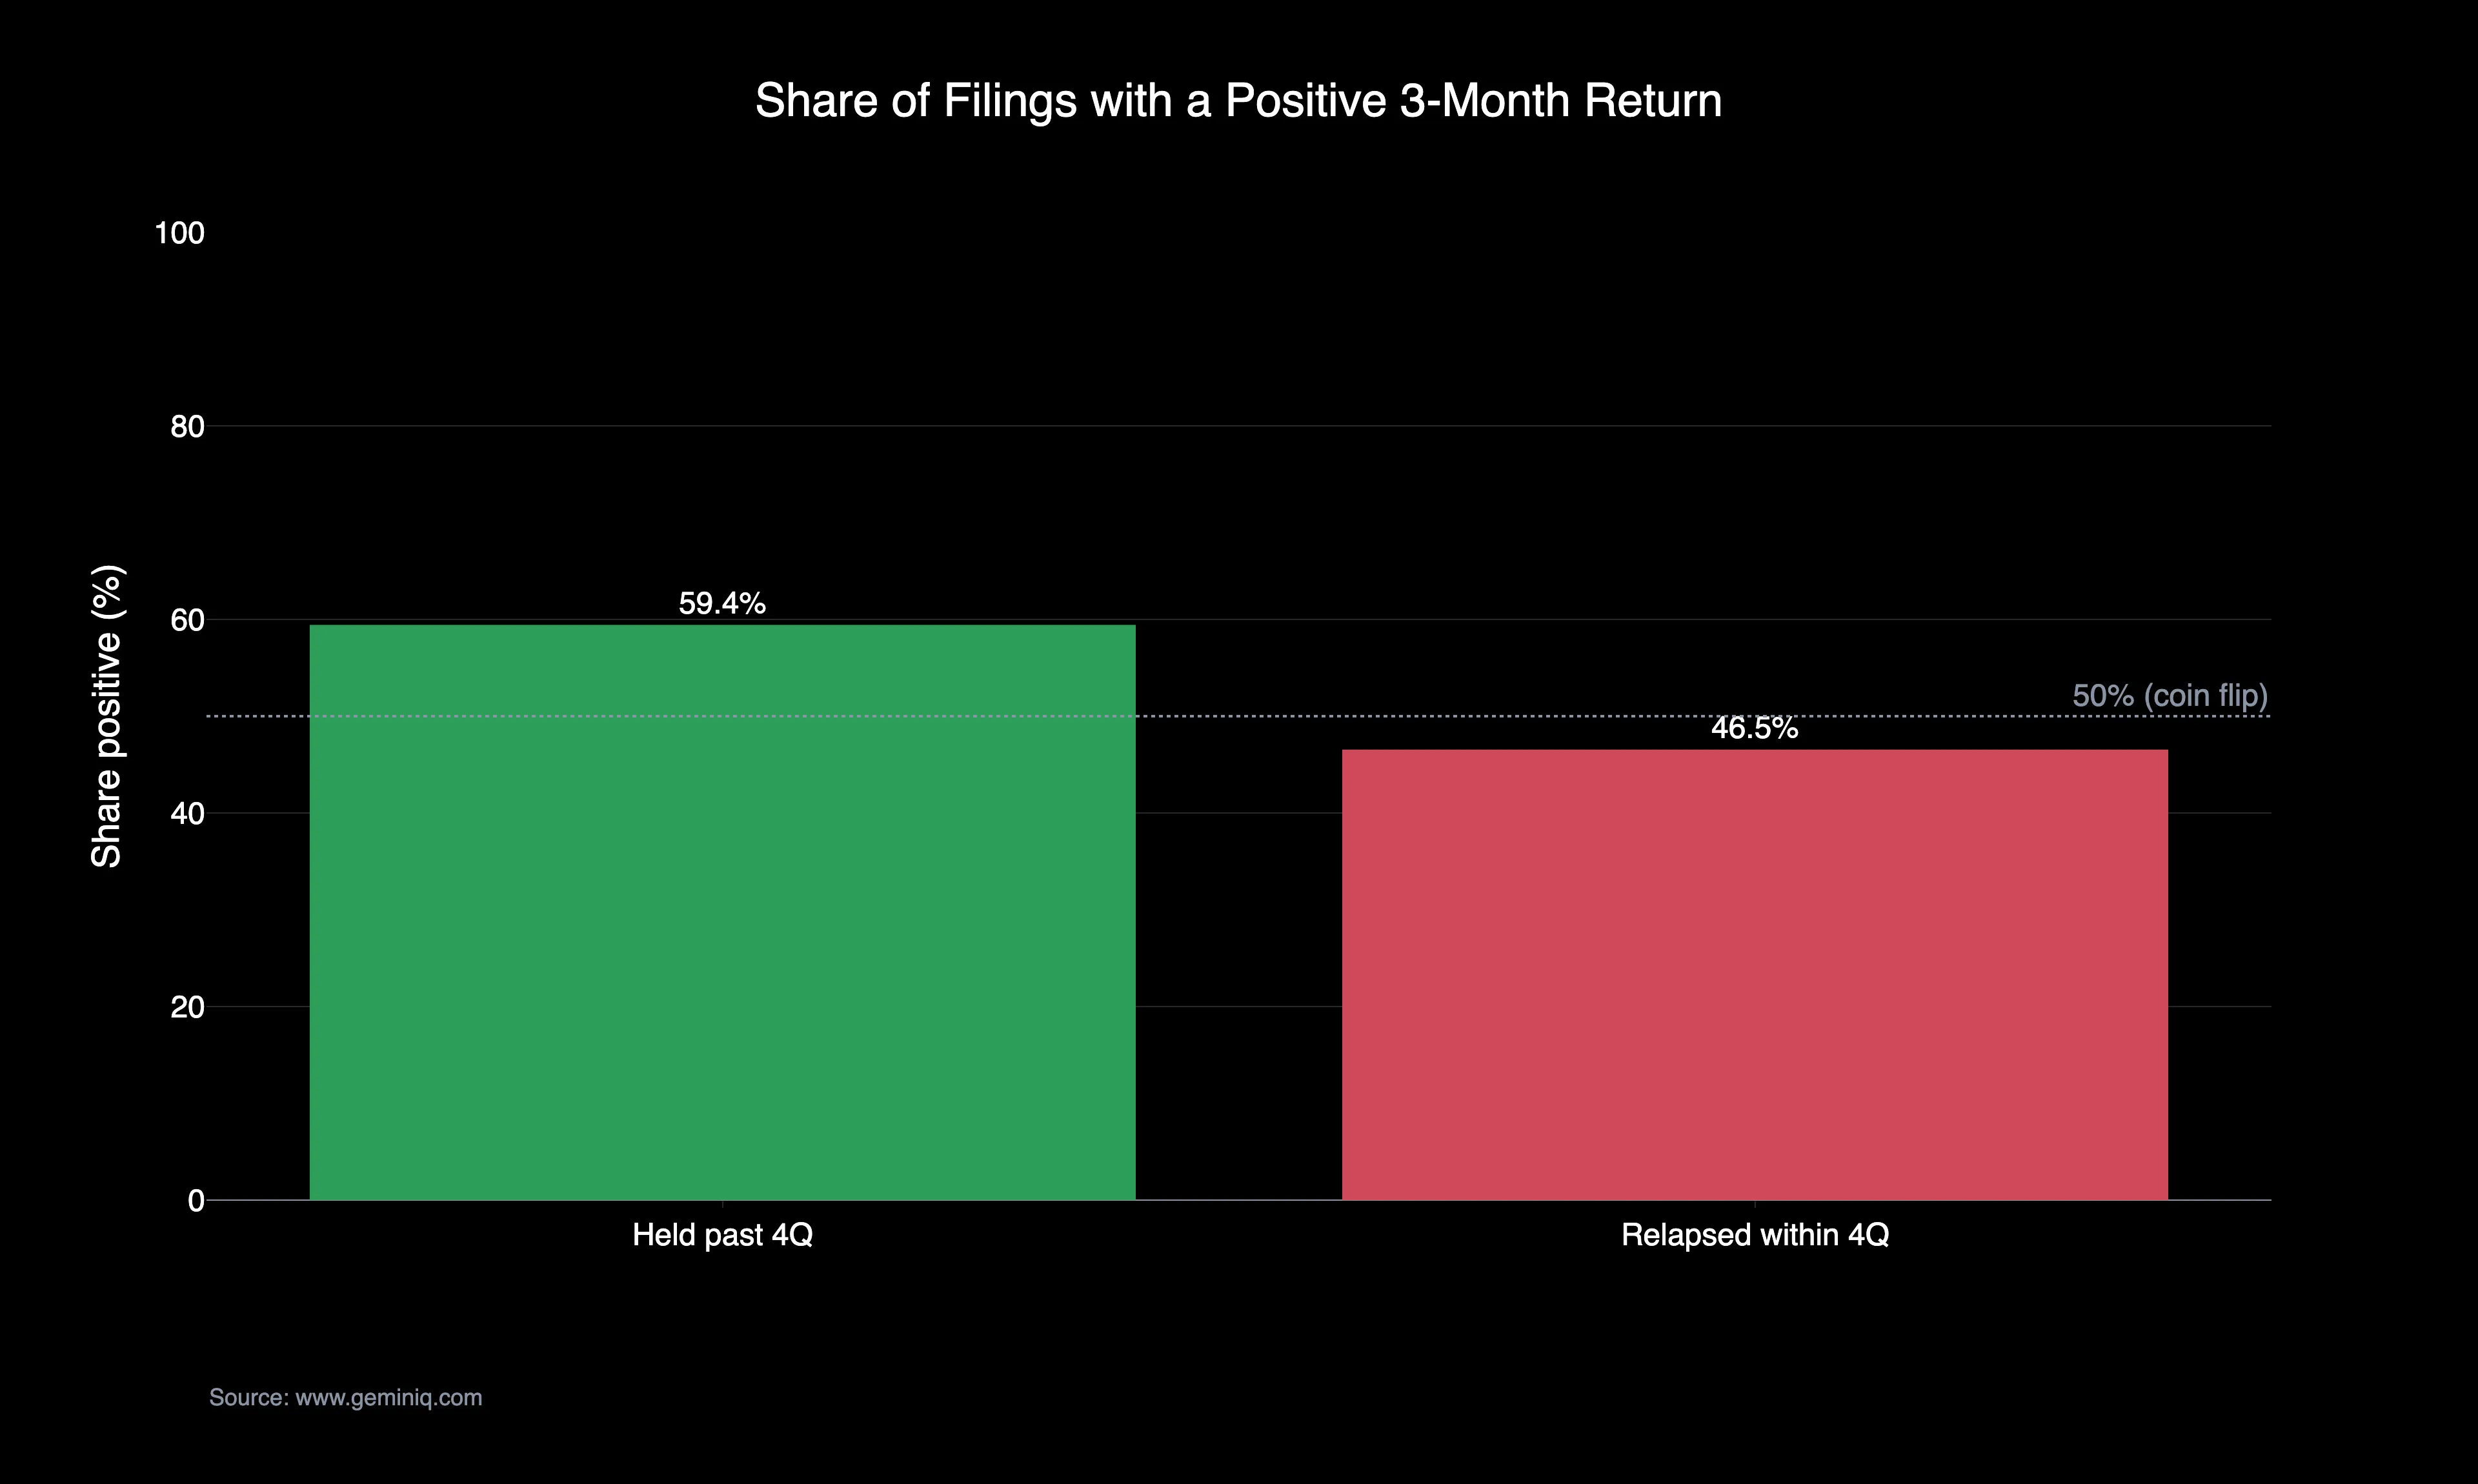
This is a historical association measured over the 2010–2026 sample window, not a forecast; a crossing that holds doesn't predict anything about the next filing, only what tended to follow crossings like it in the past.
GoPro, 3M, Coca-Cola, Devon Energy, and AMERCO
Five named crossings put faces on those two buckets, starting with the one that opened this piece.
GoPro had run 17 consecutive quarters of negative Free Cash Flow (TTM) before the Q3 2020 crossing took the figure from -$78.964 Million to +$69.182 Million in a single reading, and the stock moved 33.08% over the three months that followed. A four-year negative run ending in one filing is the version of this event most investors picture when they hear "inflection." The four crossings after it show how differently the same event can land.
3M and Coca-Cola crossed in the exact same quarter — Q3 2025 — and neither one needed much of a streak to get there. Both had been negative for just two consecutive quarters: 3M's Free Cash Flow (TTM) went from -$1.983 Billion to +$1.588 Billion, and Coca-Cola's went from -$722 Million to +$5.570 Billion. Two of the steadiest cash generators in the market, both briefly underwater, both back positive within half a year. The market's response was proportionate to how unremarkable the dip actually was: 3M moved +1.00% in the first month and drifted to -0.41% by month three; Coca-Cola stayed close to flat the whole way, +1.74% then +1.52%. Neither reaction looked anything like GoPro's — because neither crossing was resolving four years of doubt about the business.
Devon Energy shows the limit of what "held" actually promises. Devon crossed positive in Q1 2015 after 18 consecutive negative quarters, with Free Cash Flow (TTM) swinging from -$481 Million to +$5.288 Billion — and by the four-quarter fundamentals test, it held. The market did not care. The stock fell -3.35% in the first month and was down -26.52% by month three, because the crossing landed in the middle of a collapsing oil price that no single quarter of cash flow data was going to offset. Held and rewarded are two different questions, and this is the cleanest case in the dataset where they came apart.
AMERCO, U-Haul's parent, runs the opposite mismatch. AMERCO crossed positive in its December 2020 quarter after 30 consecutive negative quarters, then relapsed back negative within the next four — the same outcome that dragged the relapsed bucket's median down to flat. Its own stock didn't get the memo: +19.23% in the first month, +23.58% by month three. A relapse in the data and a rally in the price, at the same time, in the same filing.
How the First FCF Crossing Was Identified
None of those five names are outliers picked to flatter the finding — they're what the same dataset looks like at the individual-company level, including the ones where the four-quarter fundamentals test and the market's verdict pulled in opposite directions. This universe excludes financial-sector issuers — banks, insurers, broker-dealers — entirely. Their Operating Cash Flow reflects trading-book and deposit financing activity, not the kind of operating cash a non-financial company generates. An early pass at this study confirmed why: Goldman Sachs alone produced 25 sign crossings in Free Cash Flow (TTM), from swings in the tens of billions per quarter, none of which had anything to do with an "inflection" in the ordinary sense.
Free Cash Flow (TTM) is GeminIQ's pre-calculated metric — Operating Cash Flow (TTM) minus Capital Expenditures (TTM), built from the as-filed cash flow statement. The dataset counts only each company's first-ever crossing from negative to positive; later crossings for the same company are excluded so repeat flippers don't crowd the sample. Roughly 61% of identified crossings are left-censored, meaning the negative run extends back to the start of that company's available filing history. The true pre-crossing duration may be longer than the data shows for those cases. They're included in the return buckets, since the crossing event itself is still fully observed, but excluded from any streak-length comparison. Full methodology, including the winsorization and base-rate rules applied throughout, is covered in filing data study methodology.
How to Check a Crossing in Your Own Holdings
Open any company you're tracking in Calculated Metrics and pull Free Cash Flow (TTM) across its last eight quarters. If it just turned positive after a run of negative readings, this study says the crossing itself isn't the finding — what happens over the next four quarters is. Before assuming a turnaround, open the Financial Statements view for that same stretch and check what actually moved. Look for a genuine improvement in operating cash flow, not a one-time drop in capital expenditures that simply delayed spending into a future quarter. The first kind of crossing tends to hold. The second kind is exactly what this data calls a relapse waiting to happen.
Frequently Asked Questions
What is a free cash flow inflection point?
It is the quarter a company's trailing-twelve-month Free Cash Flow first crosses from negative to positive after a run of negative readings. This study counts only each company's first-ever crossing; later crossings for the same company are excluded so repeat flippers don't crowd the sample.
How many free cash flow crossings does this study cover?
15,067 companies were scanned, producing 4,491 first crossings filed between March 2010 and June 2026. The bucket analysis runs on the 2,076 of those that carry both a resolved four-quarter held-or-relapsed outcome and a clean three-month post-filing return — 1,092 that held and 984 that relapsed.
Does a first positive free cash flow quarter mean the turnaround is real?
Not on its own. Crossings that held positive for four quarters were followed by a median three-month return of +4.11% and were positive 59.4% of the time; crossings that relapsed within four quarters returned a median +0.00% and were positive just 46.5% of the time. That is a historical association measured over the 2010–2026 window, not a forecast — a working-capital swing, an asset sale, or a light capex quarter can produce a crossing that looks identical on filing day to one built on a durable improvement.
Why does this study report the median rather than the mean?
Because the mean is distorted. The raw mean three-month return in the relapsed bucket is +484.98%, driven by a handful of penny-stock and micro-cap filings that ripped higher for reasons unrelated to their cash flow statement. Winsorized at the top and bottom 1% it falls to +6.72%, still far from the +0.00% median. When the two disagree by that much after trimming, the median is the number describing the typical filing.
Wall Street's data. Main Street's price.
Institutional terminals charge thousands a year for as-filed accuracy. GeminIQ gives you the same thing for a fraction of the cost: financials built directly from raw SEC EDGAR filings, not third-party APIs, with full XBRL traceability back to the original 10-K or 10-Q. No normalized guesswork, just calculated metrics, charts, screeners, and watchlists built on numbers exactly as the company reported them. Start researching now at GeminIQ.com.
Data Appendix: Universe of 15,067 companies scanned for a first negative-to-positive Free Cash Flow (TTM) crossing, drawn from each company's as-filed 10-K and 10-Q filings, publicly available on SEC EDGAR. Financial-sector issuers (SIC 6000–6799) were excluded before crossings were computed. Free Cash Flow (TTM) is GeminIQ's pre-calculated metric (Operating Cash Flow TTM minus Capital Expenditures TTM), built from the as-filed cash flow statement. 4,491 first crossings were identified, filed March 2010 through June 2026; the bucket analysis uses the 2,076 crossings carrying both a resolved four-quarter held/relapsed outcome and a three-month post-filing return. Approximately 61% of identified crossings are left-censored (the negative run extends to the start of the company's available filing history) and are included in the return buckets but excluded from streak-length comparisons. Post-filing returns are cumulative from each filing's filed date, winsorized at the top and bottom 1%, and never compounded. The universe base rate (+3.49% mean / +2.36% median three-month return) is reused from GeminIQ's prior study of 76,908 filings, December 2004–June 2026, covered in revenue growth slowdown and stock returns. Methodology: filing data study methodology.
Disclaimer: The content in this blog is for educational and entertainment purposes only and does not constitute financial, legal, or tax advice. Investing involves risk, including the loss of principal. The views expressed are my own and not intended as financial advice or a guarantee of future performance.