
Gross Profit Margin by Industry: 20% to 62%, by Sector

By Chad Hartman
Published · Last updated
Constellation Energy runs a gross profit margin of 95.6%. Boeing runs 4.7%. Both are large, real, profitable-adjacent industrial companies, and the gap between them is the kind of number that makes "typical margin by industry" tables feel useful — until the same exercise is run one level deeper, inside a single sector, and the range turns out to be almost as wide as the one separating industries from each other entirely.
This study reads GeminIQ's as-filed universe as of the most recent trailing-twelve-month filing period for 2,781 non-financial companies — companies without a usable gross profit margin calculation, and companies in Finance, Insurance & Real Estate, are excluded, since "cost of revenue" is not a comparable concept for a bank or an insurer. Every figure is trailing-twelve-months Gross Profit Margin computed directly from GeminIQ's as-filed revenue and cost-of-revenue line items, with the top and bottom 1% of each sector's distribution trimmed.
The Pattern
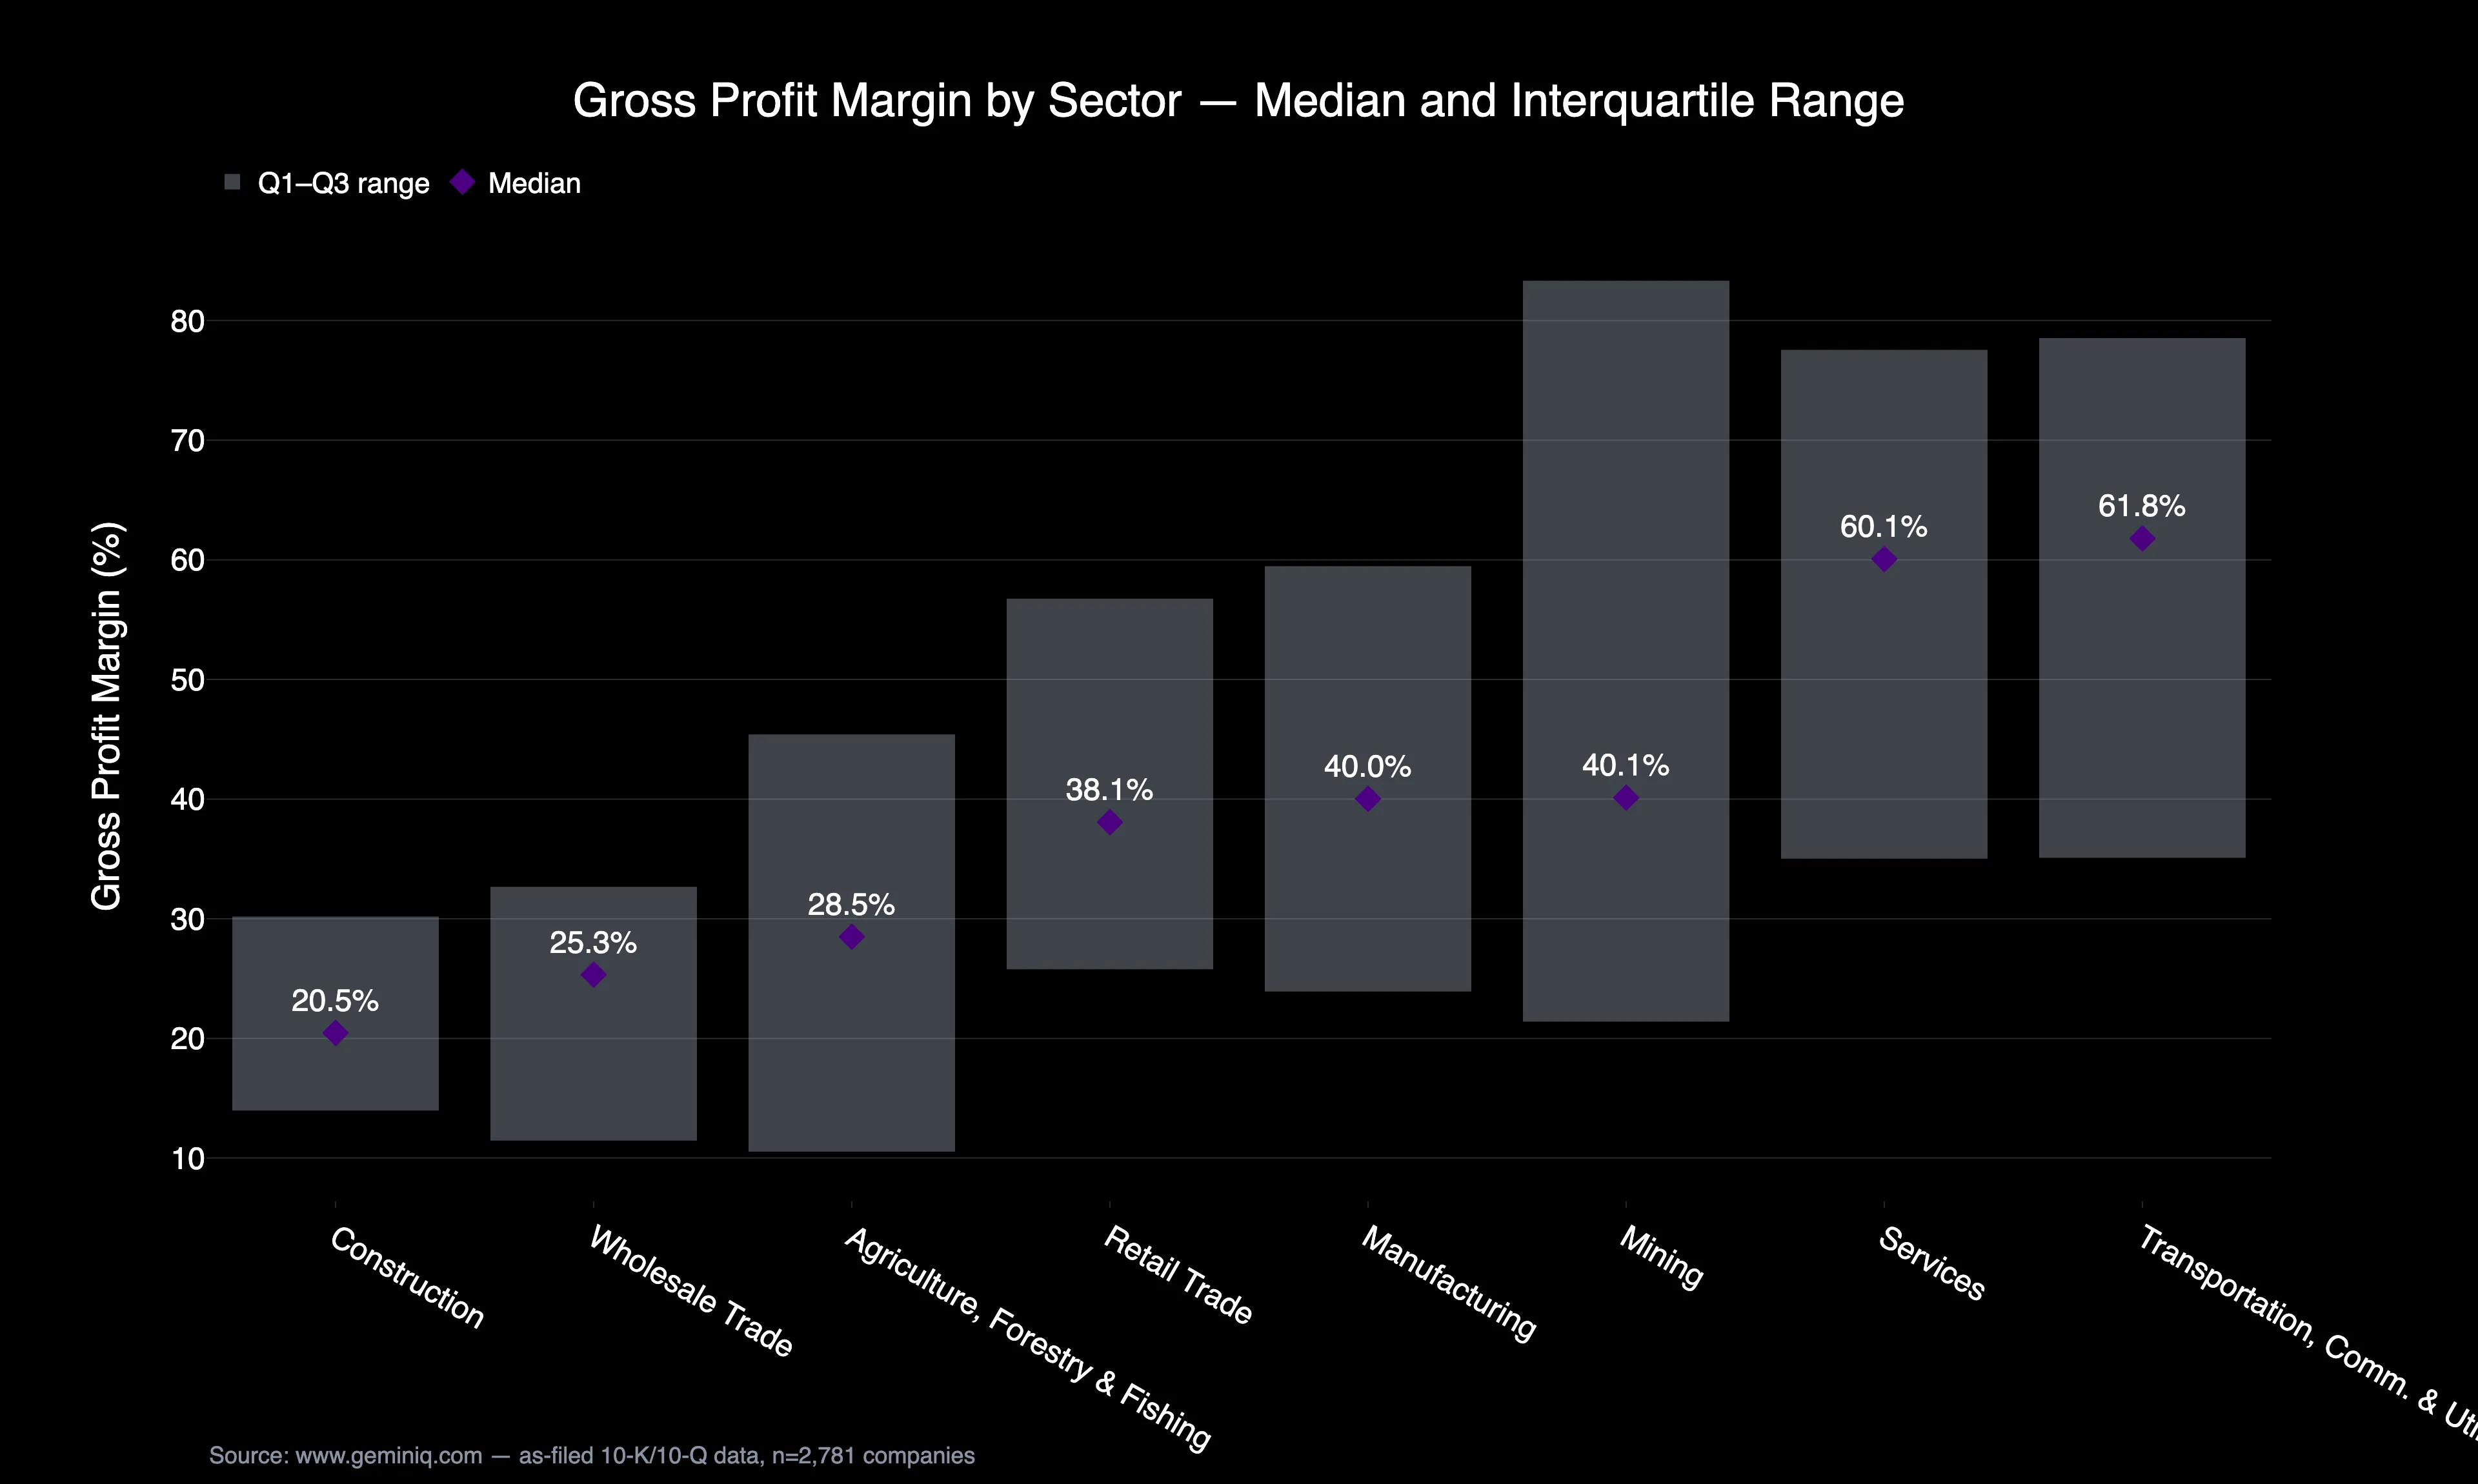
Sector medians for gross margin run from 20.5% in Construction to 61.8% in Transportation, Communications & Utilities — a spread of roughly 41 percentage points, which looks like exactly the kind of number a "typical margin by industry" table is built to capture. The problem is that several individual sectors carry an interquartile range almost as wide as that entire inter-sector gap on their own. Mining runs from a 25th percentile of 21.4% to a 75th percentile of 83.3% — a 62-point spread inside one sector, wider than the distance between the lowest- and highest-margin sectors in the whole study. A single "typical margin" number for any sector is describing a distribution, not a company, and the distribution is usually the more useful fact.
The Data
| Sector | N | Median Gross Margin | Q1–Q3 | Intra-Sector Spread |
|---|---|---|---|---|
| Transportation, Communications & Utilities | 204 | 61.8% | 35.1%–78.5% | 43.4 pts |
| Services | 717 | 60.1% | 35.0%–77.6% | 42.5 pts |
| Manufacturing | 1,385 | 40.0% | 23.9%–59.5% | 35.6 pts |
| Mining | 97 | 40.1% | 21.4%–83.3% | 61.9 pts |
| Retail Trade | 191 | 38.1% | 25.8%–56.8% | 31.0 pts |
| Agriculture, Forestry & Fishing | 28 | 28.5% | 10.5%–45.4% | 34.9 pts |
| Wholesale Trade | 98 | 25.3% | 11.5%–32.7% | 21.2 pts |
| Construction | 61 | 20.5% | 14.0%–30.2% | 16.2 pts |
| Universe (ex-financials) | 2,781 | 43.3% | 25.3%–68.6% | 43.2 pts |
Mining, Retail Trade, Agriculture, Forestry & Fishing, Wholesale Trade, and Construction sit under or near the 200-company floor GeminIQ applies to Filing Data Study buckets and should be read as directional rather than settled. The comparison worth sitting with is in the last column: the universe-wide interquartile spread, at 43.2 percentage points, is nearly identical to the gap between the lowest- and highest-median sectors. Knowing a company's sector narrows the range of plausible margins by less than intuition suggests.
The Extremes
Constellation Energy's 95.6% gross margin sits at the high end of a Transportation, Communications & Utilities sector that a single "typical margin" table would lump in with capital-intensive pipelines and telecoms running half that figure. "Utilities" is not one business model — a nuclear-heavy power generator selling into a market with surging data-center demand looks nothing like a regulated gas distributor on the income statement. At the other pole, Boeing's 4.7% gross margin reflects a large-scale manufacturer absorbing program cost overruns directly into cost of revenue — the filings show the margin compression before any earnings headline does.
The distributors make the same point from a different angle. McKesson Corp runs a gross margin of 3.6%, and Cencora, Inc. runs 4.0% — both real, large, investment-grade companies whose business model is passing pharmaceutical volume through at thin markup rather than manufacturing anything themselves. A "typical margin by industry" table that doesn't separate distributors from manufacturers inside the same broad sector will misprice both.
The Method
Every figure above is trailing-twelve-months gross profit margin — gross profit divided by net revenue, both as-filed — read from GeminIQ's Gross Profit Margin metric layer for each company's most recent filing period within the last fifteen months. Sectors are grouped by SIC division rather than a proprietary industry taxonomy, so every company's placement traces back to its own filed SIC code. This is a historical distribution measured across the current filing snapshot, not a forecast, and the top and bottom 1% of each sector's distribution is trimmed before computing medians and quartiles so a single outlier cannot move an entire sector's benchmark. Full methodology is covered in How GeminIQ Builds Filing Data Studies.
Check Your Holdings
Pull up any position on GeminIQ's Stock Screener and check its gross margin against its own SIC sector. Then check where it sits inside that sector's range rather than against the median alone — a company at its sector's 25th percentile is telling a very different story than one at the median, even when both get filed under the same "typical margin" label. Rebuild that comparison for any holding directly from GeminIQ's as-filed data, and the sector average stops being the number that decides whether a margin looks healthy.
Frequently Asked Questions
What is a typical gross profit margin by industry?
It varies widely — in GeminIQ's data, sector medians run from 20.5% in Construction to 61.8% in Transportation, Communications & Utilities. But sector alone narrows the range less than a single sector-median figure suggests, since the spread inside individual sectors is often nearly as wide as the gap between sectors.
Why is the range of gross margins within a single sector often wider than the gap between sectors?
Because sector groupings still bundle very different business models together — a nuclear-heavy power generator and a regulated gas distributor both sit in Utilities, and a pharmaceutical distributor passing volume through at thin markup sits in the same broad category as companies that manufacture what they sell. In GeminIQ's data, the universe-wide interquartile spread (43.2 points) is nearly identical to the gap between the lowest- and highest-median sectors.
Does a low gross margin always mean a weaker business?
Not necessarily. Distributors like McKesson and Cencora run gross margins in the single digits by design — their business model is passing volume through at thin markup, not manufacturing — while still being large, investment-grade, cash-generative companies.
How many companies does this study cover?
2,781 non-financial companies in GeminIQ's current filing snapshot, after excluding companies without a usable gross margin calculation and trimming the top and bottom 1% of each sector's distribution.
Wall Street's data. Main Street's price.
Institutional terminals charge thousands a year for as-filed accuracy. GeminIQ gives you the same thing for a fraction of the cost: financials built directly from raw SEC EDGAR filings, not third-party APIs, with full XBRL traceability back to the original 10-K or 10-Q. No normalized guesswork, just calculated metrics, charts, screeners, and watchlists built on numbers exactly as the company reported them. Start researching now at GeminIQ.com.
All figures are drawn from each company's as-filed 10-K and 10-Q filings, publicly available on SEC EDGAR. Sector medians and quartiles are computed from GeminIQ's Gross Profit Margin metric layer across the described universe and snapshot window.
Disclaimer: The content in this blog is for educational and entertainment purposes only and does not constitute financial, legal, or tax advice. Investing involves risk, including the loss of principal. The views expressed are my own and not intended as financial advice or a guarantee of future performance.