
WACC Formula: How to Calculate It From a 10-K, Step by Step

By Chad Hartman
Published · Last updated
The WACC formula is WACC = (E/V × Re) + (D/V × Rd × (1 − Tc)), where E and D are the market values of equity and debt, V is their total, Re is the cost of equity, Rd the cost of debt, and Tc the tax rate. It is the blended annual return a company's shareholders and lenders require, and the hurdle its return on invested capital has to clear.
Search "how to calculate WACC" and most results hand you the WACC formula and stop there — three terms, a multiplication sign, and no indication of where the numbers actually come from. That gap matters more than it looks. Unlike revenue or gross margin, WACC is not sitting on any line of any filing waiting to be read — it has to be built, one input at a time, from a mix of what a company reports and what the market is pricing outside the filing entirely. This guide builds a complete WACC estimate from Apple's most recently filed 10-K — FY2025 (filed October 31, 2025, fiscal year ending September 27, 2025). Every filed input traces to its exact GeminIQ figure; every market-sourced input is flagged as exactly that. This guide checks the final number against GeminIQ's pre-calculated Return on Invested Capital (ROIC) — the entire reason WACC gets built in the first place.
Table of Contents
- Why WACC Doesn't Show Up on Any Platform — GeminIQ Included
- The WACC Formula: What Actually Goes Into the Number
- Step 1: Pull the Capital Structure Weights From the Filing
- Step 2: Build the Cost of Debt — Why the Income Statement Alone Isn't Enough
- Step 3: Estimate the Cost of Equity With CAPM
- Step 4: Combine the Weights and Costs Into a Single WACC
- Step 5: Set the WACC Against GeminIQ's Pre-Calculated ROIC
- Why This Estimate Moves — and What Actually Holds Steady
- Frequently Asked Questions
Why WACC Doesn't Show Up on Any Platform — GeminIQ Included
WACC is not a metric GeminIQ calculates or displays on a company page, and it never will be — not because the calculation is difficult, but because two of its three inputs are not company data at all. A cost of equity estimate needs a risk-free rate and an equity risk premium, both pulled from the broader market rather than the filing. Every platform that displays a single WACC number has quietly picked a beta, a risk-free rate, and a risk premium on the user's behalf. None of it is labeled — which parts came from the 10-K, and which came from an assumption baked into the backend, look identical on the page.
That is precisely the distinction that matters for Return on Invested Capital (ROIC), the metric WACC exists to be compared against. ROIC is entirely reconstructible from filed data — NOPAT and invested capital both trace back to specific XBRL tags, which is why GeminIQ calculates it directly and consistently for every company in its database. WACC cannot make that same claim, and a platform that displays one anyway is asking to be trusted on an assumption it never shows you. Every number below is marked as filed or market-sourced. Half of this estimate comes from Apple's balance sheet. The other half is a defensible guess.
The WACC Formula: What Actually Goes Into the Number
WACC = (Weight of Equity × Cost of Equity) + (Weight of Debt × After-Tax Cost of Debt)
Three components, each built from a different source. The weights come from the capital structure — how much of the company is financed by equity versus debt, which is filed, observable data. The cost of equity comes from the Capital Asset Pricing Model, which is market data — a risk-free rate, a beta, and an equity risk premium, none of which appear anywhere in a 10-K. The cost of debt sits in between: it starts from the company's own borrowing. But when a company doesn't break interest expense out as a standalone line item — the case here — that cost has to be estimated from how the market is currently pricing its debt instead. The next three sections build one component each — then combine them into a single number.
Step 1: Pull the Capital Structure Weights From the Filing
What Are Capital Structure Weights?
The weights in the WACC formula answer a simple question: of the total capital financing the business, what share comes from equity holders and what share comes from debt holders? Both weights trace directly to filed data — no market assumption required for this step.
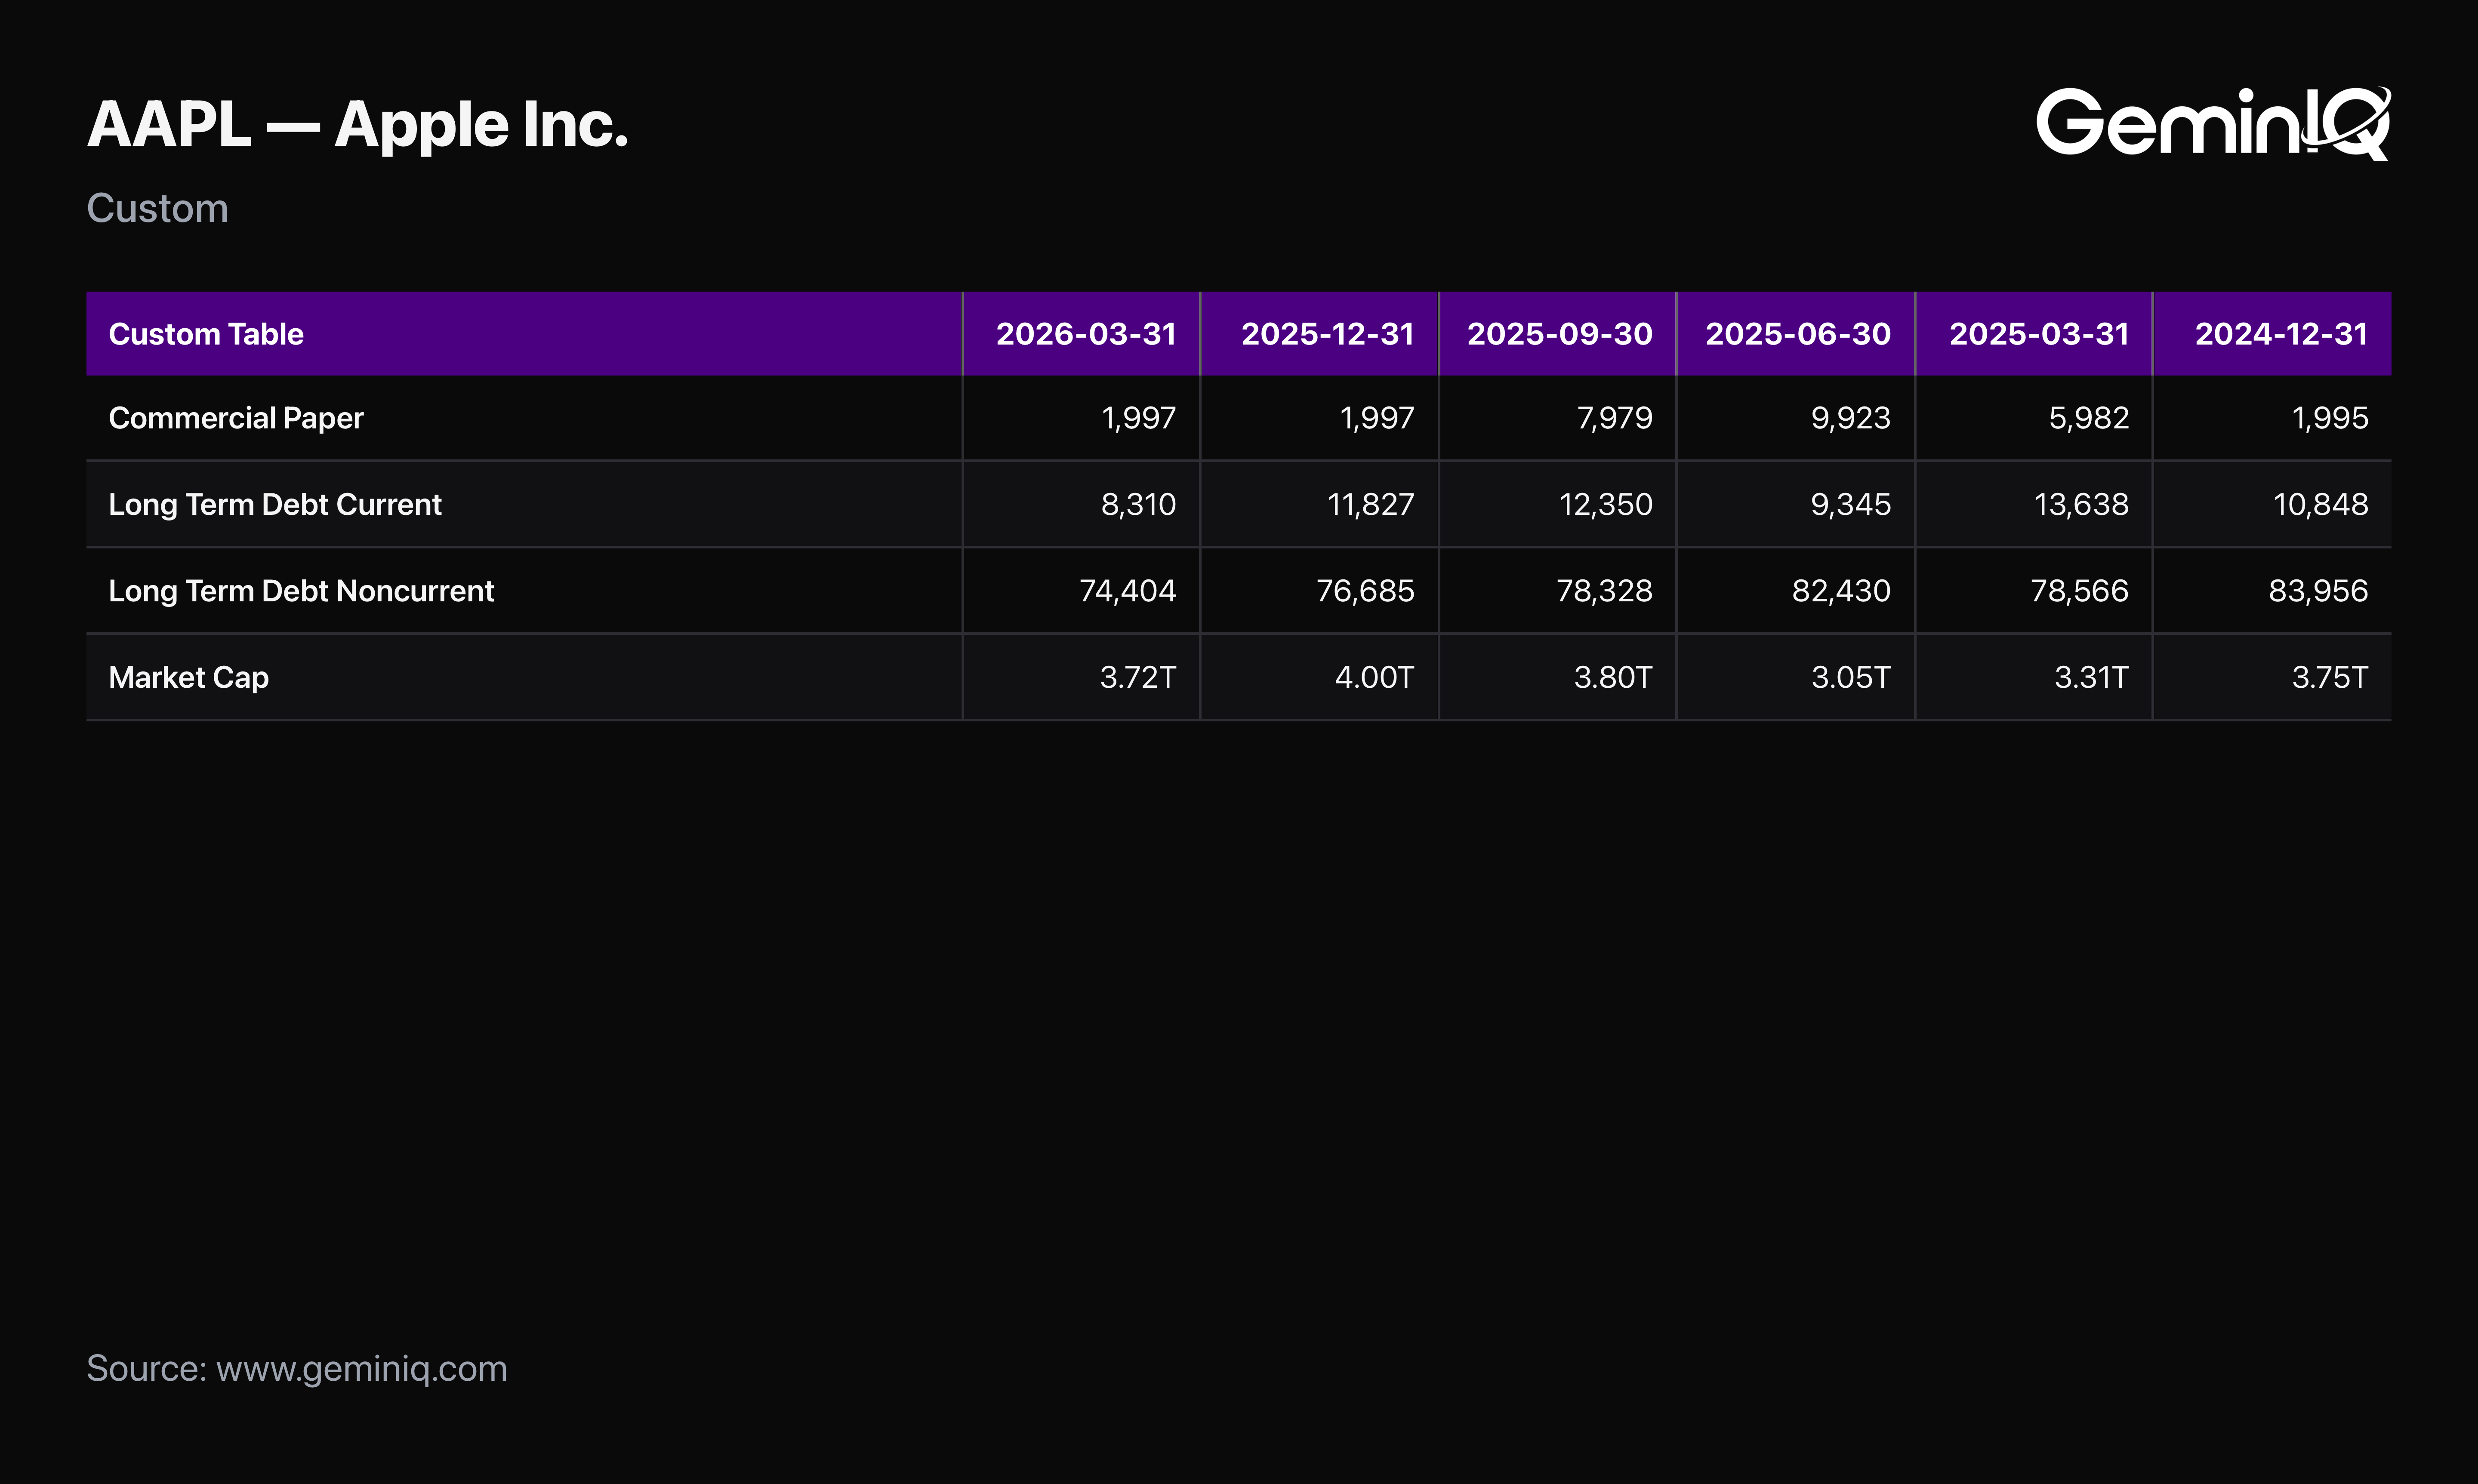
The Data: Apple's FY2025 balance sheet reports three interest-bearing debt line items: Commercial Paper (Commercial Paper: $7.979 Billion), Term Debt, Current (Long Term Debt Current: $12.350 Billion), and Term Debt, Non-Current (Long Term Debt Noncurrent: $78.328 Billion). Summed directly from the filing, that's $98.657 Billion in total interest-bearing debt — consistent with how GeminIQ defines Total Debt as Short-Term Debt plus Long-Term Debt, inclusive of current maturities. Against that, Apple's market capitalization at fiscal year end stands at $3.80 Trillion. Total invested capital, using market value of equity plus Total Debt, comes to $3.894 Trillion:
Weight of Equity = $3.7956T / $3.894T = 97.47% Weight of Debt = $98.657B / $3.894T = 2.53%
The imbalance is the story before any cost assumption even enters the picture. Apple's capital structure is financed almost entirely by equity — its $98.66 Billion in Total Debt is a rounding error against a $3.80 Trillion market capitalization. That single fact means whatever cost of debt Step 2 estimates will barely move the final WACC number. A precise cost of debt matters enormously for a heavily levered company. For Apple, the equity side of the formula is doing nearly all the work.
When it breaks: Using market value of equity rather than book value is deliberate. Book equity reflects accumulated accounting history; market cap reflects what investors are actually paying today to own that equity — the more relevant weight for a forward-looking cost of capital. The tradeoff is that market cap moves every trading day while the debt figure stays fixed until the next filing. A WACC weight calculated the day after a sharp price move will look different from one calculated a month later — even though nothing about the underlying business changed.
Step 2: Build the Cost of Debt — Why the Income Statement Alone Isn't Enough
What Is the Cost of Debt Formula?
After-Tax Cost of Debt = Pre-Tax Cost of Debt × (1 − Effective Tax Rate)
The textbook version of this calculation divides a company's interest expense by its total debt to find an effective borrowing rate, then tax-adjusts it because interest is deductible. That approach assumes the company breaks interest expense out as its own line on the income statement. Pulling Interest Expense directly from GeminIQ's Financial Statements for Apple returns $0.00. That is not because Apple pays no interest on its $98.66 Billion in Total Debt — it is because Apple's income statement nets interest expense against interest income earned on its marketable securities portfolio into a single combined "Other Income/(Expense), Net" line. Apple never files a standalone Interest Expense tag at all.
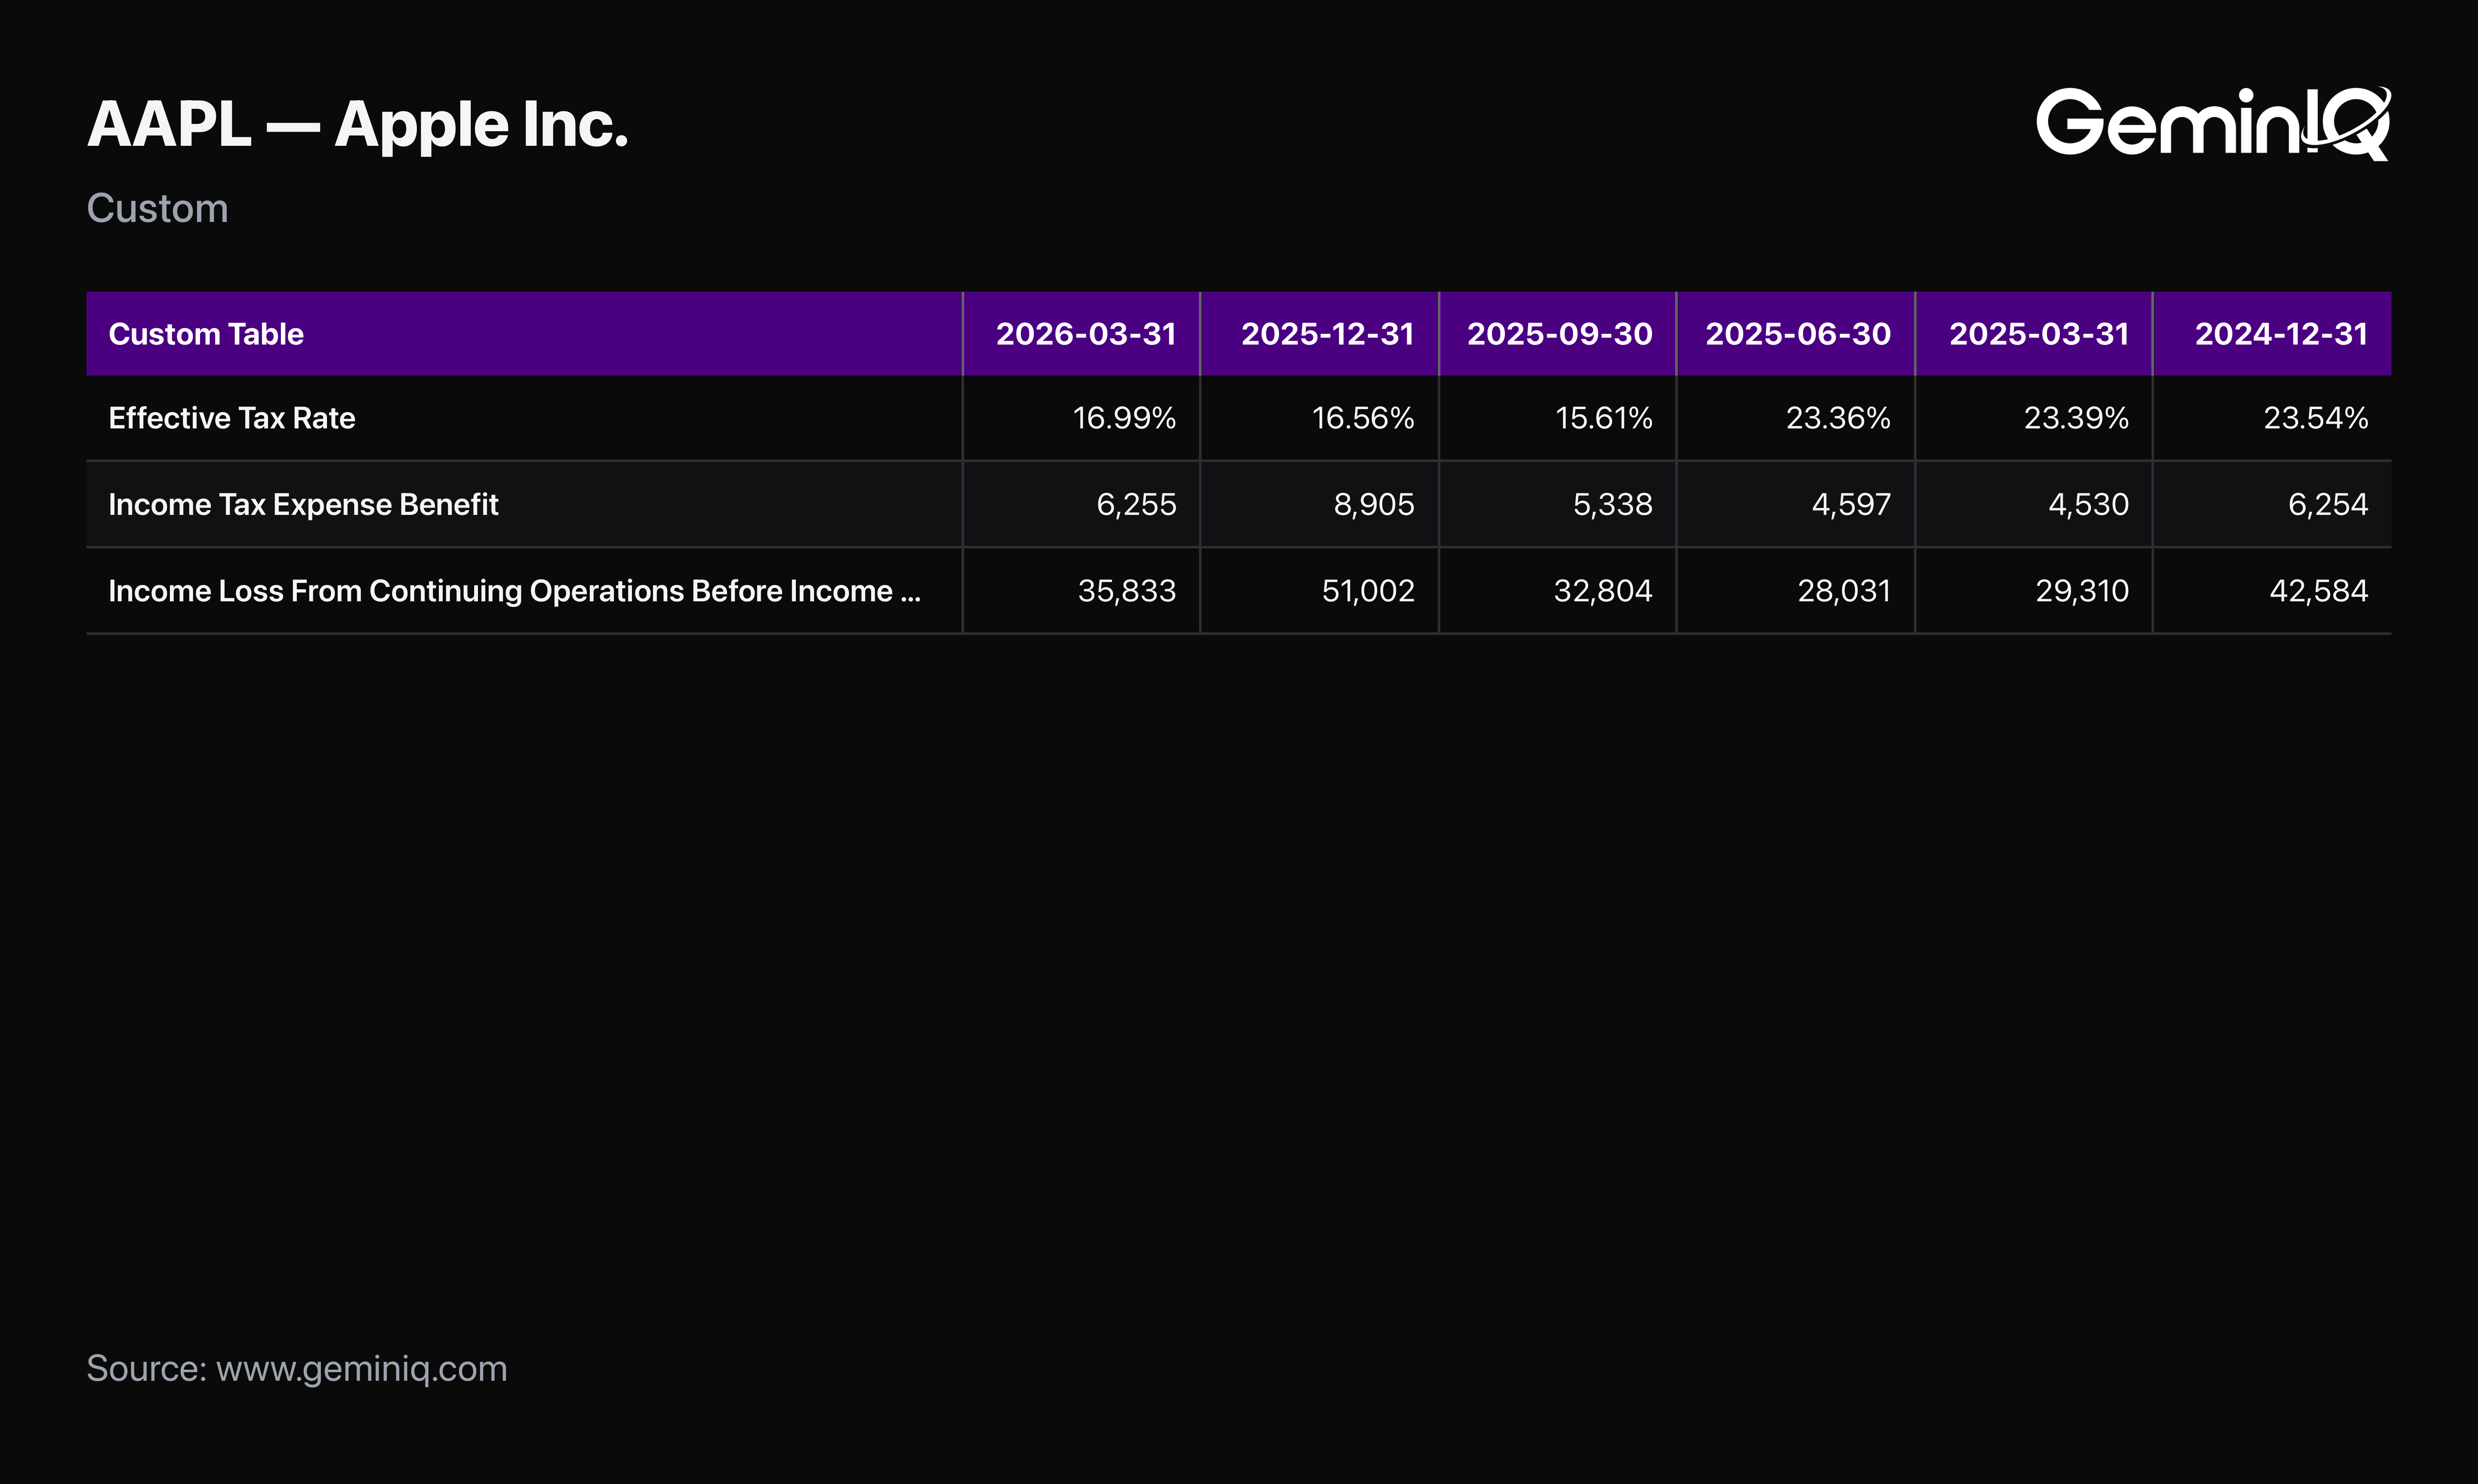
The Data: With no clean interest expense line to divide by total debt, the more defensible approach prices the debt the way the market currently does. Apple's own outstanding notes yield to maturity becomes the proxy for its current cost of debt. Apple's shorter-dated fixed-rate notes are currently trading to yield just over 5.02%, consistent with where investment-grade technology-company debt has generally priced relative to Treasuries through mid-2026. Tax-adjusting that figure uses GeminIQ's pre-calculated Effective Tax Rate of 15.61% — built from Income Tax Expense of $20.719 Billion against Pre-Tax Income of $132.729 Billion — well below the 21% statutory federal rate.
Pre-Tax Cost of Debt (~5.02%) × (1 − 15.61%) = After-Tax Cost of Debt of ~4.24%
When it breaks: Companies that report a standalone interest expense line make this step mechanical — divide interest expense by total debt, tax-adjust, done. Companies like Apple — with investment portfolios large enough that interest income offsets interest expense into a single net line — force a choice. Either dig through the notes to the financial statements for a gross interest expense figure that isn't always disclosed, or price the debt from the market instead, as this guide does. Either method is defensible. What is not defensible is dividing a net "Other Income/(Expense)" figure by total debt and calling the result a cost of debt. That number conflates two entirely different things, and it will materially understate the true borrowing cost.
Step 3: Estimate the Cost of Equity With CAPM
What Is the Capital Asset Pricing Model?
Cost of Equity = Risk-Free Rate + (Beta × Equity Risk Premium)
This is the point in the calculation where filed data stops entirely. All three CAPM inputs are market-observed, not company-reported, and none of them appear in a 10-K under any XBRL tag. The risk-free rate is typically the yield on a long-dated Treasury security — currently around 4.46% on the 10-year. A widely-cited market assumption puts the equity risk premium at roughly 5% for U.S. equities. Beta measures how volatile a stock's returns are relative to the broader market, and it is the input with the least agreement across data providers. Market data providers currently estimate Apple's beta anywhere from roughly 0.83 to 1.10, depending on the lookback window and methodology used.
The Data: Running the CAPM formula across that beta range rather than a single point estimate:
Low end: 4.46% + (0.83 × 5.0%) = 8.61% High end: 4.46% + (1.10 × 5.0%) = 9.96%
The midpoint of that range, roughly 9.29%, is the figure this guide carries forward — but the range itself is the more honest output. A 135-basis-point spread in the cost of equity — driven entirely by which beta estimate gets chosen — is a larger swing than most of the balance-sheet-level judgment calls that show up elsewhere in fundamental analysis. And it happens before a single dollar of Apple's actual financials enters the equation.
When it breaks: Beta is calculated from historical price returns, which makes it backward-looking by construction. It can shift meaningfully depending on whether the lookback window is two years or five, and whether it's measured against daily, weekly, or monthly returns. A company that has recently changed its business mix, taken on new leverage, or entered a different risk profile than its trading history reflects will have a beta that describes its past more accurately than its present.
Step 4: Combine the Weights and Costs Into a Single WACC
Every input is now in place. Capital structure weights come from the filed balance sheet. An after-tax cost of debt comes from market bond pricing and GeminIQ's pre-calculated effective tax rate. A cost of equity range comes from CAPM. Combining them:
WACC = (97.47% × 9.29%) + (2.53% × 4.24%) WACC = 9.05% + 0.11% = 9.16%
Running the same combination across the full cost-of-equity range from Step 3 produces a WACC of roughly 8.50% at the low end and 9.82% at the high end. The 9.16% headline figure sits almost exactly at the midpoint. Notice how little the debt term moves the outcome: at a 2.53% weight, even a full percentage point of error in the cost of debt estimate would shift total WACC by roughly two to three basis points. The entire range in the final number comes from the cost of equity, not from anything on Apple's balance sheet — a direct consequence of how lightly Apple is levered.
Step 5: Set the WACC Against GeminIQ's Pre-Calculated ROIC
The entire point of building a WACC estimate is the comparison it enables. Pulling GeminIQ's pre-calculated Return on Invested Capital directly from the dashboard, Apple's ROIC (TTM) stands at 78.45%. GeminIQ builds that figure from NOPAT of $112.28 Billion divided by Average Invested Capital of $143.12 Billion — both sourced automatically from as-filed data, with no market assumption required anywhere in the calculation. Against the 9.16% WACC estimate built above, that produces a spread of roughly 69 percentage points — among the widest of any large-cap company. It's consistent with a business earning dramatically more on every dollar of invested capital than that capital costs to raise.
That asymmetry is the whole argument for why WACC will never be a platform metric and ROIC always will be. One side of this comparison — 78.45% — required zero judgment calls and updates automatically every filing. The other side — 9.16%, with a defensible range of 8.50% to 9.82% — required a market bond yield, a Treasury rate, an equity risk premium assumption, and a choice among three plausible beta estimates. Both are legitimate numbers. Only one of them is a fact.
Why This Estimate Moves — and What Actually Holds Steady
Rerun this walkthrough in three months and the answer will not be 9.16%. The Treasury yield will have moved, Apple's stock price and therefore its market cap will have moved, its bond yields will have moved, and whichever beta estimate gets used may have shifted with a new trailing window. None of that instability lives in the filing — it lives entirely in the market-sourced half of the formula, exactly as Step 3 flagged.
What holds steady is the filed half: the capital structure weights and the effective tax rate will not change until the next filing posts. Both are traceable to the exact XBRL tag behind them at any point in between. That is the practical dividing line worth carrying out of this guide and into any other cost-of-capital estimate: half of WACC is auditable against a filing, and half of it is a defensible guess about the future. Treating both halves with the same confidence is where most WACC estimates go wrong before the math even starts.
Frequently Asked Questions
Why doesn't GeminIQ just calculate WACC and display it like ROIC?
Because two of its three inputs — the equity risk premium and beta — are not company data. GeminIQ calculates every metric from as-filed XBRL inputs with one transparent, published method per metric. WACC cannot meet that bar because a meaningful share of it is a market assumption, not a filed number. What GeminIQ does provide is every filed input this guide uses: Total Debt, Market Capitalization, and Effective Tax Rate, all sourced directly from the 10-K.
Is the market-yield approach to cost of debt always necessary?
No. When a company reports a standalone interest expense line on its income statement, dividing that figure by total debt and tax-adjusting the result is simpler and uses entirely filed data. The market-yield approach in this guide is specifically necessary for companies like Apple that net interest expense against interest income into a single combined line — confirmed directly by GeminIQ's Interest Expense field returning $0.00 for the period.
Why use market value of equity instead of book value in the weights?
Book value of equity reflects historical accounting entries — retained earnings, paid-in capital, treasury stock — that can diverge substantially from what the market is actually paying for the business today. Market capitalization is the more theoretically correct weight for a forward-looking cost of capital because it reflects current investor pricing rather than accumulated accounting history.
How sensitive is WACC to the beta assumption?
Very. In this walkthrough, a beta range of 0.83 to 1.10 — a spread that exists simply because different data providers use different lookback windows and methodologies — produced a 135-basis-point range in the cost of equity and translated almost one-for-one into the final WACC range. For a lightly levered company like Apple, beta uncertainty is effectively the entire source of uncertainty in the final number.
Does a wide ROIC-to-WACC spread guarantee the stock is a good investment?
No. A wide spread indicates the underlying business is creating substantial economic value with the capital it deploys — it says nothing about whether the current share price already reflects that quality. ROIC and WACC together answer whether a business is a good business; they do not answer whether it is a good price.
What does a 5% WACC mean?
A 5% WACC means the company's investors, blended by how much capital each provides, require a 5% annual return. That is low, and usually reflects a large, stable company with cheap debt and low stock volatility; any investment returning more than 5% on capital adds value.
Is a higher WACC good or bad?
For the company, a higher WACC is worse: it raises the return every project has to earn and lowers the present value of future cash flows in a valuation. It usually reflects higher risk, from a volatile stock, heavy borrowing, or expensive debt, rather than anything management chose deliberately.
How do you calculate WACC in Excel?
Put the market value of equity, market value of debt, cost of equity, pre-tax cost of debt, and tax rate in five cells, then combine them: =E/(E+D)*Re + D/(E+D)Rd(1-T). The formula is simple; the work is in estimating the cost of equity and the market cost of debt, which the steps above cover.
Related Reading
- Return on Invested Capital (ROIC): Formula and Benchmarks — the full NOPAT and invested capital build, including the ROIC-vs-WACC value creation test this guide's final WACC number is meant to be checked against.
- How to Calculate Financial Ratios From a 10-K: Step-by-Step — the companion walkthrough using the same Apple FY2025 10-K, building four ratios entirely from filed data.
- Discounted Cash Flow (DCF) Model: Step-by-Step Walkthrough — where WACC is most commonly used as the discount rate, built here from NVIDIA's filing instead of Apple's.
- Value Investing Glossary: Terms, Ratios, and Mental Models Defined — full definitions of WACC, ROIC, CAPM, and every other term referenced in this guide.
Wall Street's data. Main Street's price.
Institutional terminals charge thousands a year for as-filed accuracy. GeminIQ gives you the same thing for a fraction of the cost: financials built directly from raw SEC EDGAR filings, not third-party APIs, with full XBRL traceability back to the original 10-K or 10-Q. No normalized guesswork, just calculated metrics, charts, screeners, and watchlists built on numbers exactly as the company reported them. Start researching now at GeminIQ.com.
All financial figures cited in this article reference Apple Inc.'s FY2025 10-K (filed October 31, 2025, fiscal year ending September 27, 2025). All SEC filings are publicly available at SEC EDGAR.
Disclaimer: The content in this blog is for educational and entertainment purposes only and does not constitute financial, legal, or tax advice. Investing involves risk, including the loss of principal. The views expressed are my own and not intended as financial advice or a guarantee of future performance.