
Institutional Ownership: What It Means and How to Track It

By Chad Hartman
Published · Last updated
Institutional ownership is the share of a company's stock held by investment managers such as mutual funds, pension funds, hedge funds, banks, and insurers, rather than by individual investors. It is built from the Form 13F reports that managers with at least $100 million in qualifying securities file each quarter, so it is always a quarter-end snapshot published up to 45 days later.
Almost every financial data platform displays institutional ownership as a single percentage. Standard financial media treats a rising number as confirmation of smart-money interest and a falling number as a warning. But by the time any Form 13F hits EDGAR, the data it contains is already at minimum 46 days old — and may describe a position the filing manager has since materially changed. Beyond the lag, the percentage itself is structurally distorted: buybacks raise it without any institution purchasing a single share, index reconstitutions spike it without any valuation judgment, and ETF proliferation inflates the aggregate through double-counting. The signal investors believe they are reading from the institutional ownership line is not the signal the data actually carries. This guide explains what the 13F system discloses, where the genuine investment signal lives, and how to distinguish a real accumulation pattern from a mechanical one.
Table of Contents
- Where Institutional Ownership Data Comes From
- The 45-Day Reporting Lag
- The Four Position Types: Where the Signal Lives
- Why the Ownership Percentage Is the Wrong Number
- The Holder Count Signal
- How to Track Institutional Ownership Changes in GeminIQ
- When Institutional Ownership Signals Break
- Frequently Asked Questions
- Related Reading
Where Institutional Ownership Data Comes From
Institutional ownership figures are aggregated from Form 13F. Section 13(f) of the Securities Exchange Act requires any investment manager with at least $100 million in Section 13(f) securities (mostly exchange-listed stocks, plus certain options and convertibles) to report its long holdings each quarter, within 45 days of quarter-end. That captures everyone from trillion-dollar index funds to boutique active managers, which is why the aggregate blends informed active investors with passive holders whose only input was a benchmark.
Three gaps in the source data carry straight through to every ownership figure built on it. Short positions are not reported, so a fund that is net short a stock can still appear as a holder. Cost basis and purchase dates are not reported, so a position opened last quarter looks the same as one held for a decade. And managers can request confidential treatment on Form 13F-CT to delay disclosing specific positions for up to a year, so reported ownership can understate active positioning. For a column-by-column walkthrough of the filing itself, see How to Read 13F Filings.
The 45-Day Reporting Lag
The lag is the single most important structural feature of 13F data, and the one most investors underestimate.
Consider the timeline for Q1. An institutional manager assembles its portfolio through January, February, and March. The quarter closes March 31. The manager has until May 15 to file. When that 13F hits EDGAR on May 15, it describes positions as of March 31 — 45 days earlier. That is the best case, when a manager files on the last possible day. If a manager files promptly on April 15, investors reading that data on May 15 are still working from a March 31 snapshot. The freshness of the filing date is irrelevant to the staleness of the underlying data.
The consequence is direct: by the time a position becomes visible in a 13F, the manager has already had time to act on it. Depending on when in the quarter the position was established, that window runs anywhere from 46 to 136 days — enough time to add to the position, reduce it, or exit it entirely. A new position that appears in a Q3 13F may have been initiated in July, with the manager actively adding through October and November, before the filing confirms the original entry in mid-November. The 13F underrepresents how far along the conviction trade has already progressed.
On the exit side, a manager who began trimming late in Q2 and completed the exit in Q3 will show a full position in the Q2 filing. The Q3 filing then shows a complete liquidation, with no data showing the reduction unfolding across the transition. This is why using 13F data as a short-term trading signal — buying because a prominent manager just disclosed a position — is almost always acting on stale information as though it were current.
The Four Position Types: Where the Signal Lives
The raw share count in any line item of a 13F is less informative than the change in that share count relative to the prior quarter's filing. Every position change across all 13F filers falls into one of four categories, and the interpretive weight assigned to each should differ accordingly.
New Position
A stock appears in an institution's holdings table for the first time — no prior quarter's filing showed this holding. A new position is the clearest indication that a manager made a deliberate decision to allocate capital to this company at or near current price levels. It does not guarantee high conviction; new positions can be small exploratory entries. But it is the cleanest signal of fresh institutional interest. Tracking the number of unique managers opening new positions in a given stock across a single quarter is one of the most useful aggregates the 13F data set produces.
Addition
An institution increases its share count beyond what was reported in the prior filing. An addition signals continued or growing conviction from an existing holder. A series of additions across multiple quarters in a row is a meaningful indicator of sustained institutional accumulation — the manager keeps adding at successive price levels, which implies a view that the stock remains undervalued relative to their target.
Reduction
An institution decreases its share count from the prior quarter. A single reduction is inconclusive — it could be profit-taking, mechanical portfolio rebalancing, or the early stage of an exit. A series of reductions across multiple consecutive quarters carries more weight, particularly when the overall holder count in the stock is simultaneously declining. The combination of falling per-manager share counts and a shrinking holder count is a structurally bearish institutional signal.
Liquidation
The stock no longer appears in the institution's holdings table. A liquidation can result from a complete sell-out, a fund closure, a portfolio restructuring, or a transition to a short position that eliminates the reported long. The most analytically significant signal comes not from any individual liquidation but from simultaneous liquidations across multiple managers in the same quarter — that convergence represents the strongest institutional exit signal the 13F system produces.
Why the Ownership Percentage Is the Wrong Number
The headline institutional ownership percentage — the figure displayed prominently on virtually every financial platform — comes from a simple calculation: total shares reported by 13F filers divided by total shares outstanding. The math is correct. The problem is that the denominator changes for reasons entirely disconnected from institutional conviction, and using the resulting percentage as a signal produces systematic misreadings.
The buyback distortion
When a company repurchases shares, total shares outstanding falls. If institutions hold their absolute share counts constant while the company shrinks the denominator, the ownership percentage rises — even though not a single institutional investor bought a share. The percentage increase is arithmetic, not analytical.
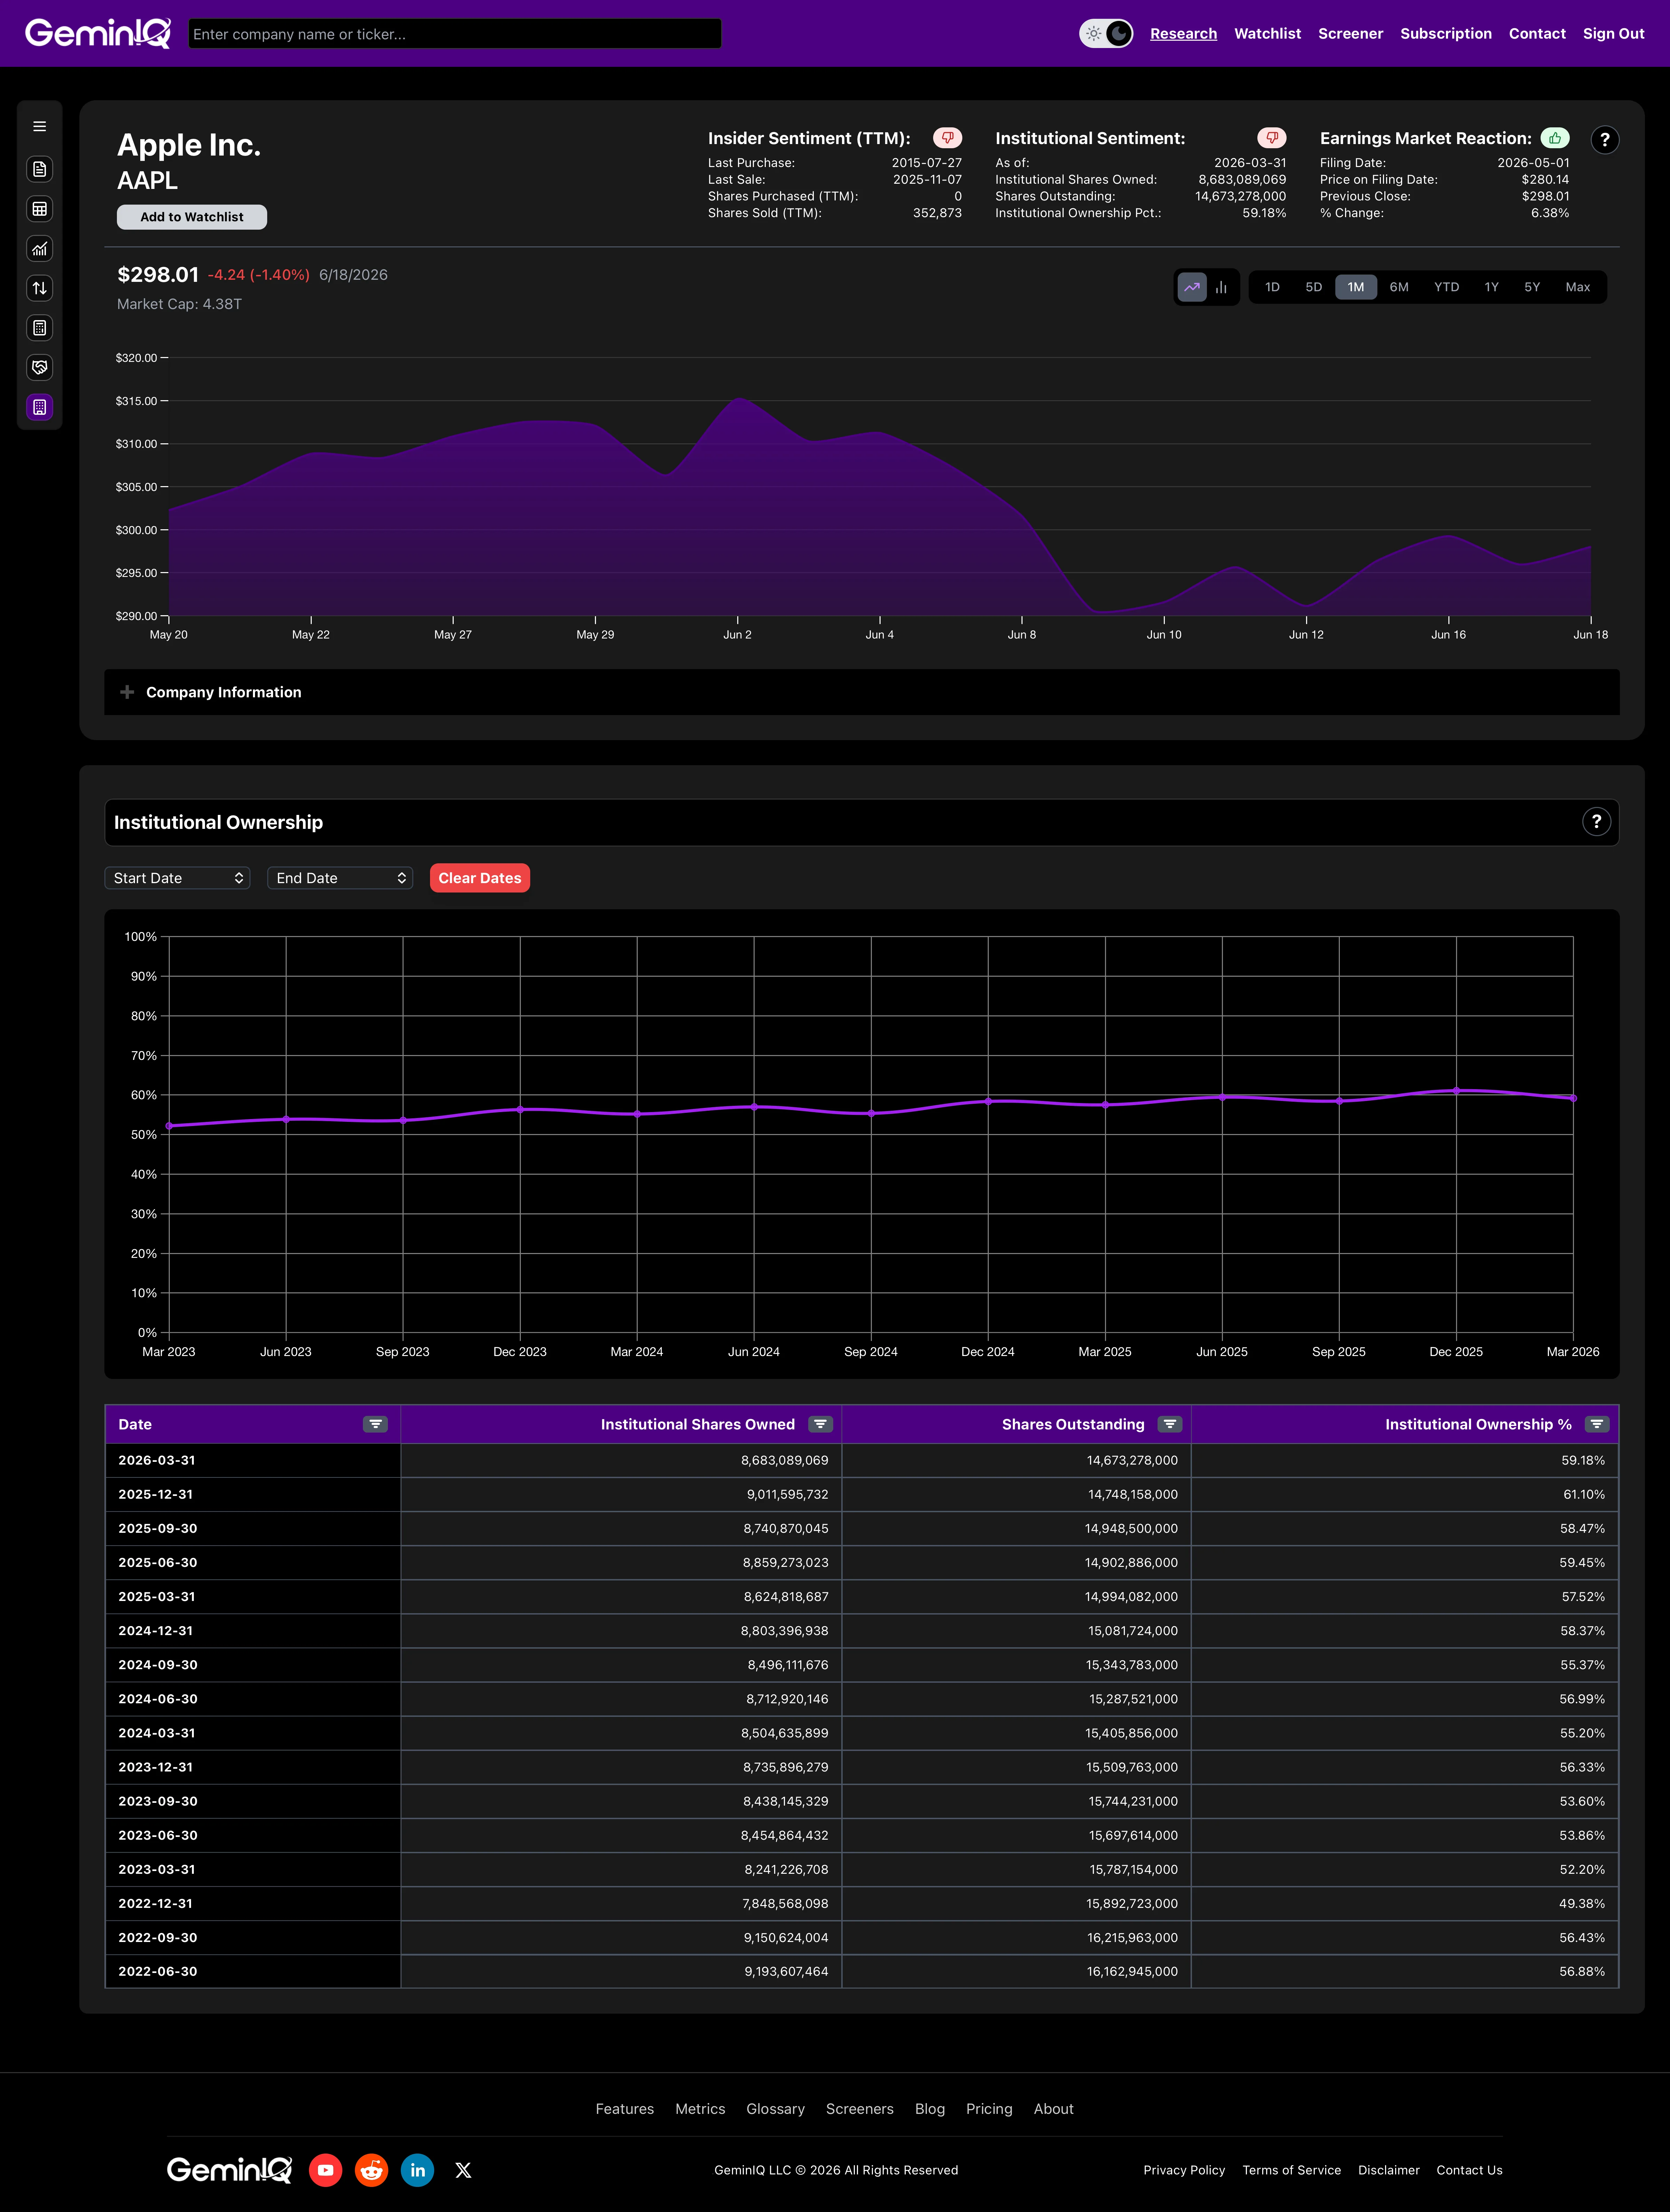
Apple provides the clearest illustration. Split-adjusted shares outstanding declined from approximately 23 billion in FY2014 to roughly 14.8 billion by FY2025 — a reduction of more than 36% driven almost entirely by buybacks. Throughout that period, institutional ownership percentage held in a band between roughly 50% and 60%. Standard financial media treated this as evidence of sustained institutional conviction in Apple. But by tracking the absolute share counts in GeminIQ's Institutional Ownership tracker, a different pattern emerges: institutions were trimming their absolute share holdings roughly in proportion to the buyback activity, maintaining proportional exposure while Apple shrank the total float. The percentage held steady. Absolute institutional share counts were declining. Those are opposite conclusions from the same data — and which one you reach depends entirely on whether you are reading the percentage or the underlying count.
The index inclusion distortion
When a stock is added to the S&P 500 or any major index, every passive fund tracking that benchmark is mechanically required to purchase shares. Institutional ownership percentage can jump several points in the quarter of inclusion. That buying has no valuation content — it is structural, not analytical. Treating that spike as a bullish signal about the business mistakes a rule-following transaction for a deliberate investment decision.
What to watch instead
Watch the absolute shares held by 13F filers, not the percentage — specifically the direction and magnitude of that figure quarter-over-quarter, controlled for changes in total shares outstanding and any major index events in the period. A flat percentage against a declining share count is not the same signal as a flat percentage against a stable share count. The raw share count is the number that reflects actual institutional behavior.
The Holder Count Signal
The number of unique 13F filers reporting a position in a stock — the holder count — carries information that the ownership percentage discards entirely.
A rising holder count means more institutional managers are independently deciding to allocate capital to the same company. Each new position represents a separate analytical conclusion at a different firm, made by a different investment team, against a different risk framework. The convergence of independent decisions is analytically meaningful for the same reason an insider cluster event is meaningful. When multiple unrelated actors reach the same conclusion about the same stock in the same window, the aggregate signal carries more weight than any single position.
A falling holder count, even alongside a rising or stable ownership percentage, is a caution flag. It means fewer institutions hold a larger collective stake — concentration rather than broad accumulation. Concentration can indicate high-conviction active ownership, but it also amplifies downside volatility if the remaining large holders decide to reduce simultaneously.
The most constructive institutional ownership pattern is rising holder count combined with rising absolute share counts — the one that historically precedes sustained price appreciation. At least a meaningful fraction of the new entries should represent genuinely new positions, not existing holders simply adding at higher prices. New money entering at current price levels is a different statement than existing holders averaging up.
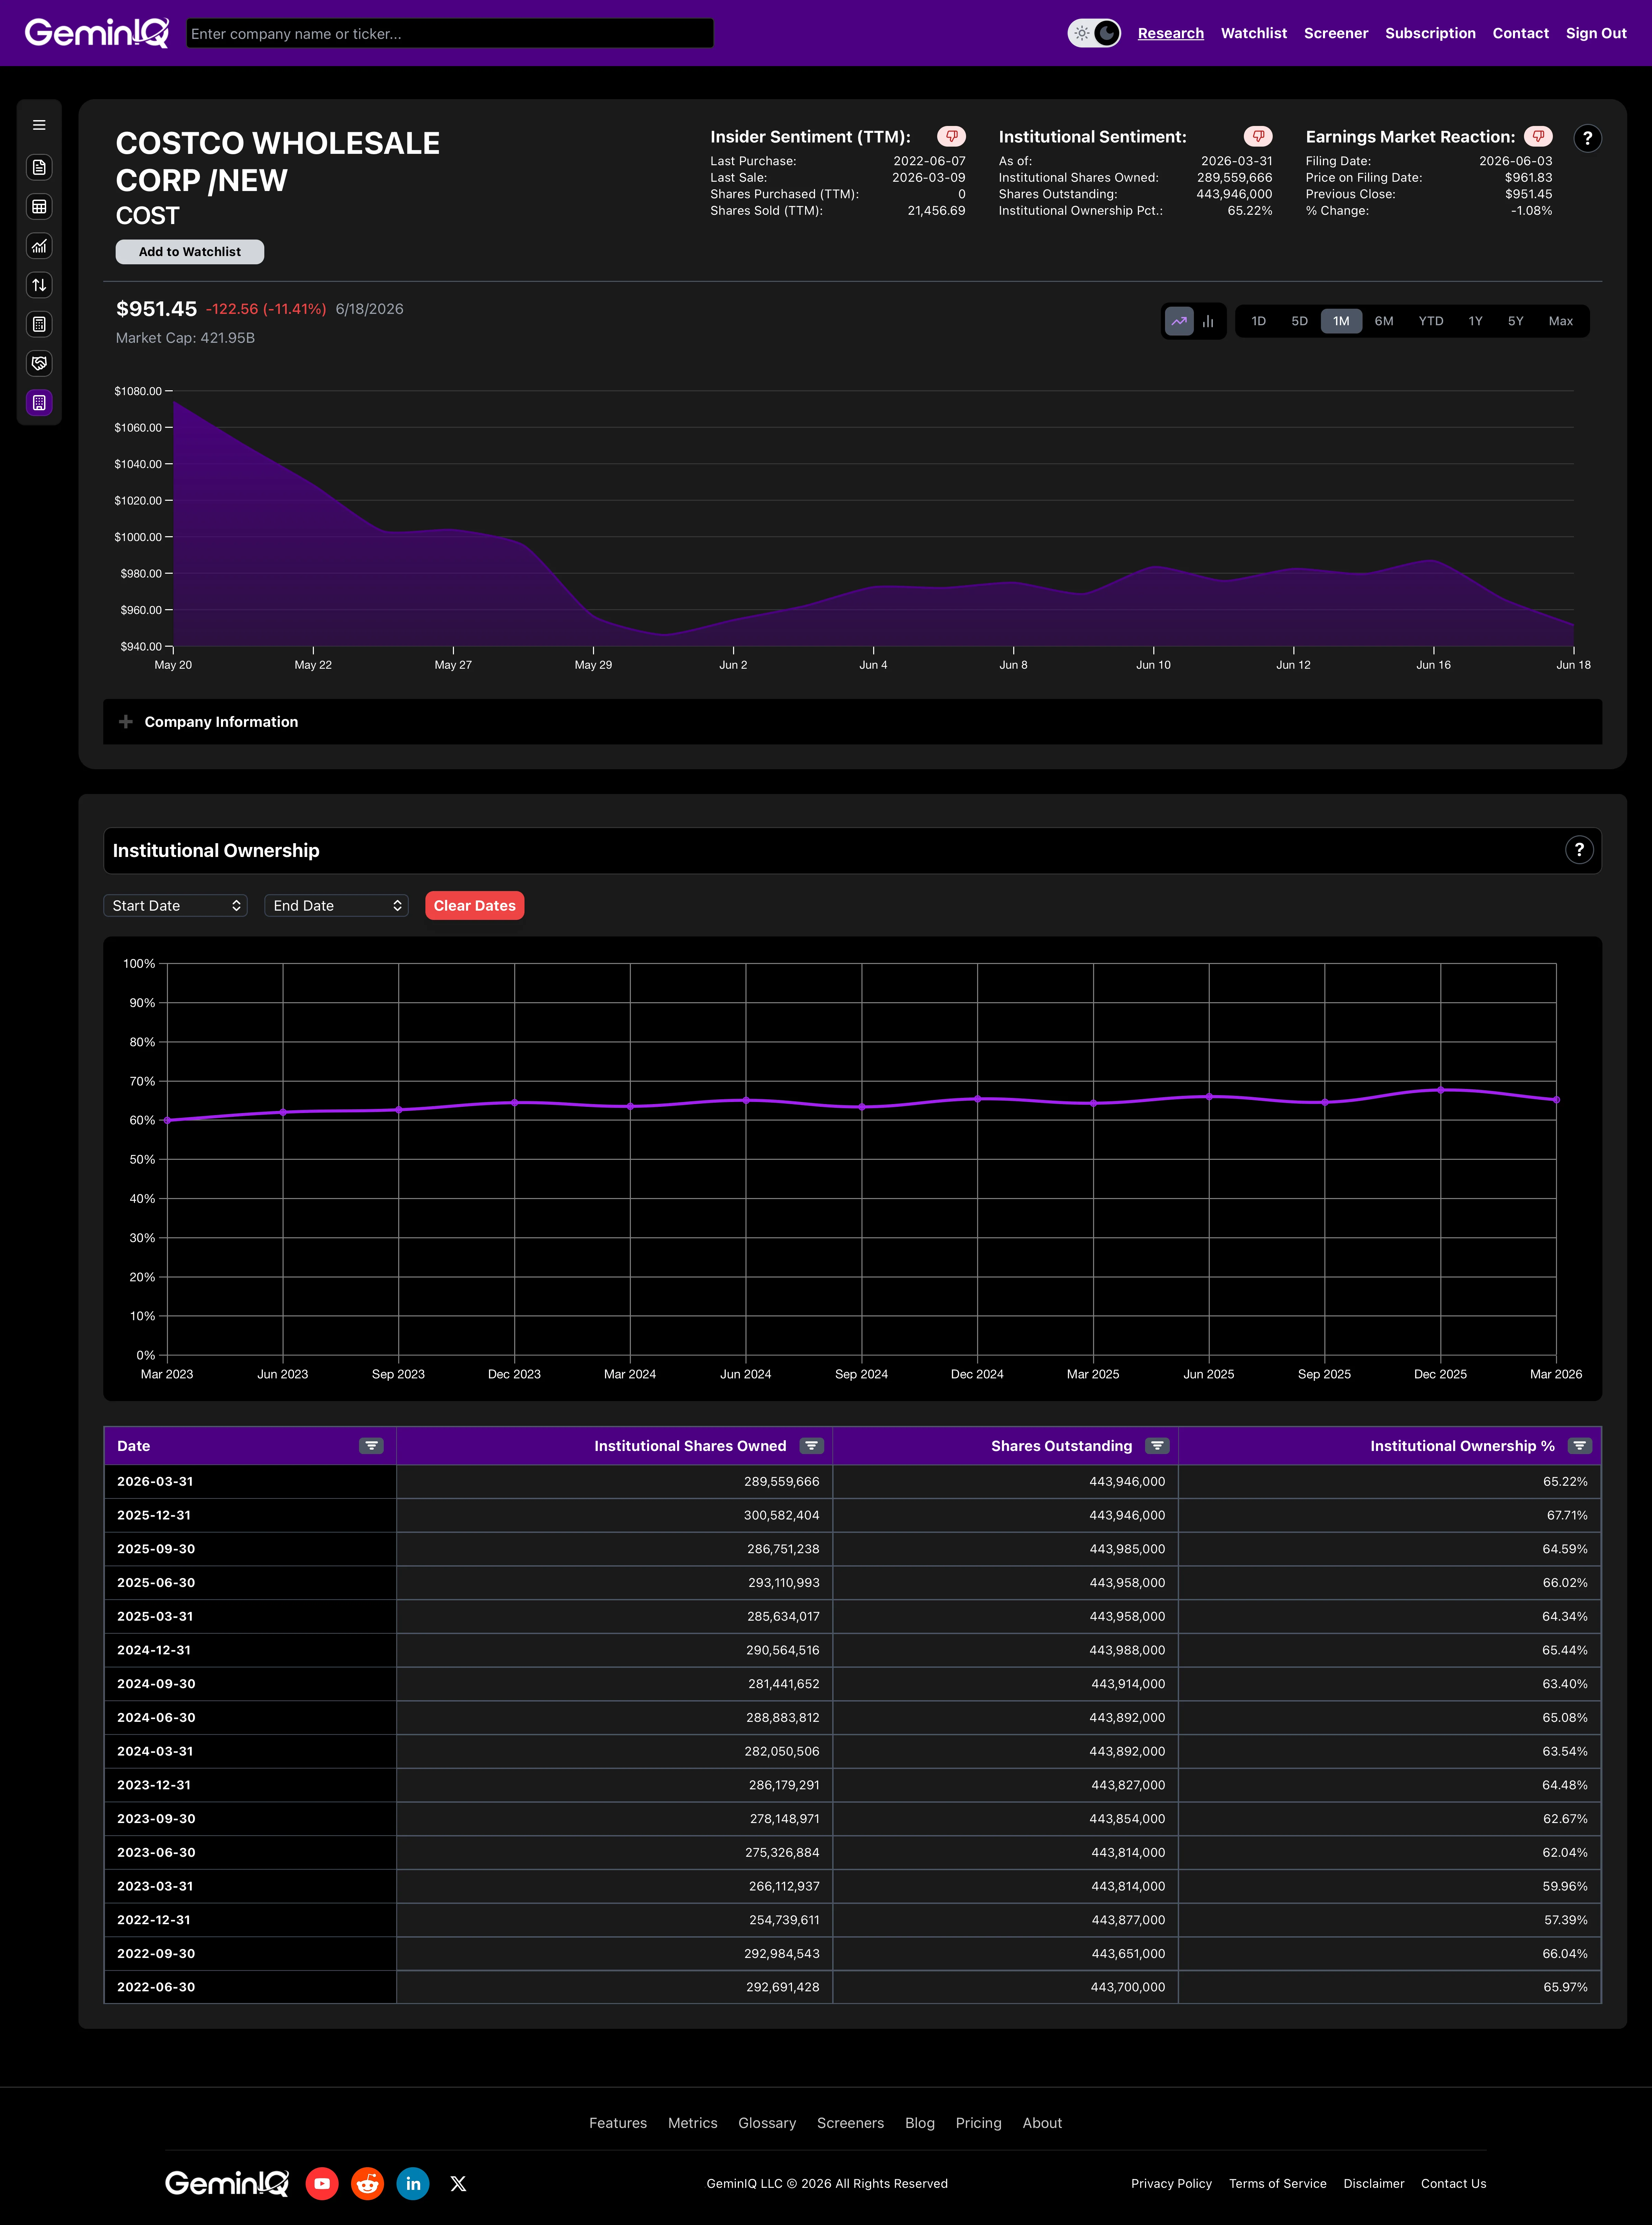
Costco's institutional ownership trajectory in GeminIQ's tracker illustrates this pattern. Total institutional ownership climbed from 57.39% in December 2022 to 67.71% by December 2025 — a sustained three-year trend across multiple quarters, not a single-quarter spike. Over the same window, total share count was essentially flat, confirming that this was genuine net buying at the aggregate level rather than a denominator effect from buybacks. That kind of multi-year, broad-based accumulation against a stable float is what confirmed institutional conviction looks like in the data.
How to Track Institutional Ownership Changes in GeminIQ
Most financial platforms display institutional ownership as a single number — the most recent 13F aggregate as a percentage. That answers only the least useful question the data set can answer.
GeminIQ's Institutional Ownership feature aggregates 13F filing data directly from SEC EDGAR and displays it as a time series, making the trajectory visible across multiple quarters rather than freezing the picture at the most recent filing date. The difference between a stock that has gone from 52% to 67% institutional ownership over six quarters and one that jumped from 52% to 67% in a single quarter is analytically enormous. The first pattern suggests sustained accumulation by a broadening base of institutional holders. The second may reflect an index inclusion, a large activist entering a position, or a one-quarter spike from passive flows. Those are entirely different setups that look identical as a single data point.
For any company you are analyzing, the workflow in GeminIQ is direct. Pull the institutional ownership time series to identify the direction and character of the trend. Is this a sustained multi-quarter accumulation or a one-quarter event? Has the holder count been rising alongside the percentage, or is the increase concentrated in a small number of large existing holders? Then cross-reference with the insider transaction timeline — available through GeminIQ's Insider Transactions module — to determine whether company management and institutional filers are moving in the same direction or diverging. A company where institutions are steadily accumulating while insiders are selling for routine compensation-related reasons is a structurally different analytical setup from one where both data streams are pointing toward an exit.
When Institutional Ownership Signals Break
Not every movement in 13F data carries the signal it appears to. Four structural conditions produce ownership readings that look like conviction trades but reflect nothing analytical.
Index inclusion is the most common, and it follows the mechanism already covered above: passive funds are forced buyers regardless of valuation. Before assigning interpretive weight to a sudden spike in the institutional ownership trend, always verify whether a major index reconstitution event falls in the same period.
Window dressing is a Q4-specific distortion. Active managers sometimes purchase recent outperformers at year-end to ensure those holdings appear in annual portfolio disclosures — an optics-driven trade, not an analytical one. Holdings that appear as new positions in a Q4 13F and disappear from the same manager's Q1 filing the following year are frequently the product of window dressing rather than a genuine investment decision. The signal test is persistence: conviction positions survive into the following quarter; window-dressed positions often do not.
ETF proliferation creates a double-counting problem in aggregate ownership data. When multiple 13F filers hold shares of an ETF that itself holds a stock, the underlying shares can be counted once for the ETF and again for each fund manager holding the ETF. This inflates the raw aggregate figure and makes the headline percentage a poor proxy for any single manager's conviction.
Spin-off residuals create a related structural distortion. When a company distributes shares of a newly independent subsidiary to its existing shareholders, every institution holding the parent receives shares of the new entity automatically. Many of these holders have no specific analytical view on the spun-off business — they received the shares as a distribution and have not yet made a decision about the position. A high institutional ownership percentage for a newly public spin-off frequently reflects this automatic distribution from the parent's holder base, not deliberate capital allocation into the new entity. It typically takes two to four quarters before the 13F data for a spin-off reflects genuine conviction positions rather than residual inherited holdings.
A single percentage pulled from any aggregator strips out exactly this kind of structural context — the difference between a number that moved because of conviction and a number that moved on its own. Reading the trajectory correctly means knowing which of these four conditions sits behind every shift in the data. That is the difference between a real accumulation signal and statistical noise wearing the shape of one.
Frequently Asked Questions
What does institutional ownership mean?
It is the percentage of a company's shares held by institutions, such as mutual funds, index funds, pension funds, hedge funds, banks, and insurers, as reported on their quarterly Form 13F filings. An institutional ownership of 70% means filers reported holding shares equal to 70% of the company's shares outstanding at quarter-end.
Is high institutional ownership good or bad?
Neither on its own. Most large US companies have high institutional ownership simply because index funds must own them. What carries information is the change: new positions, additions by active managers, and a rising count of holders. The level can also move for mechanical reasons, such as buybacks shrinking the share count or an index inclusion, with no investment decision behind it.
Who are the largest institutional investors?
The largest 13F filers by reported holdings are the big index and asset managers, led by Vanguard and BlackRock. Their size is why institutional ownership of most large-cap stocks is high, and why a change in a passive holder's stake usually reflects fund flows rather than a view on the company.
How often is institutional ownership updated?
Quarterly. Managers report holdings as of the last day of each calendar quarter and have 45 days to file, so the data is always at least 45 days old by the filing deadline, and up to about four and a half months old for a position opened early in the quarter.
Related Reading
Institutional ownership is one layer of the ownership signal. The complete cross-reference framework spans both the institutional and insider data streams together:
- How to Read a 13F Filing: Institutional Holdings Explained — the column-by-column mechanics of the filing itself, if you need the document structure before the ownership trend.
- Insider Cluster Buying Signals: What the Academic Research Actually Shows — the framework for reading multiple simultaneous insider purchases as a compound signal, and how to distinguish conviction buys from routine compensation transactions.
- How to Read SEC Form 4: Insider Buying and Selling Explained — field-by-field breakdown of the Form 4 structure and the transaction codes that determine whether a reported transaction carries any analytical weight.
- Hidden Information in SEC Filings: What Most Investors Overlook — how institutional ownership trends, insider transactions, and balance sheet signals combine into a complete fundamental picture, with Apple and Costco as worked examples.
- Complete Guide to SEC Filing Types for Investors — where the 13F fits within the full EDGAR filing ecosystem alongside 10-K, 10-Q, 8-K, 13D, and Form 4.
Wall Street's data. Main Street's price.
Institutional terminals charge thousands a year for as-filed accuracy. GeminIQ gives you the same thing for a fraction of the cost: financials built directly from raw SEC EDGAR filings, not third-party APIs, with full XBRL traceability back to the original 10-K or 10-Q. No normalized guesswork, just calculated metrics, charts, screeners, and watchlists built on numbers exactly as the company reported them. Start researching now at GeminIQ.com.
Institutional ownership figures cited in this article are drawn from quarterly 13F filings (most recent readings through Q4 2025); Apple and Costco share-count and financial figures reference their most recent 10-K filings. All SEC filings are publicly available at SEC EDGAR.
All financial figures cited in this article reference Costco Wholesale Corporation's Q3 FY2026 10-Q (filed June 3, 2026, period ending May 10, 2026). All SEC filings are publicly available at SEC EDGAR.
Disclaimer: The content in this blog is for educational and entertainment purposes only and does not constitute financial, legal, or tax advice. Investing involves risk, including the loss of principal. The views expressed are my own and not intended as financial advice or a guarantee of future performance.