
Stock-Based Compensation as a Percent of Revenue

By Chad Hartman
Published · Last updated
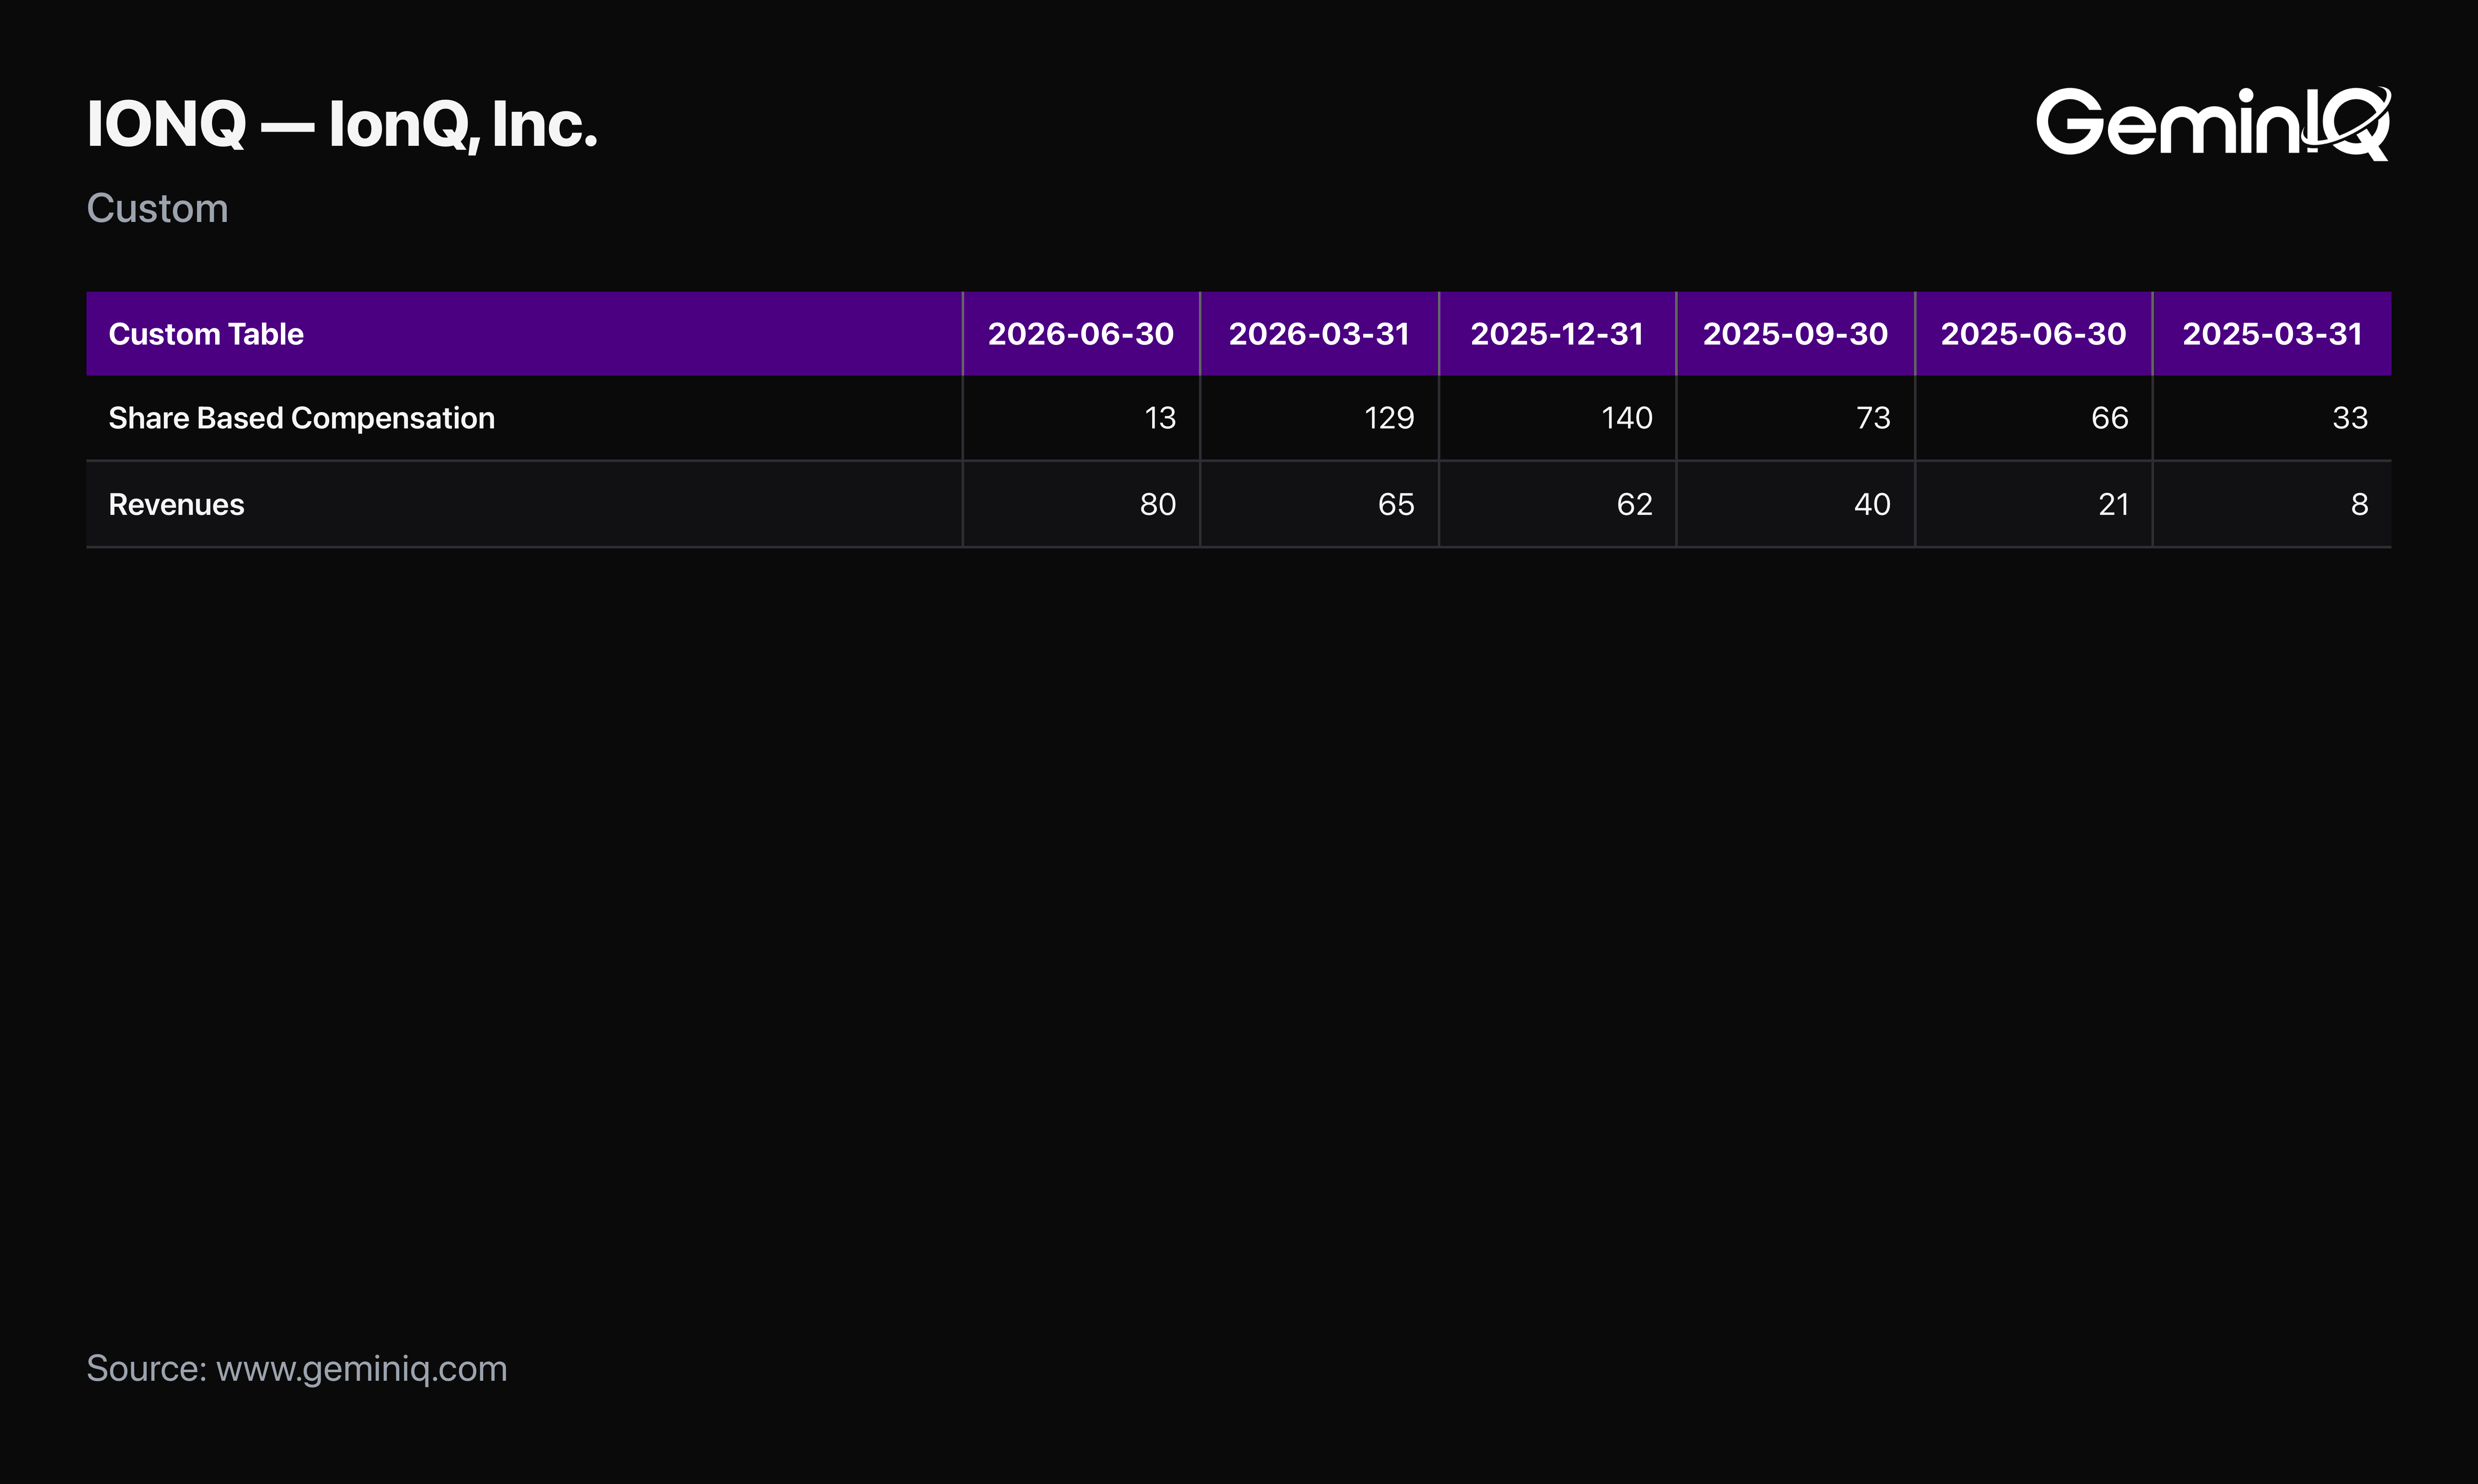
IonQ paid out $354.709 Million in trailing-twelve-month stock-based compensation against $246.474 Million in trailing revenue — stock compensation equal to 143.9% of everything the company brought in. Stock Compensation as a share of revenue — GeminIQ's Stock-Based Compensation to Revenue metric — is one of the cleanest single-line checks on how much of a company's reported growth is being funded by handing out equity rather than earned as economic profit, and it requires no adjustment or estimate: both figures sit on the filing itself.
This leaderboard reads GeminIQ's calculated Stock Compensation and Net Revenue figures across GeminIQ's current cross-sectional filing snapshot — 6,095 companies with data through at least February 2025 — restricted to companies with at least $100 Million in trailing revenue. 2,446 companies meet that bar, ranked by stock compensation as a percentage of trailing revenue.
The Ranking
| Rank | Company | Ticker | Stock Compensation (TTM) | Net Revenue (TTM) | SBC as % of Revenue |
|---|---|---|---|---|---|
| 1 | IonQ, Inc. | IONQ | $354.709 Million | $246.474 Million | 143.9% |
| 2 | Joby Aviation, Inc. | JOBY | $153.300 Million | $116.295 Million | 131.8% |
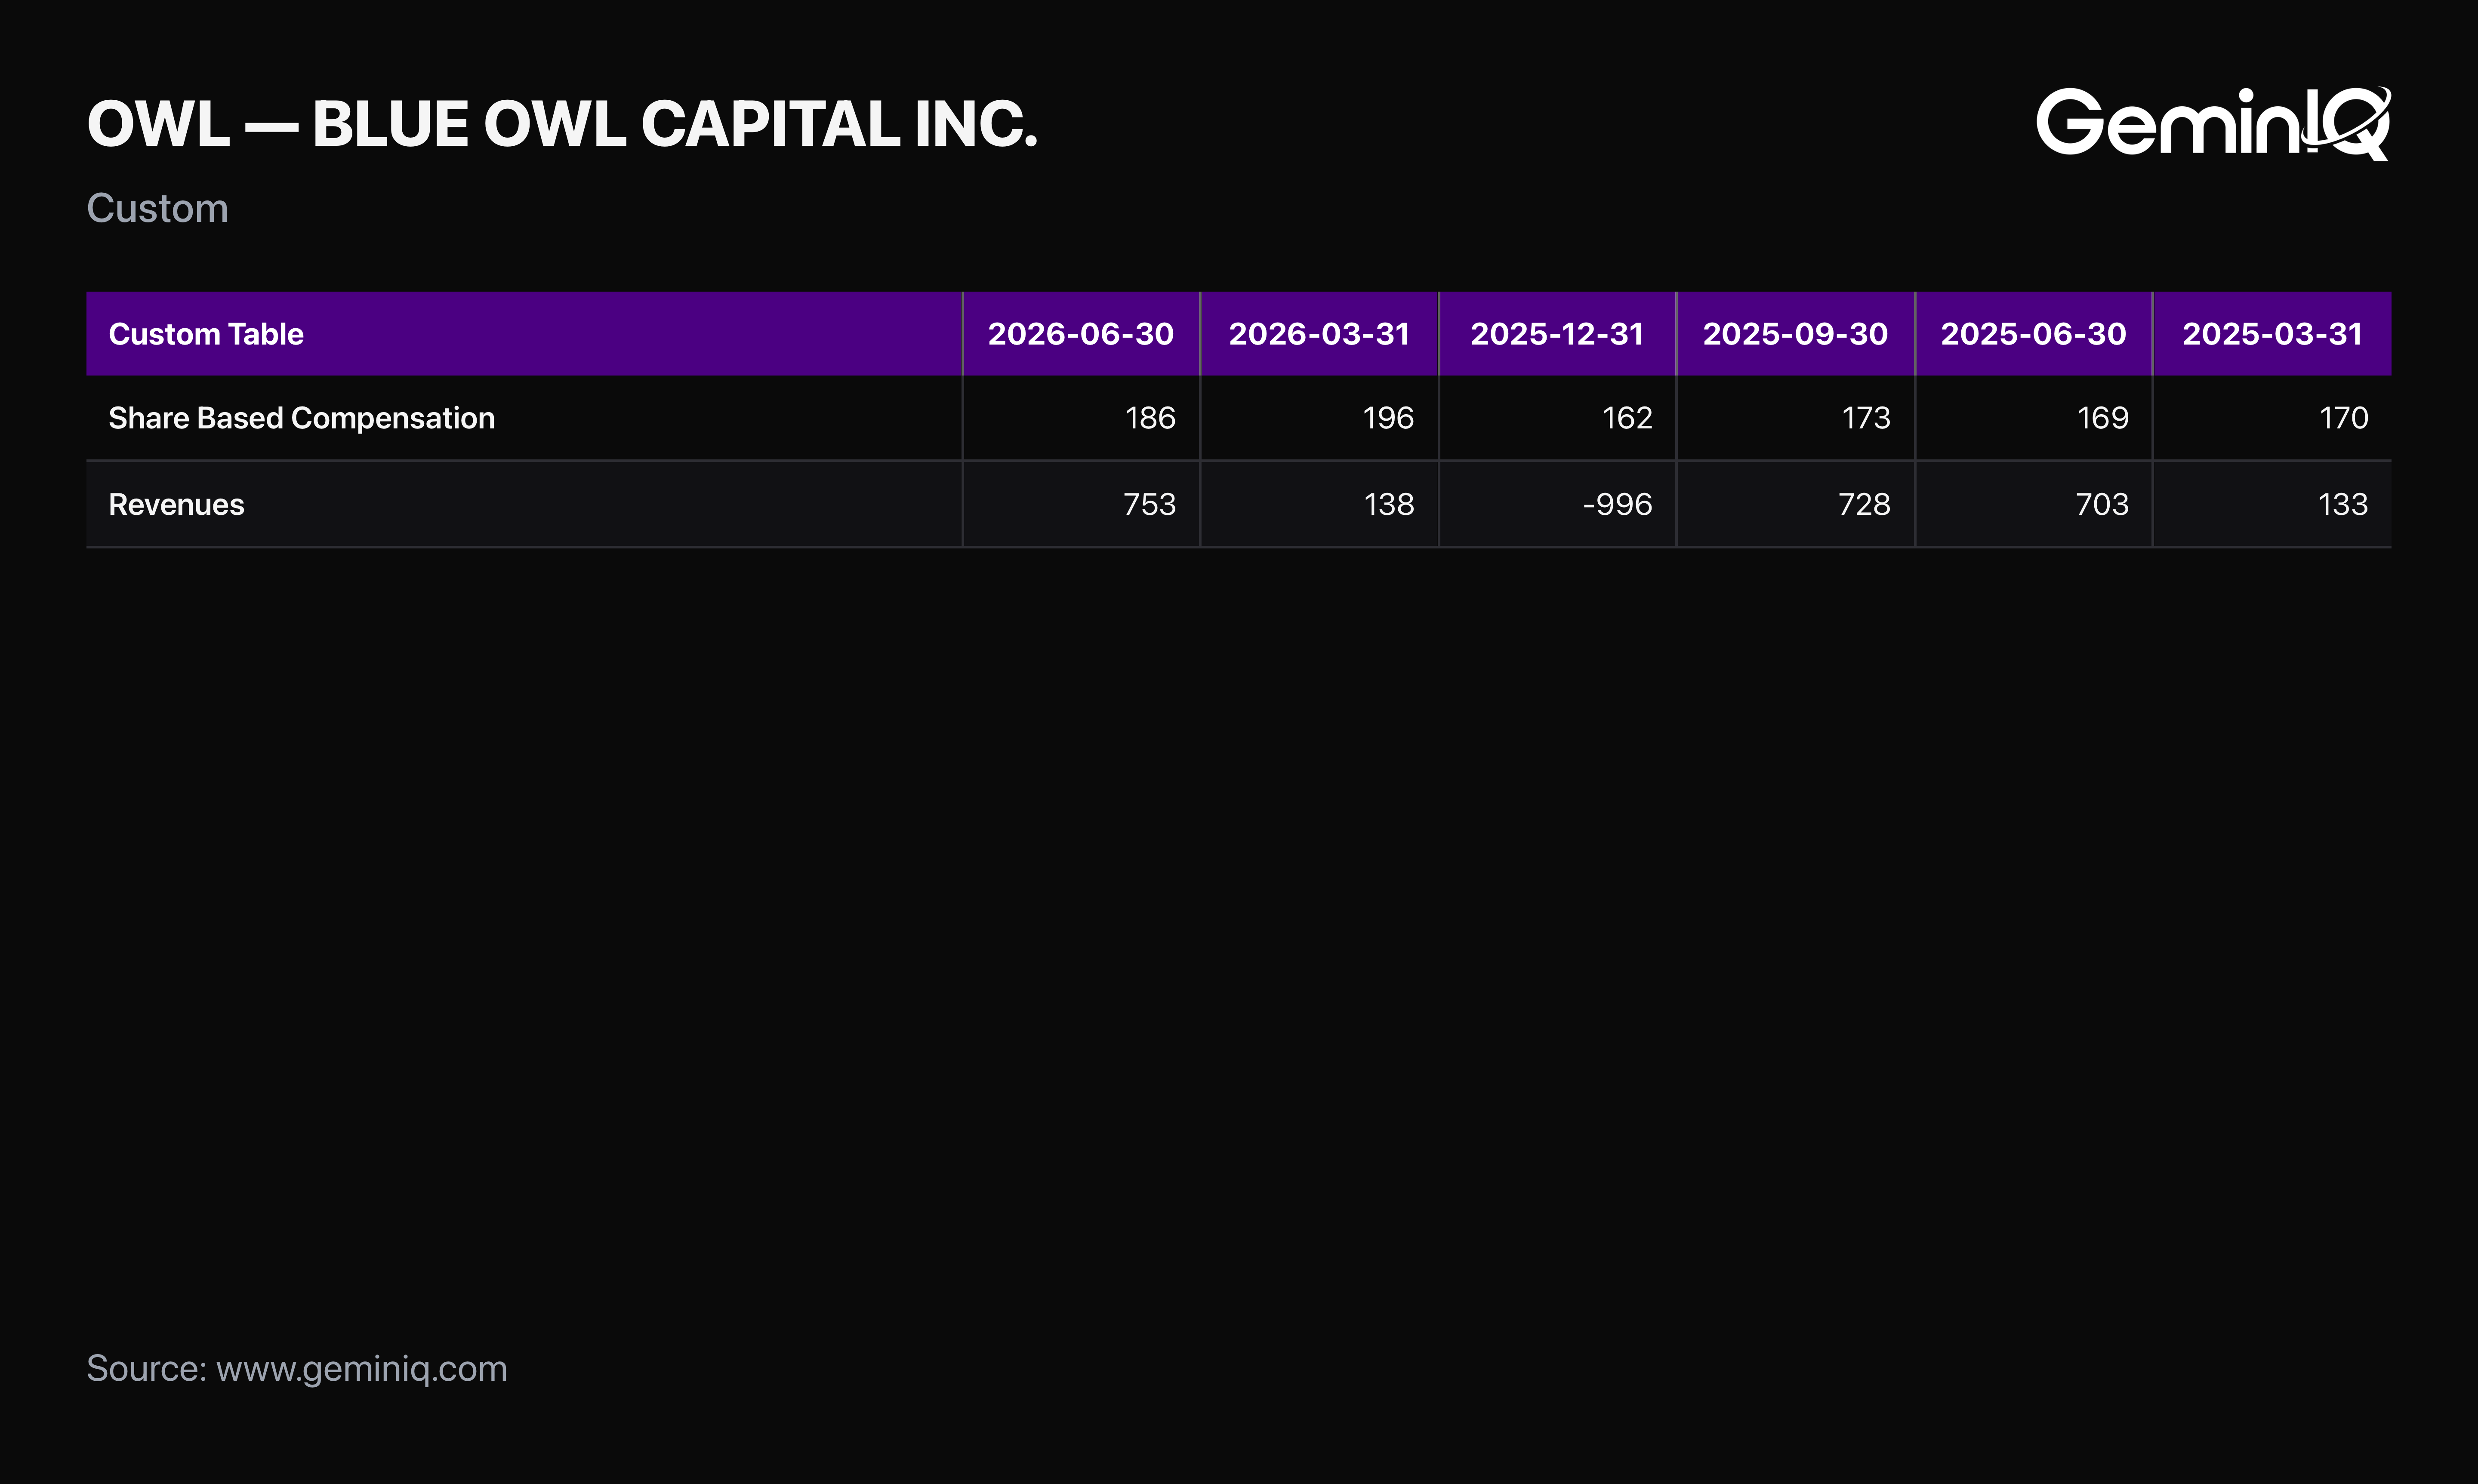
| 3 | Blue Owl Capital Inc. | OWL | $716.191 Million | $623.172 Million | 114.9% |
| 4 | C3.ai, Inc. | AI | $263.715 Million | $250.268 Million | 105.4% |
| 5 | Figma, Inc. | FIG | $1,554.575 Million | $1,509.670 Million | 103.0% |
| 6 | StepStone Group Inc. | STEP | $1,910.368 Million | $2,008.205 Million | 95.1% |
| 7 | AST SpaceMobile, Inc. | ASTS | $100.432 Million | $115.299 Million | 87.1% |
| 8 | Hinge Health, Inc. | HNGE | $662.101 Million | $843.886 Million | 78.5% |
| 9 | Freedom Holding Corp. | FRHC | $91.282 Million | $121.732 Million | 75.0% |
| 10 | Ginkgo Bioworks Holdings, Inc. | DNA | $86.854 Million | $132.421 Million | 65.6% |
| 11 | Kymera Therapeutics, Inc. | KYMR | $63.426 Million | $105.000 Million | 60.4% |
| 12 | Arcus Biosciences, Inc. | RCUS | $68.000 Million | $117.000 Million | 58.1% |
| 13 | Beam Therapeutics Inc. | BEAM | $89.155 Million | $156.035 Million | 57.1% |
| 14 | StubHub Holdings, Inc. | STUB | $1,516.676 Million | $2,764.301 Million | 54.9% |
| 15 | SpringWorks Therapeutics, Inc. | — | $108.626 Million | $200.123 Million | 54.3% |
IonQ: Stock Compensation Exceeds Total Revenue
IonQ tops this leaderboard at 143.9% — trailing stock compensation larger than the company's entire trailing revenue. IonQ operates in quantum computing, a category where the underlying technology is still early and the labor market for the specialized talent required is both narrow and expensive, which is reflected directly in this ratio rather than left to a company's own characterization of its cost structure.
Joby Aviation: A Pre-Revenue-Scale Aerospace Story
Joby Aviation ranks second at 131.8%, with $153.300 Million in stock compensation against $116.295 Million in trailing revenue. Joby is developing electric vertical takeoff and landing aircraft, a capital- and talent-intensive category still in early commercialization, and the ratio here reflects a company paying today for engineering talent its revenue base has not yet grown to support.
Blue Owl Capital: The Largest Dollar Figure Outside Software
Blue Owl Capital ranks third at 114.9%, and stands out on this list for what it isn't: a pre-revenue technology or biotech name. Blue Owl is an alternative asset manager, and its $716.191 Million in stock compensation against $623.172 Million in trailing revenue shows the same dynamic — equity-heavy compensation outrunning the top line — showing up in a completely different industry than the rest of the leaderboard.
The Method
Stock Compensation and Net Revenue are both GeminIQ calculated figures, built directly from as-filed cash flow statement and income statement data on a trailing-twelve-month basis. The ranking is restricted to companies with at least $100 Million in trailing revenue, to exclude small or newly-reporting companies where the ratio can be driven by a thin revenue base rather than a truly large compensation figure. Full methodology is covered in How GeminIQ Builds Filing Data Studies.
Check Your Holdings
Pull up any position's Stock Compensation and Net Revenue on GeminIQ's Financial Statements view and divide one by the other directly. A ratio climbing toward or past 50% of revenue is worth tracking over several periods — whether it's narrowing as the business scales, or holding flat while revenue grows, tells a different story than a single period's figure on its own.
Frequently Asked Questions
What does it mean when stock-based compensation exceeds 100% of revenue?
It means a company's trailing stock-based compensation expense is larger than its entire trailing revenue. This is most common at early-stage, technically specialized companies — quantum computing, advanced aerospace, and similarly talent-intensive categories are represented at the top of this leaderboard — where the labor cost of building the business currently outweighs the revenue the business has scaled to.
How many companies are in this ranking's universe?
2,446 companies with at least $100 Million in trailing revenue and a calculated Stock Compensation figure, drawn from GeminIQ's current 6,095-company filing snapshot.
Is a high stock-compensation-to-revenue ratio always a warning sign?
Not on its own. Early-stage, technically specialized businesses commonly run high ratios while scaling toward profitability, and several names on this leaderboard are pre-profitability by design at this stage. The more useful check is the trend over several periods — whether the ratio is narrowing as revenue scales, which is the pattern a maturing business is expected to show.
Does this ranking include financial companies?
Yes. Unlike a free-cash-flow comparison, a stock-compensation-to-revenue ratio doesn't depend on how a company's cash flow statement behaves, so this leaderboard includes companies like Blue Owl Capital, an alternative asset manager, alongside the technology and biotech names that otherwise dominate the list.
Wall Street's data. Main Street's price.
Institutional terminals charge thousands a year for as-filed accuracy. GeminIQ gives you the same thing for a fraction of the cost: financials built directly from raw SEC EDGAR filings, not third-party APIs, with full XBRL traceability back to the original 10-K or 10-Q. No normalized guesswork, just calculated metrics, charts, screeners, and watchlists built on numbers exactly as the company reported them. Start researching now at GeminIQ.com.
Data Appendix: Universe drawn from GeminIQ's calculated Stock Compensation and Net Revenue metrics across GeminIQ's current cross-sectional filing snapshot of 6,095 companies, restricted to companies with at least $100 Million in trailing revenue (2,446 companies), built from as-filed 10-K and 10-Q data publicly available on SEC EDGAR. Methodology: How GeminIQ Builds Filing Data Studies.
Disclaimer: The content in this blog is for educational and entertainment purposes only and does not constitute financial, legal, or tax advice. Investing involves risk, including the loss of principal. The views expressed are my own and not intended as financial advice or a guarantee of future performance.