
Alphabet Annual Report (2026): Free Cash Flow Went Flat

By Chad Hartman
Published · Last updated
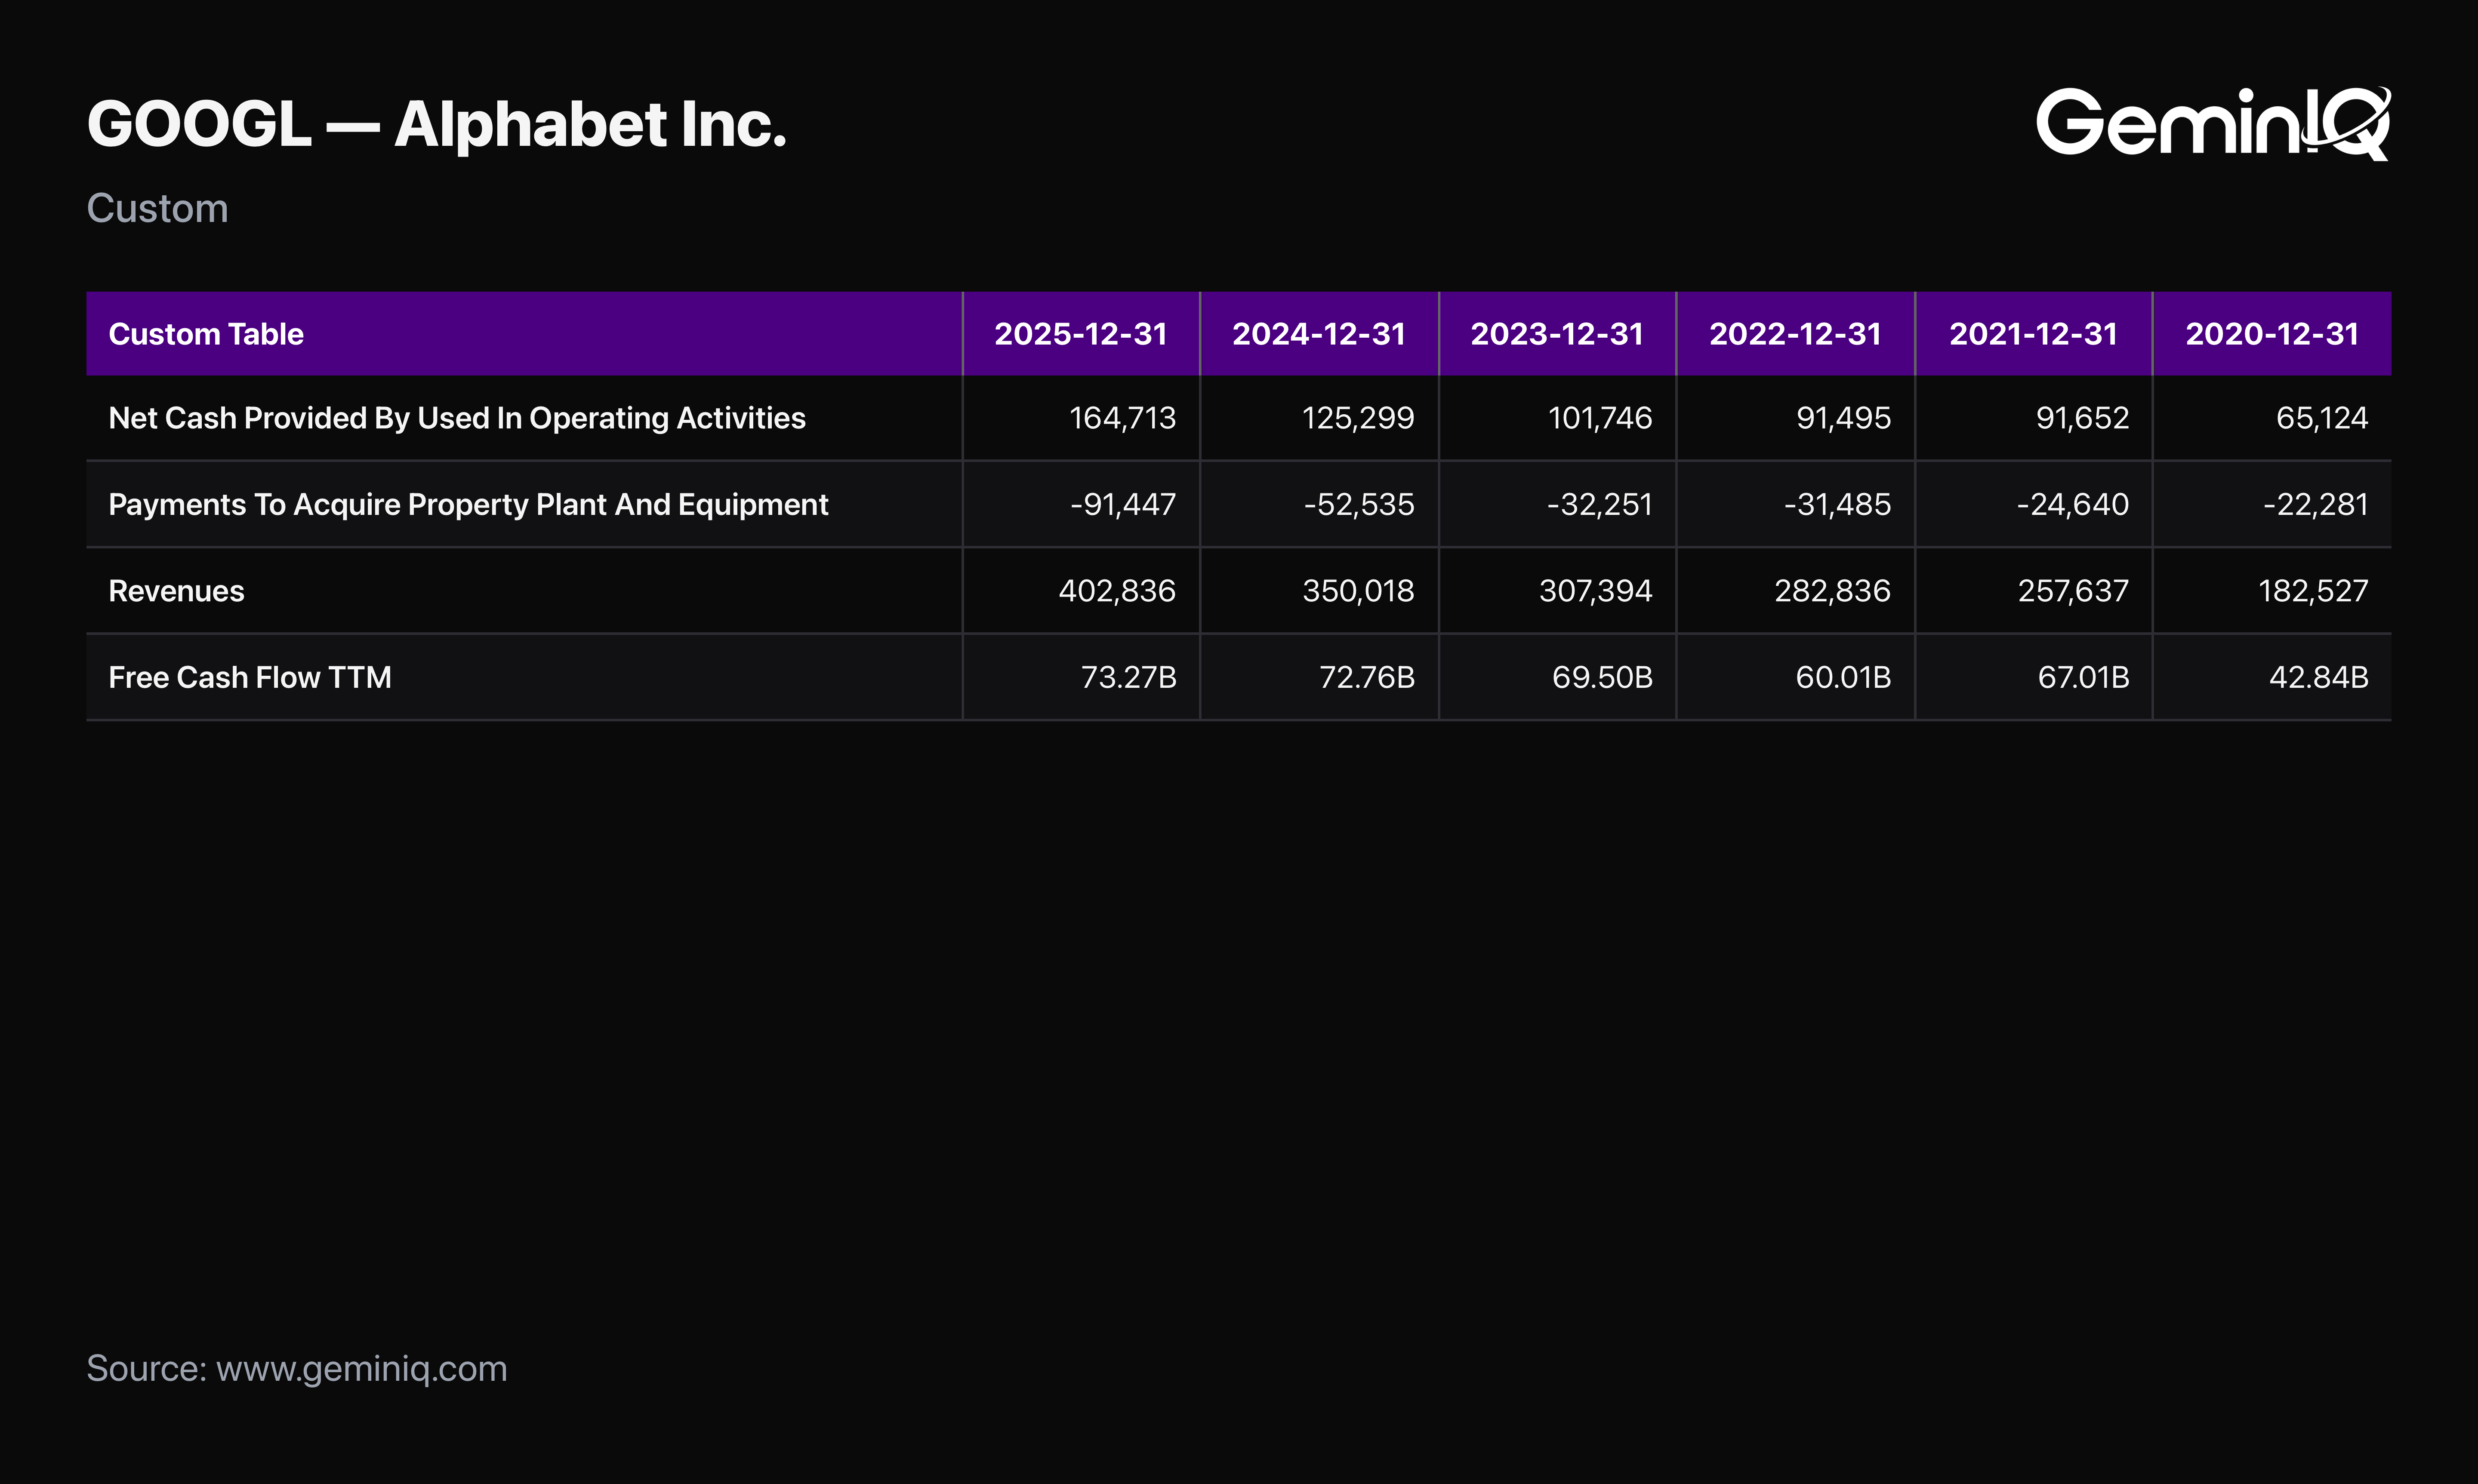
Alphabet ($GOOGL) filed its FY2025 10-K on February 5, 2026. Revenue grew 15.1% to $402.84 Billion. Operating cash flow grew 31.5% to $164.71 Billion, an increase of $39.41 Billion in a single year. Free cash flow grew 0.7%. Not 7%. Zero point seven, from $72.76 Billion to $73.27 Billion. Capital expenditure rose $38.91 Billion over the same twelve months, which means 98.7% of every incremental dollar of operating cash Alphabet generated in FY2025 went straight back out the door as capital spending.
| Field | Value |
|---|---|
| Ticker | $GOOGL |
| Filing | FY2025 10-K |
| Filed | February 5, 2026 |
| Period End | December 31, 2025 |
| Operating Cash Flow (FY2025) | $164.71 Billion |
| Capital Expenditure (FY2025) | $91.45 Billion |
| Free Cash Flow (FY2025) | $73.27 Billion |
| Free Cash Flow Growth | +0.7% |
The Cash Flow That Didn't Move
Three growth rates from the same filing, covering the same twelve months, tell three different stories about the same company.
The Data: Alphabet's Revenues reached $402.84 Billion, up 15.1% from $350.02 Billion. Net Cash Provided By Operating Activities climbed to $164.71 Billion from $125.30 Billion, a gain of $39.41 Billion and a growth rate of 31.5%. Purchases Of Property And Equipment went to $91.45 Billion from $52.54 Billion, a gain of $38.91 Billion and a growth rate of 74.1%. GeminIQ's pre-calculated Free Cash Flow finished at $73.27 Billion against $72.76 Billion the prior year, an increase of $504 Million on a base of roughly $73 Billion.
Divide the capital spending increase by the operating cash increase and the year resolves to a single number: 98.7%. Alphabet generated $39.41 Billion more cash from operations than it did in FY2024 and kept about $500 Million of it.
The GeminIQ Edge: Operating cash flow and free cash flow sit on the same statement, one derived from the other, and a platform showing you the first as a headline growth metric is telling you something true and incomplete. Reading both series from Financial Statements across the same years is what turns a 31.5% cash flow story into a 0.7% one.
The Spending Is Larger Than the Cash Number Shows
The $91.45 Billion capital expenditure figure understates what Alphabet actually committed during the year, and the filing says so on its own cash flow statement.
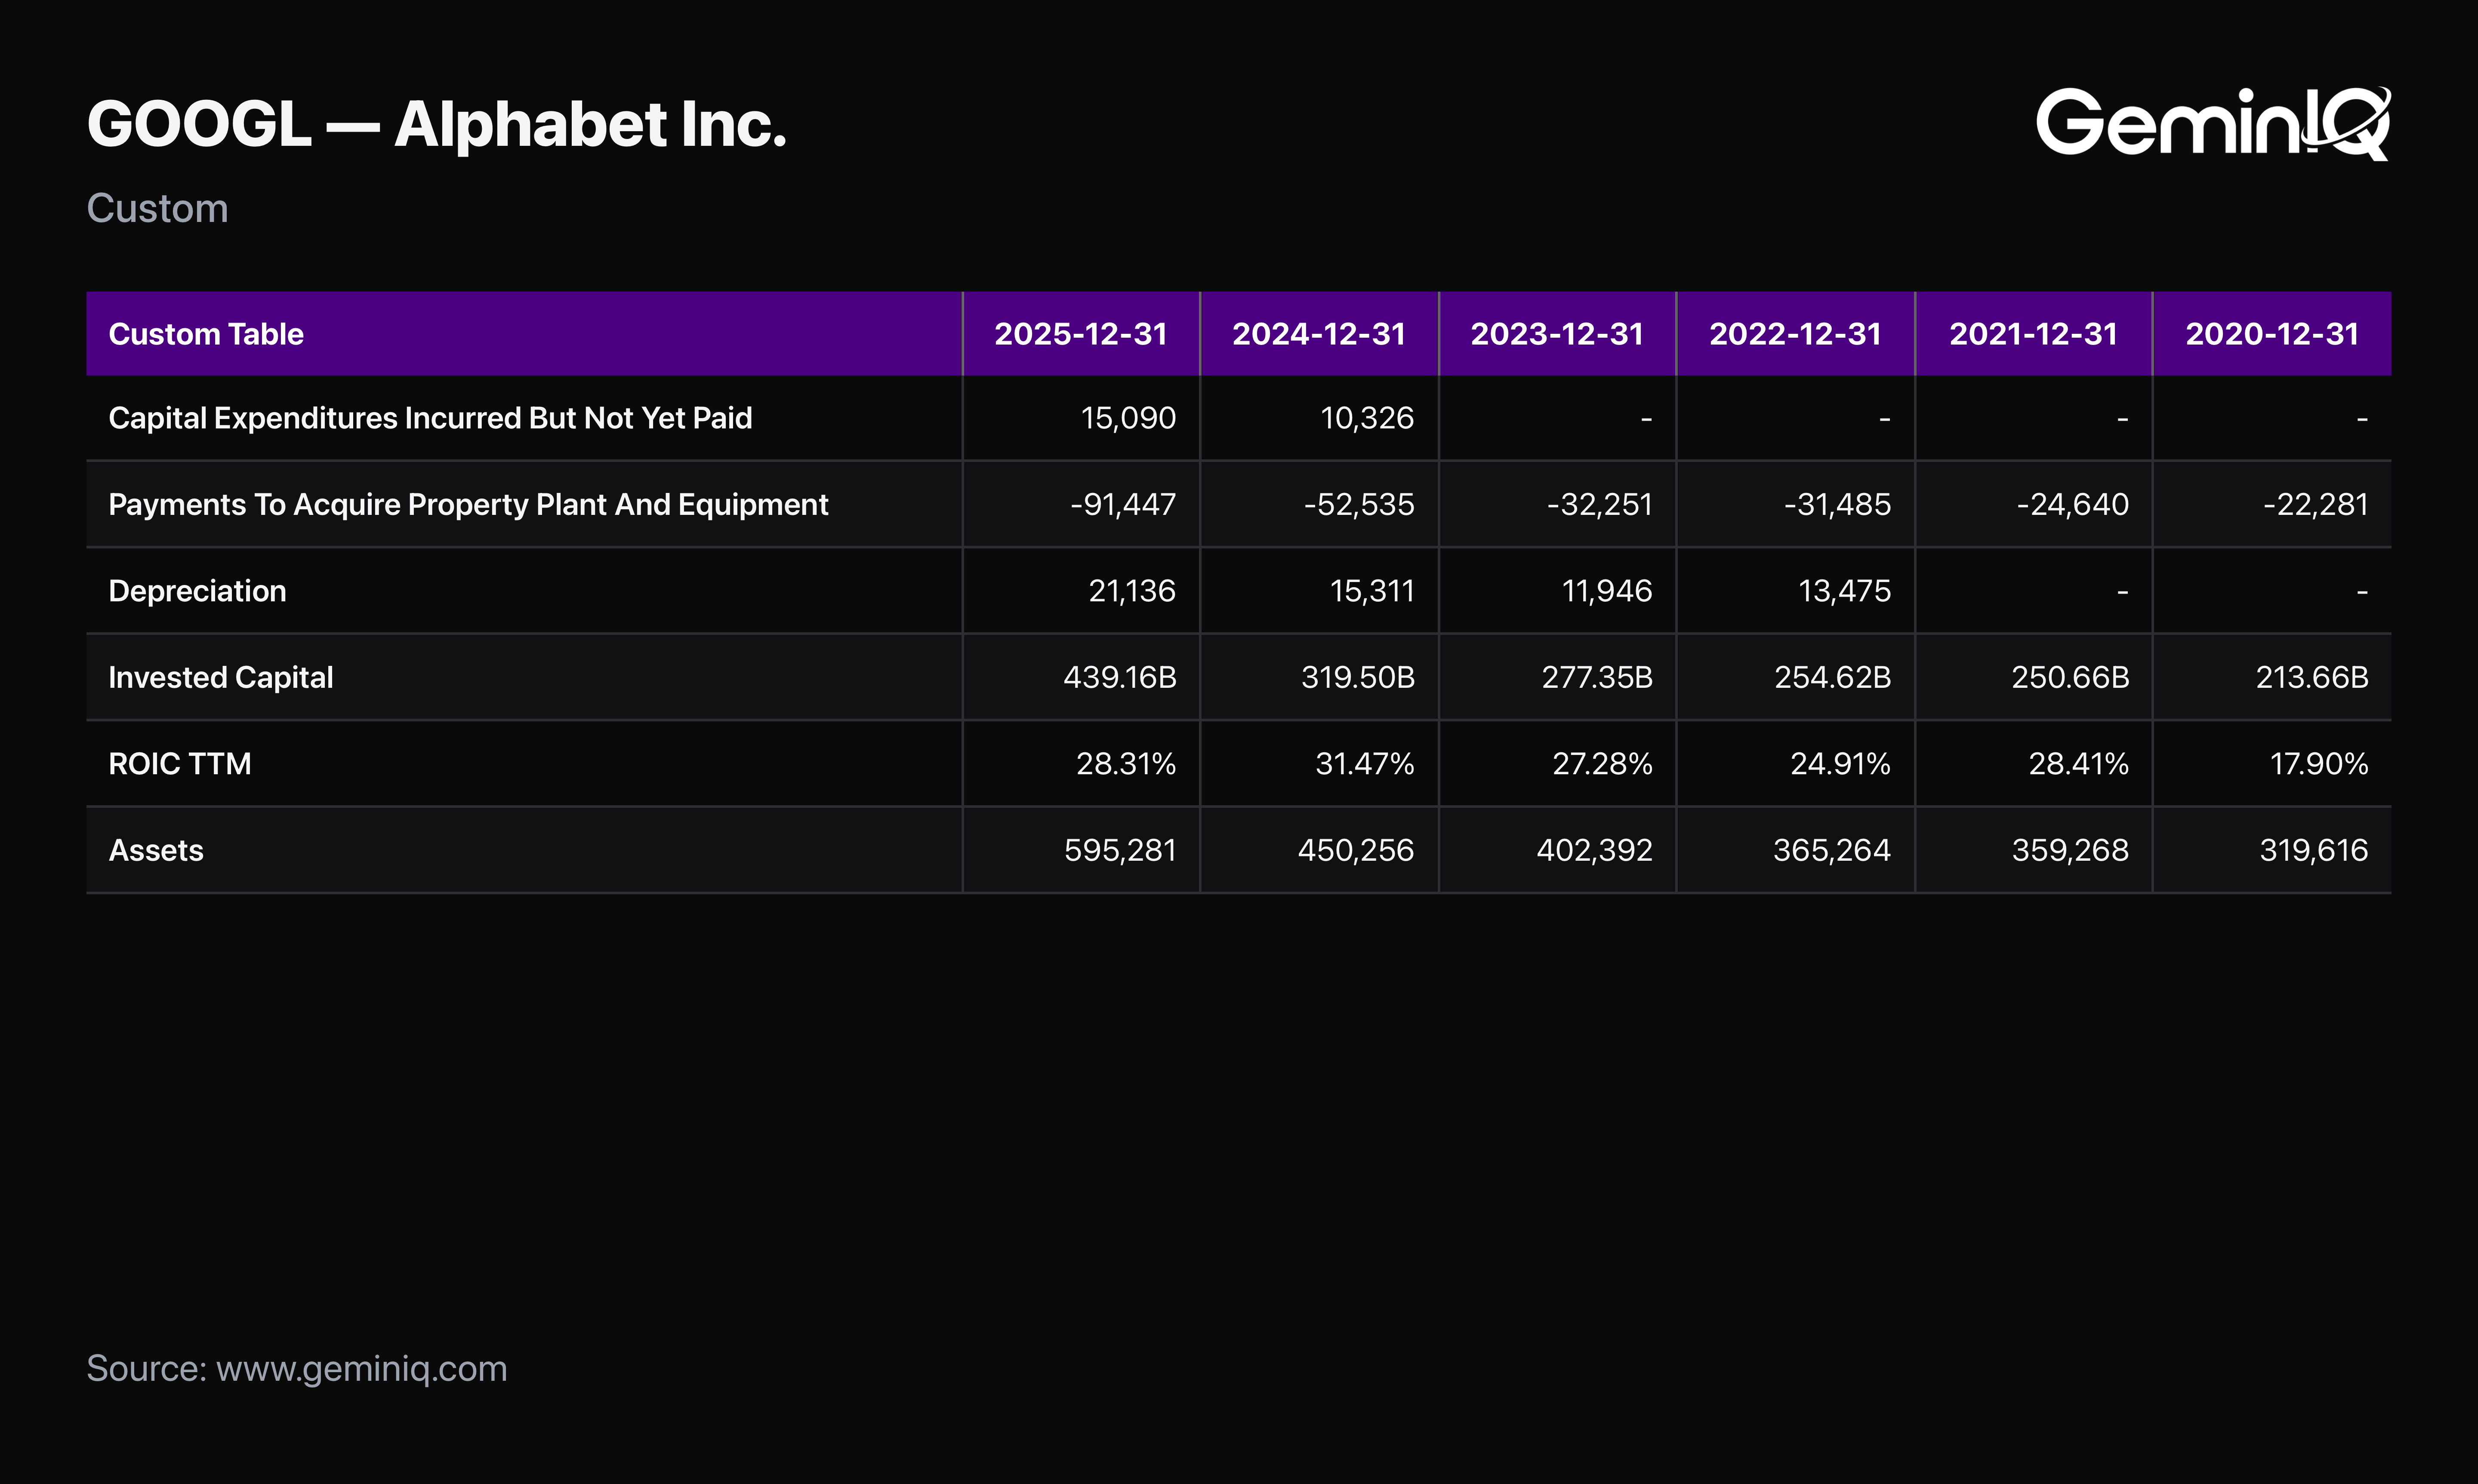
The Data: A separate line, Purchases Of Property And Equipment Included In Accrued Liabilities And Accounts Payable, filed as Capital Expenditures Incurred But Not Yet Paid, stood at $15.09 Billion at the end of FY2025, up from $10.33 Billion. That is capital expenditure Alphabet has committed to and recognized but had not yet paid in cash as of the balance sheet date.
The scale relative to the existing asset base is the other measure worth having. Depreciation Of Property And Equipment for FY2025 was $21.14 Billion. Alphabet spent 4.33x its depreciation charge on new property and equipment, up from 3.43x in FY2024. GeminIQ's Invested Capital rose to $439.2 Billion from $319.5 Billion, a 37.5% increase, and Total Assets grew 32.2% to $595.3 Billion against that 15.1% revenue growth. Return on Invested Capital fell to 28.31% from 31.47%.
The GeminIQ Edge: Accrued capital expenditure is one of the least-read lines on a cash flow statement and it exists precisely because the cash figure and the commitment figure diverge. A company spending 4.33x depreciation is replacing its asset base several times faster than the accounting is recognizing the cost of it.
What Got Cut to Pay for It
Flat free cash flow against rising shareholder-return commitments forces a choice, and the financing section shows which one Alphabet made.
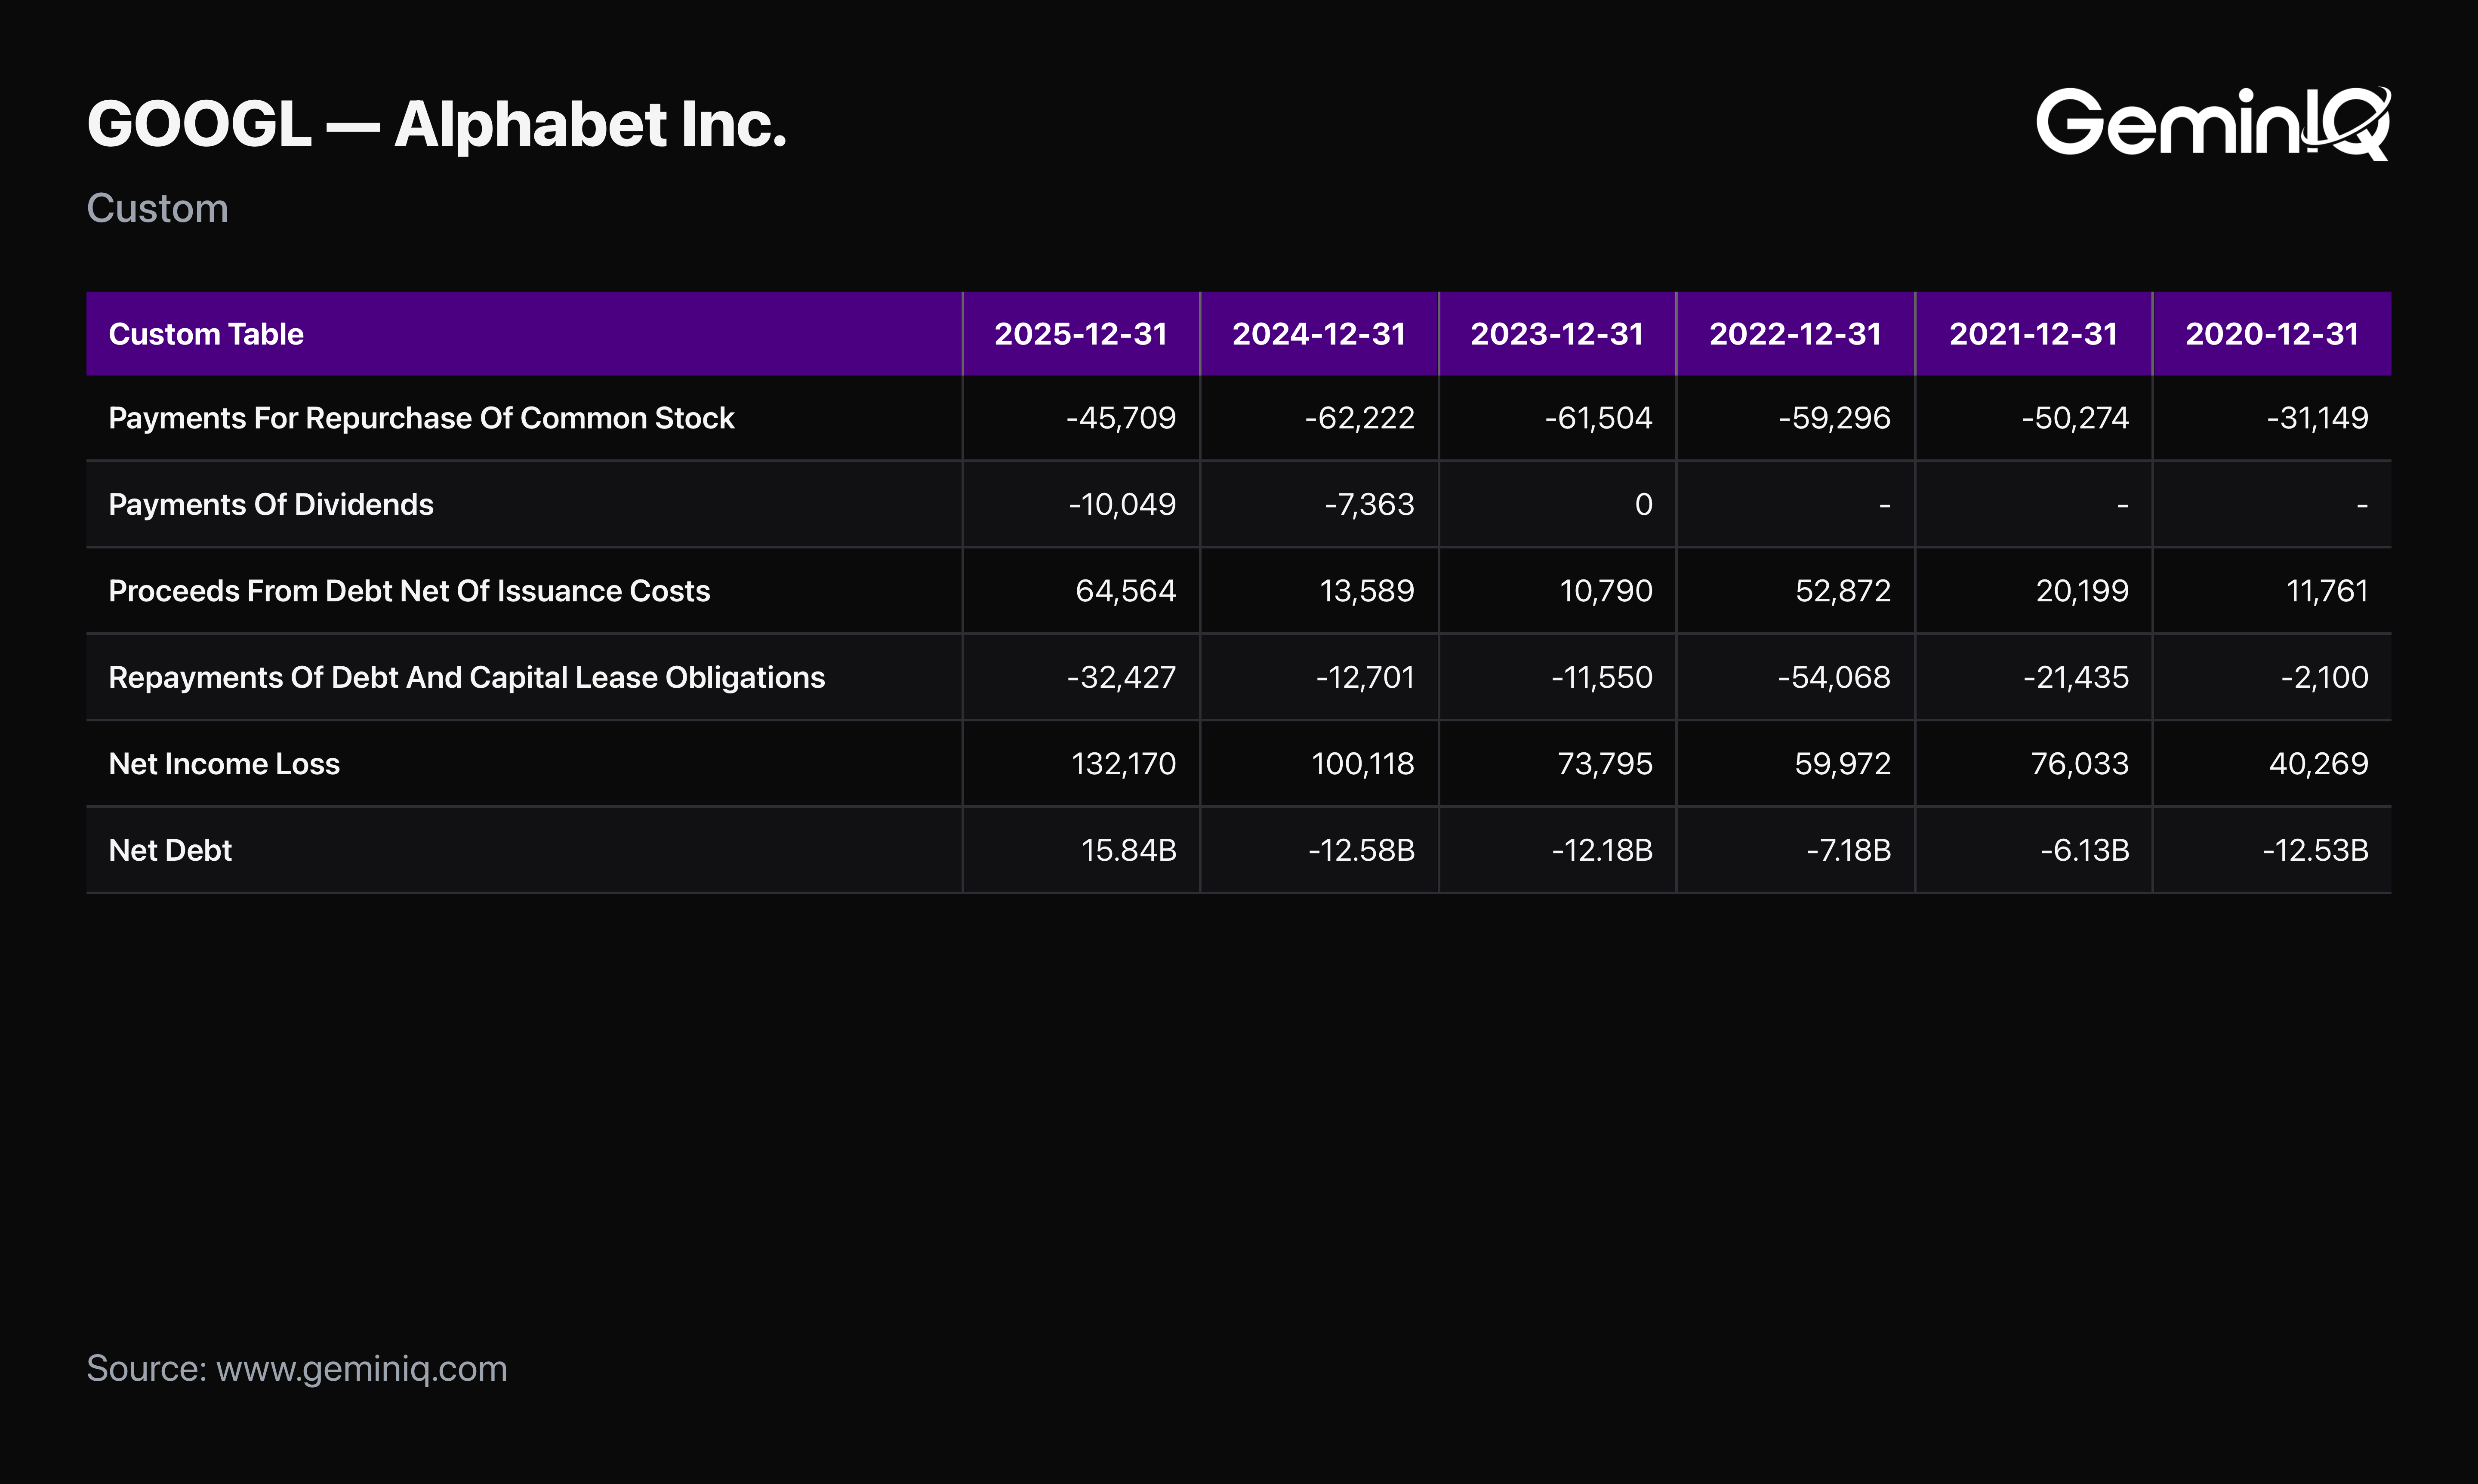
The Data: Repurchases Of Stock, filed as Payments For Repurchase Of Common Stock, fell to $45.71 Billion in FY2025 from $62.22 Billion, a reduction of 26.5%. Alphabet cut its buyback by $16.51 Billion in a fiscal year when Net Income rose 32.0%, from $100.12 Billion to $132.17 Billion. Dividend Payments moved the other way, rising to $10.05 Billion from $7.36 Billion.
The balance sheet absorbed the remainder. Proceeds From Issuance Of Debt, Net Of Costs came to $64.56 Billion against $13.59 Billion the prior year. GeminIQ's Net Debt turned positive at $15.84 Billion, the first net debt position in the eleven fiscal years on file. Every prior year in the window shows a net cash position.
The GeminIQ Edge: Buyback reductions rarely get their own headline, because a company that keeps buying back stock at all reads as a company returning capital. The comparison that matters is directional: net income up 32.0%, repurchases down 26.5%, in the same twelve months.
What the Market Paid for Flat Cash
Price and free cash flow moved in opposite directions by a wide margin during FY2025.
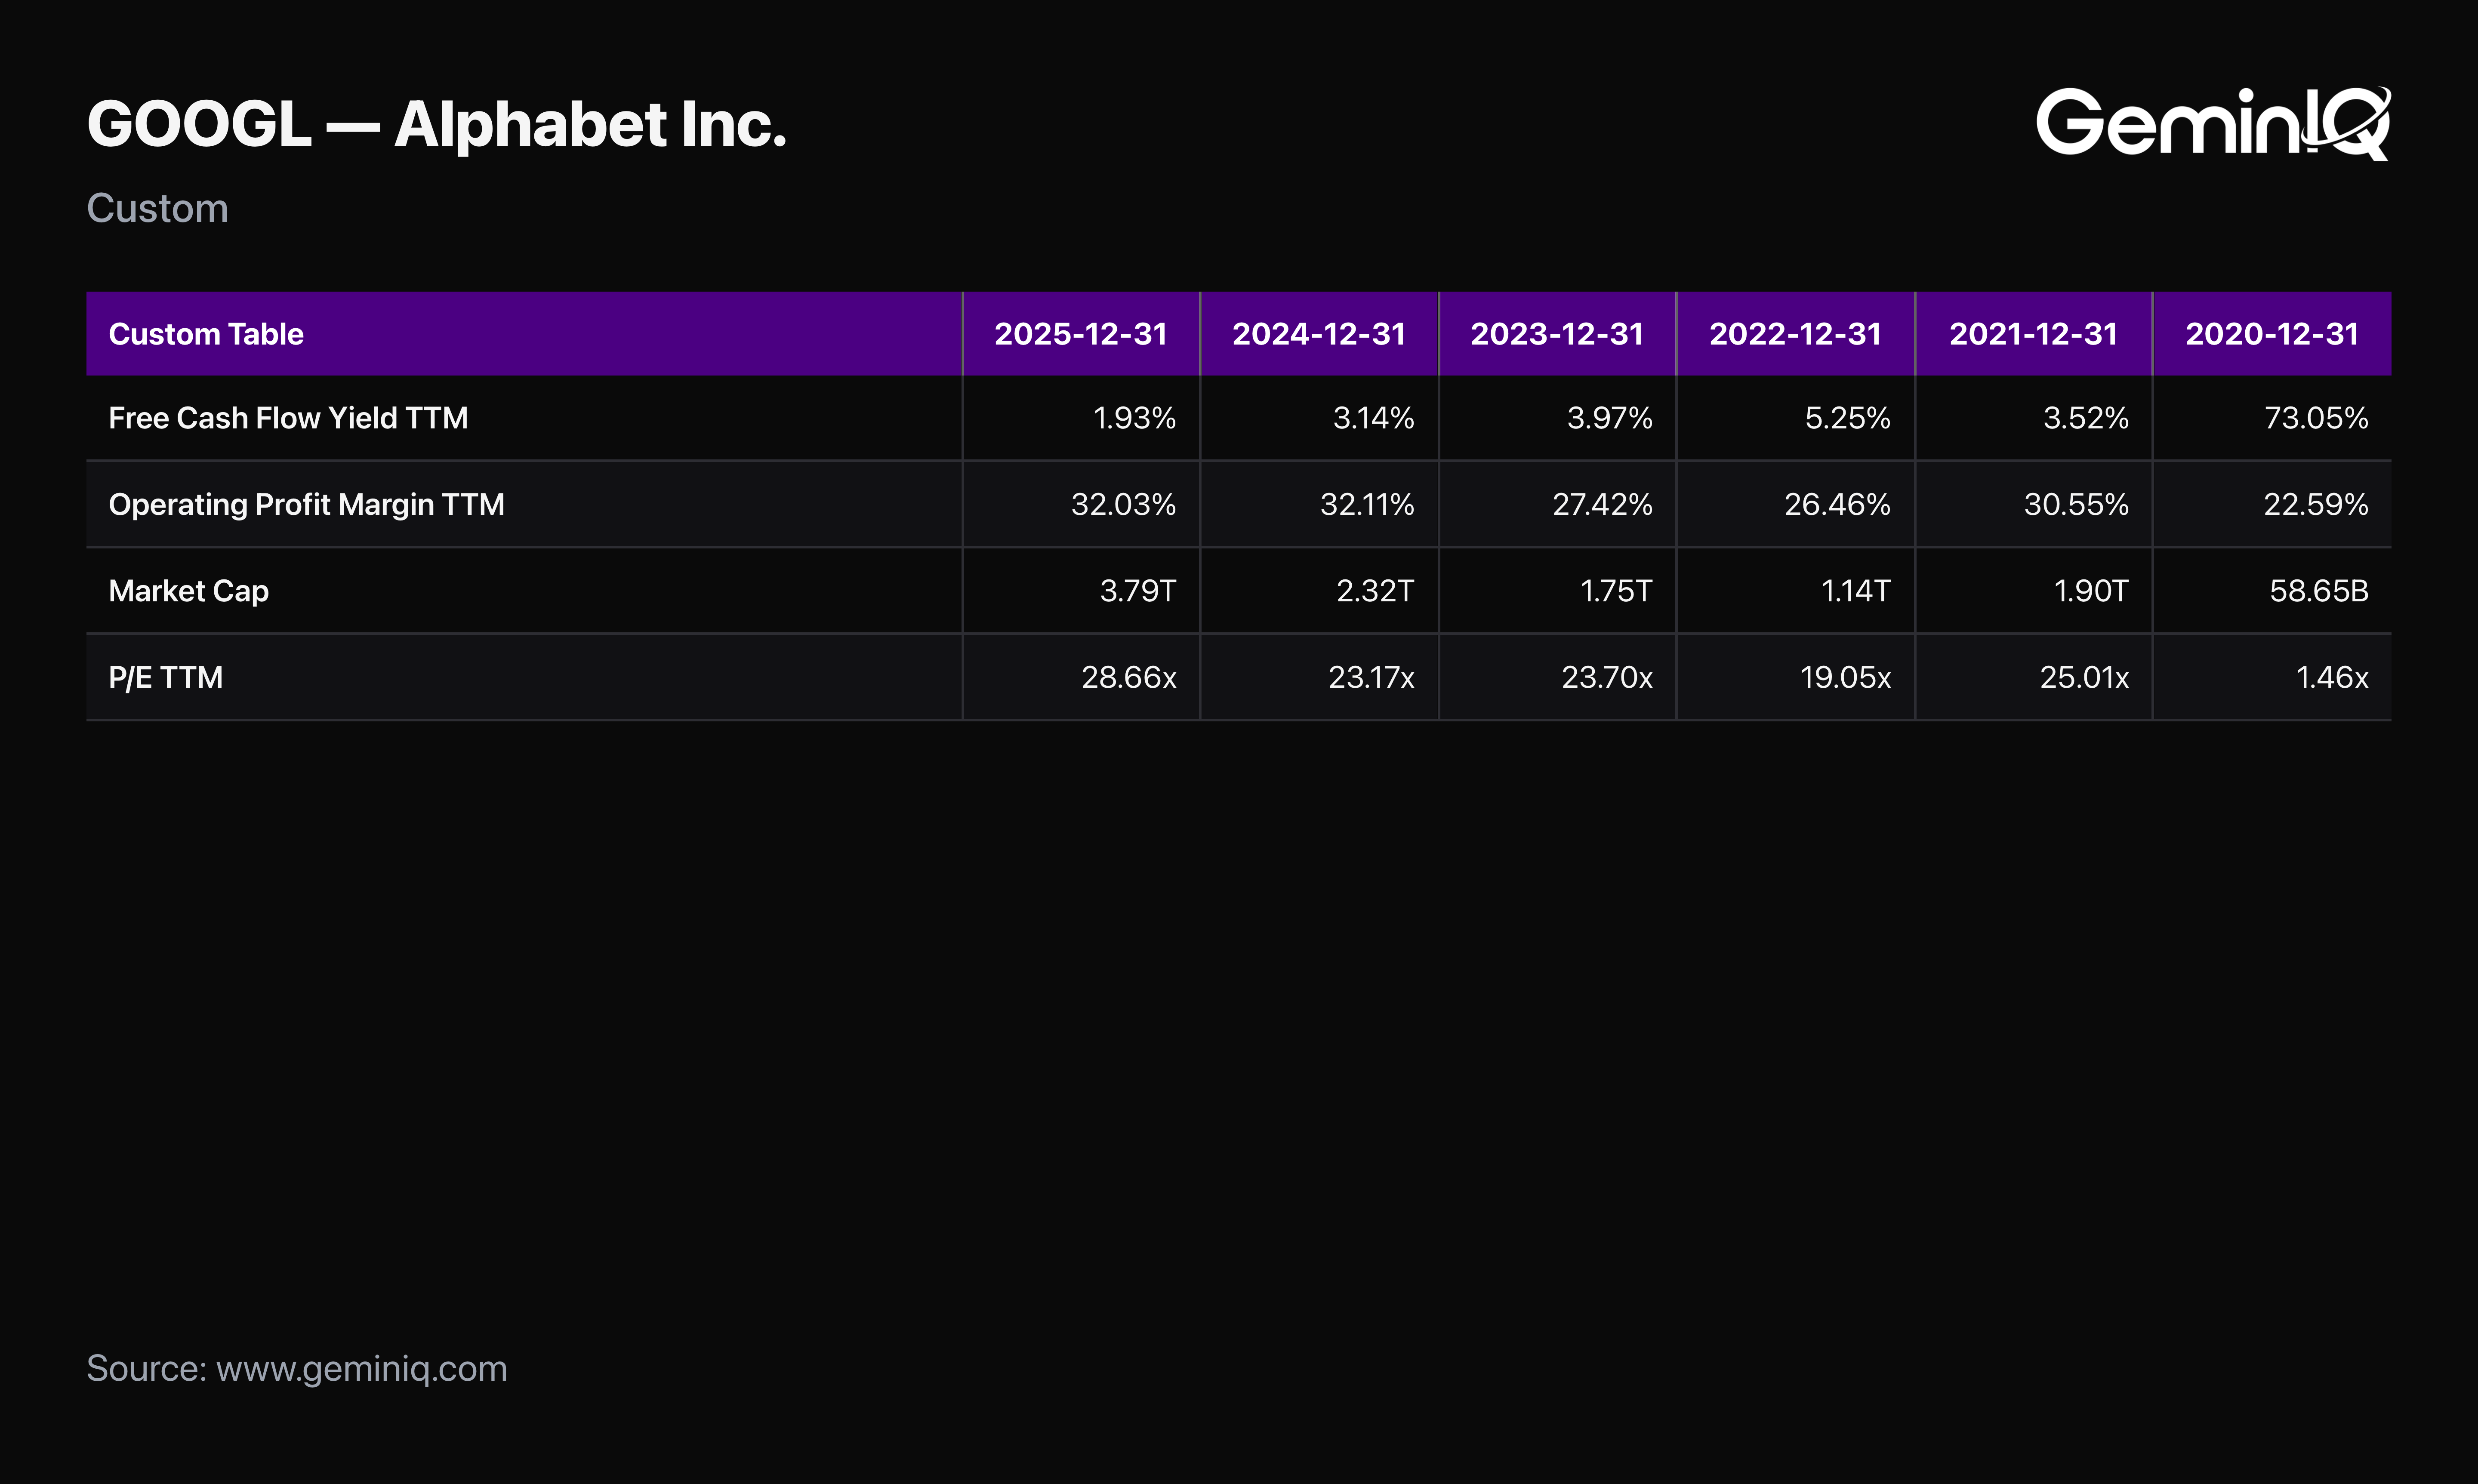
The Data: Alphabet's market capitalization rose from $2.320 Trillion to $3.787 Trillion across the fiscal year, an increase of 63.3%, while free cash flow rose 0.7%. GeminIQ's Free Cash Flow Yield fell to 1.93% from 3.14% as a direct consequence. The trailing price-to-earnings ratio finished at 28.66.
Operating margin held steady through all of this. GeminIQ's Operating Profit Margin came in at 32.03% against 32.11% the prior year, essentially unchanged, so nothing in the income statement signals the cash flow story at all.
The GeminIQ Edge: A stable operating margin and a collapsing free cash flow yield in the same year is the clearest possible demonstration that the income statement and the cash flow statement answer different questions. One of them showed nothing unusual in FY2025.
Smart Money and the Insider Record
What are the people actually running the company doing with their own money?
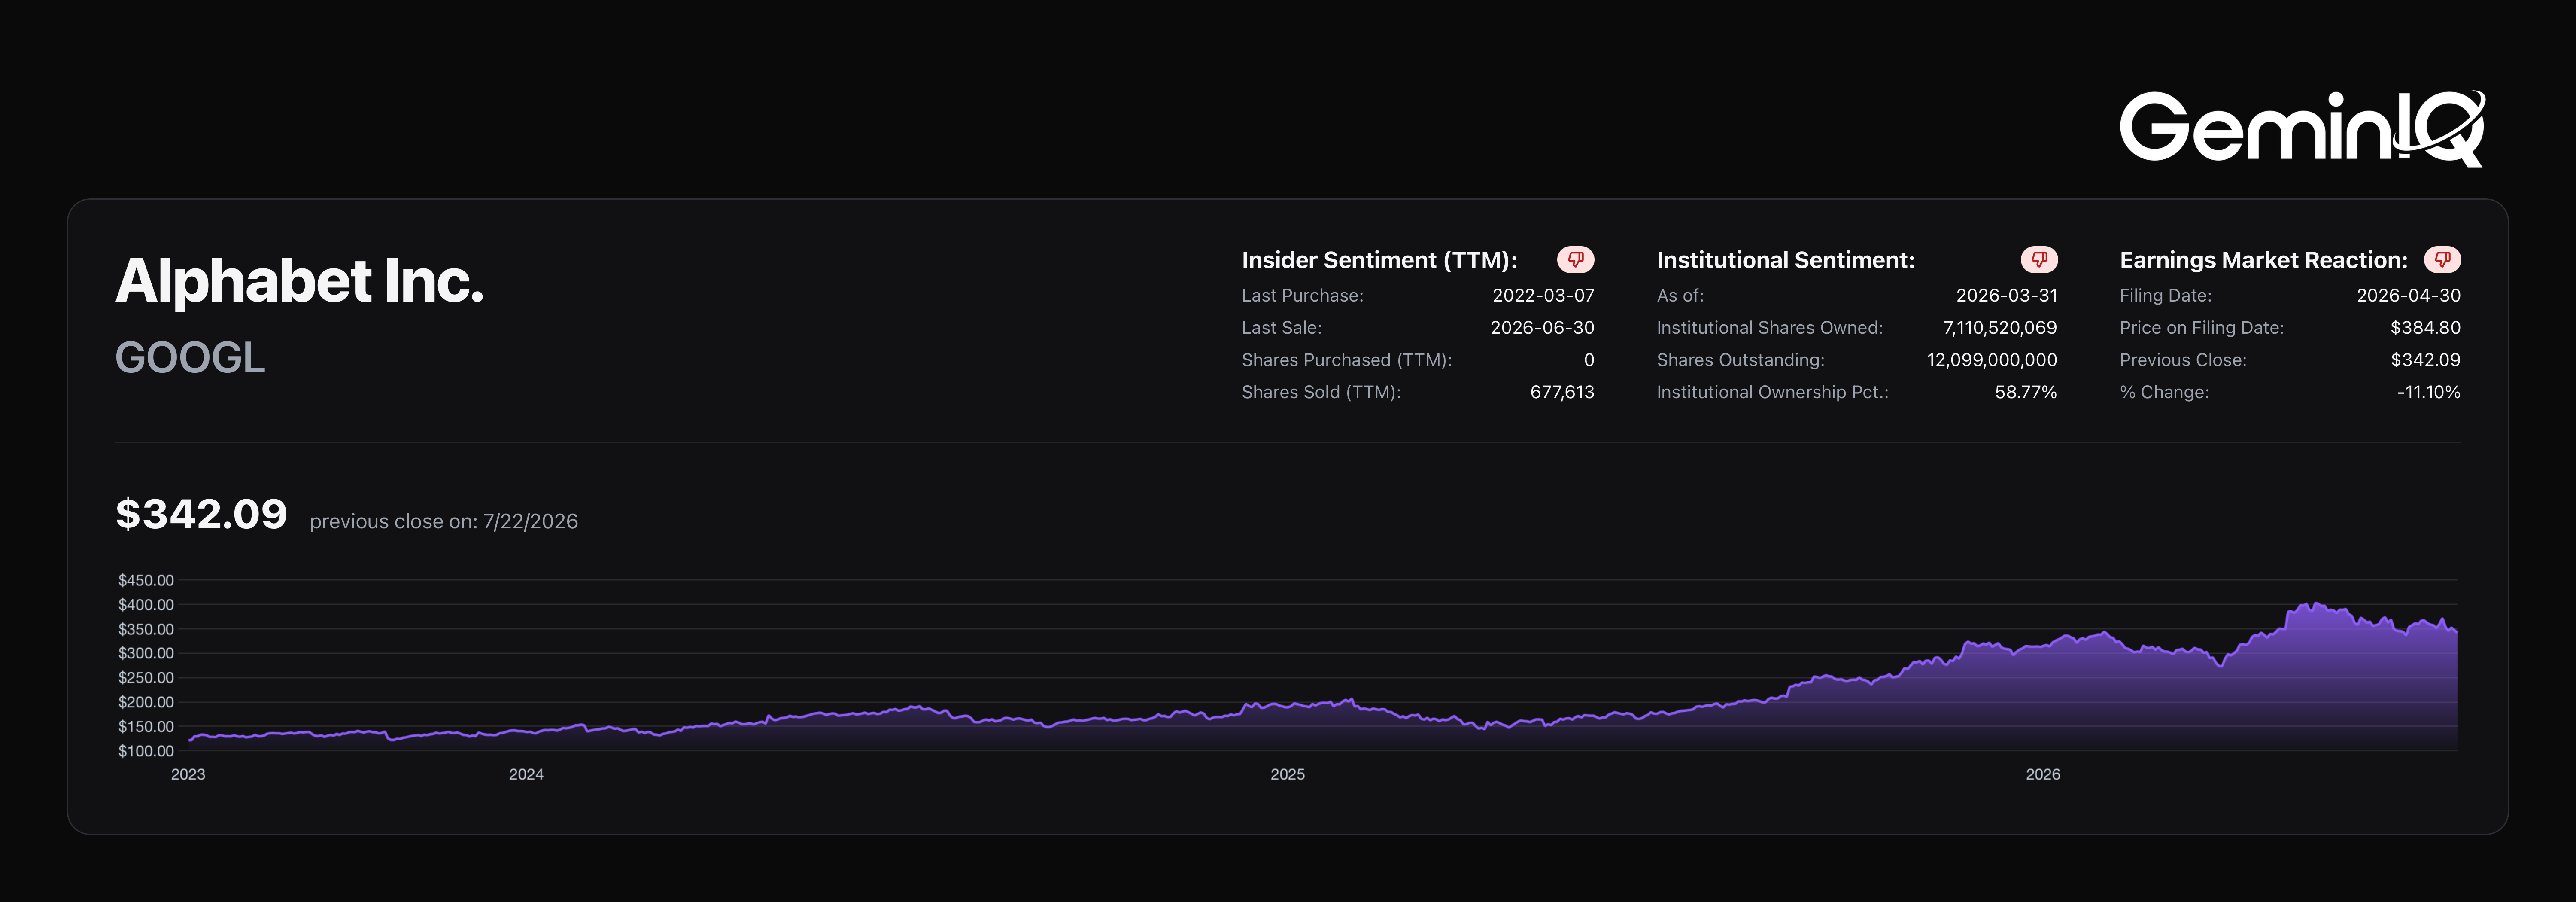
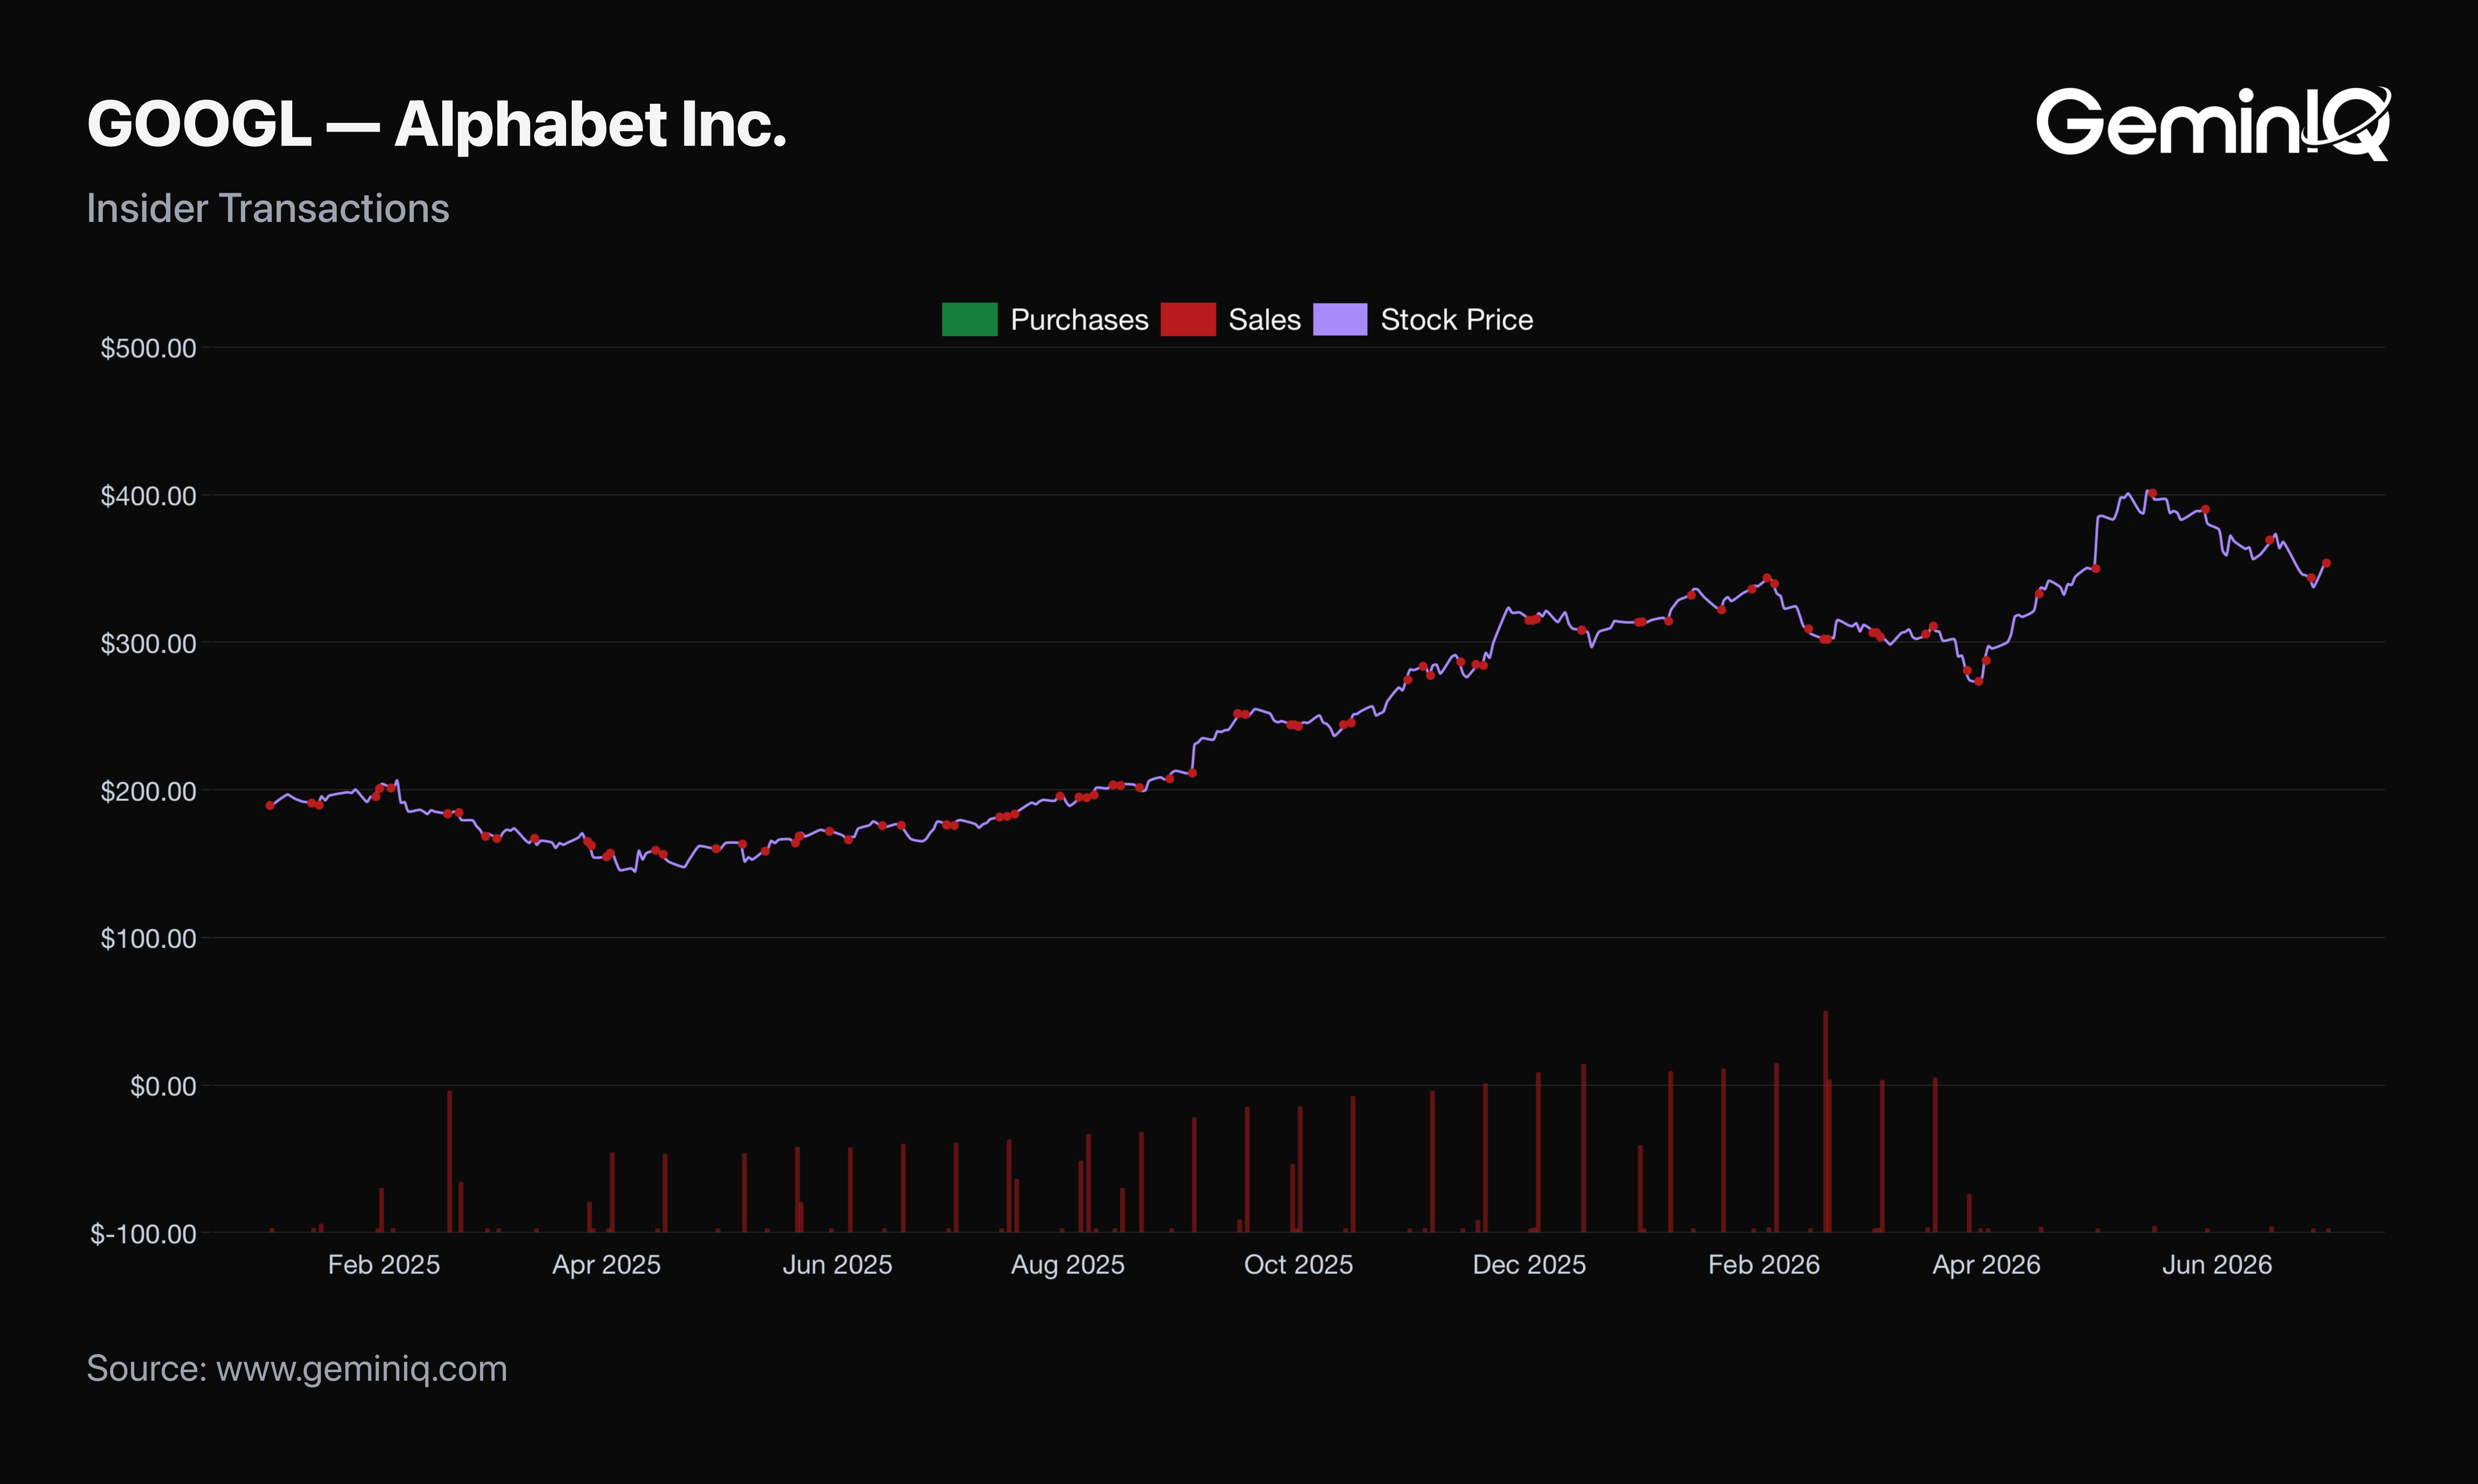
The Data: Since January 1, 2025, GeminIQ's Insider Transactions records 92 sale filings by Alphabet insiders totaling $256.13 Million, and zero purchases. The largest is 47,574 shares by the President, Global Affairs and Chief Legal Officer at $301.10 on February 17, 2026, for $14.32 Million. The Chief Executive Officer filed three sales of 32,500 shares each, at $336.84 on February 4, 2026, $326.20 on January 21, 2026, and $320.96 on January 7, 2026.
Institutional Ownership reached 60.51% of shares outstanding as of the quarter ending December 31, 2025, easing to 58.77% as of March 31, 2026. Both figures come from quarterly 13F filings and describe positioning as of those quarter-ends rather than current holdings.
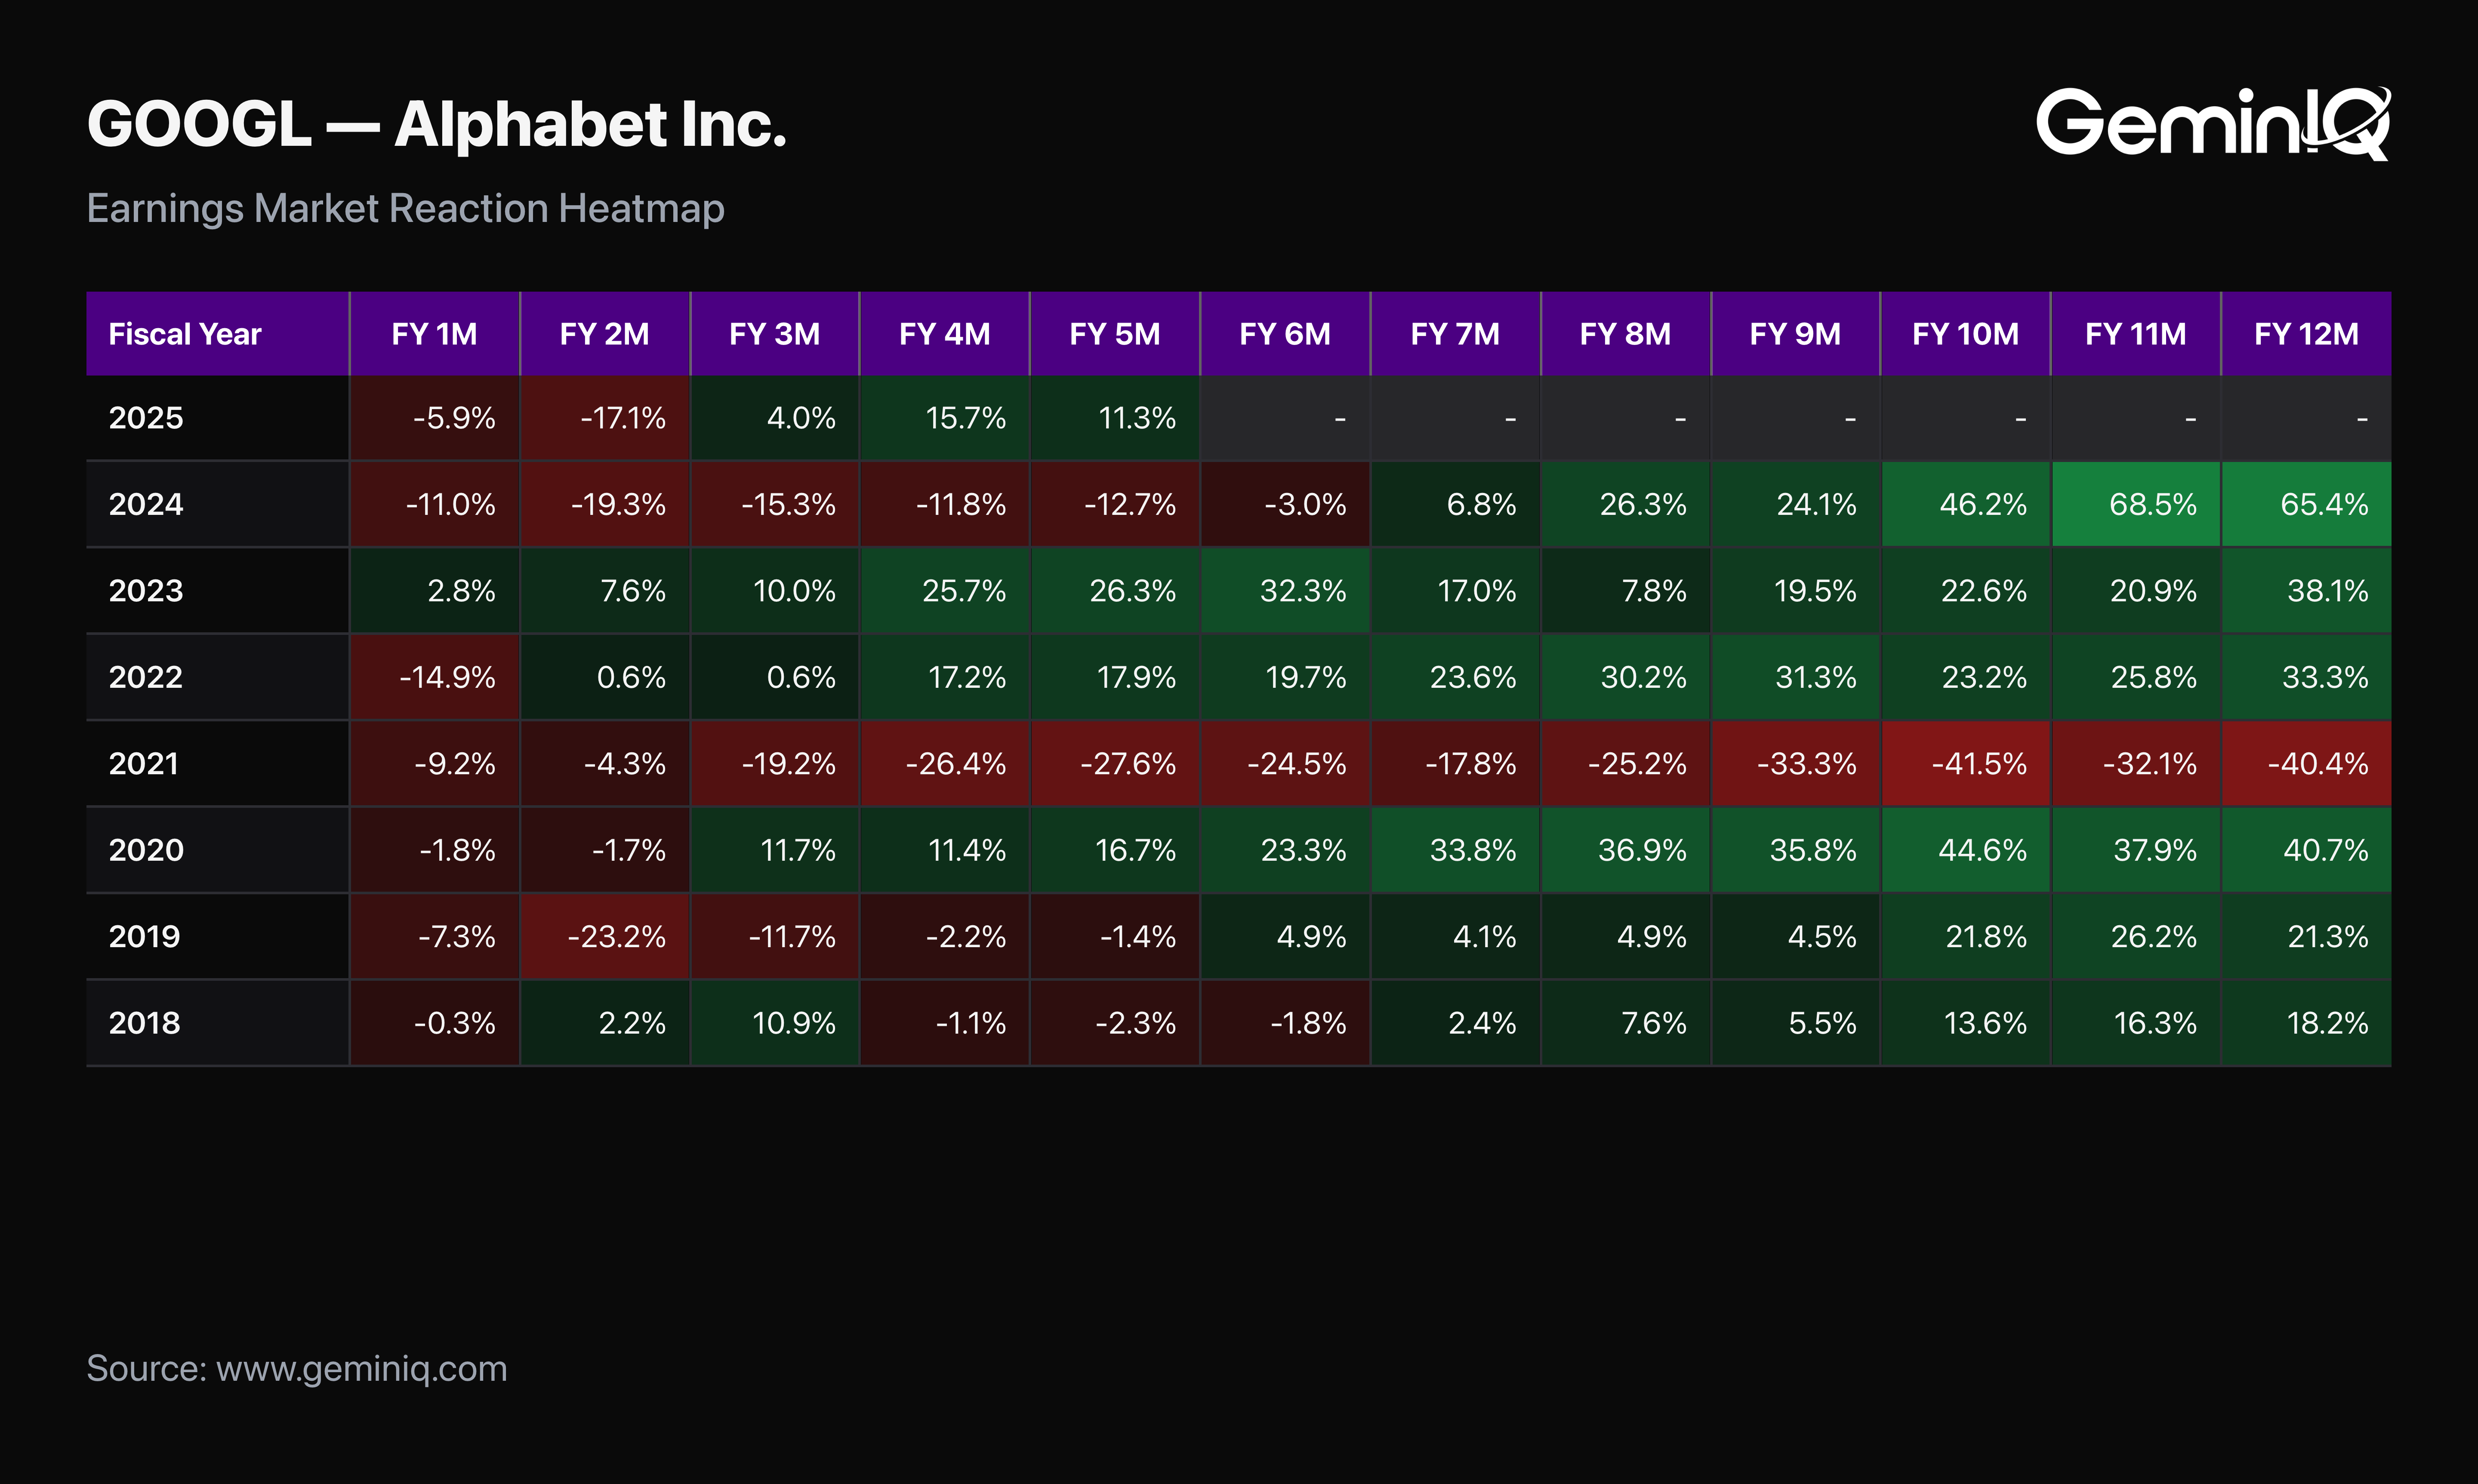
The GeminIQ Edge: Insider selling clustered around a filing date is usually scheduled and reads as noise. The record worth watching is what followed the 10-K itself. GeminIQ's Earnings Market Reaction Heatmap shows the stock down 5.88% one month after filing and down 17.12% at two months, before recovering to +4.04% at three months and +11.25% at five. The full twelve-month window has not yet elapsed.
Frequently Asked Questions
Why was Alphabet's free cash flow flat in FY2025?
Capital expenditure grew almost exactly as fast as operating cash flow. Operating cash flow rose $39.41 Billion and Purchases Of Property And Equipment rose $38.91 Billion, absorbing 98.7% of the increase. Free cash flow finished at $73.27 Billion against $72.76 Billion, a gain of $504 Million.
How much did Alphabet spend on capital expenditure in FY2025?
$91.45 Billion in cash, up from $52.54 Billion. A further $15.09 Billion was recognized as Capital Expenditures Incurred But Not Yet Paid at the balance sheet date. Cash capital spending was 4.33x the year's Depreciation charge of $21.14 Billion.
Did Alphabet reduce its buyback?
Yes. Payments For Repurchase Of Common Stock fell 26.5%, to $45.71 Billion from $62.22 Billion, in a year when net income rose 32.0%. Dividend payments rose to $10.05 Billion from $7.36 Billion.
Does Alphabet still have a net cash position?
No. GeminIQ's Net Debt turned positive at $15.84 Billion at the end of FY2025, the first net debt position in the eleven fiscal years on file, following $64.56 Billion in debt issuance proceeds during the year.
How do I spot this pattern on my own holdings?
Put operating cash flow and free cash flow side by side across five fiscal years and compare their growth rates rather than their levels. When the two diverge, the gap is capital expenditure, and the cash flow statement will tell you whether it is a one-year step or a new run rate.
Alphabet's most recent annual filing is a Form 10-K filed February 5, 2026, covering the fiscal year ended December 31, 2025 (FY2025).
Wall Street's data. Main Street's price.
Institutional terminals charge thousands a year for as-filed accuracy. GeminIQ gives you the same thing for a fraction of the cost: financials built directly from raw SEC EDGAR filings, not third-party APIs, with full XBRL traceability back to the original 10-K or 10-Q. No normalized guesswork, just calculated metrics, charts, screeners, and watchlists built on numbers exactly as the company reported them. Start researching now at GeminIQ.com.
All financial figures cited in this article reference Alphabet Inc.'s FY2025 10-K (filed February 5, 2026, period ending December 31, 2025). All SEC filings are publicly available at SEC EDGAR.
Disclaimer: The content in this blog is for educational and entertainment purposes only and does not constitute financial, legal, or tax advice. Investing involves risk, including the loss of principal. The views expressed are my own and not intended as financial advice or a guarantee of future performance.