
Bed Bath & Beyond: The Buybacks That Funded a Bankruptcy

By Chad Hartman
Published · Last updated
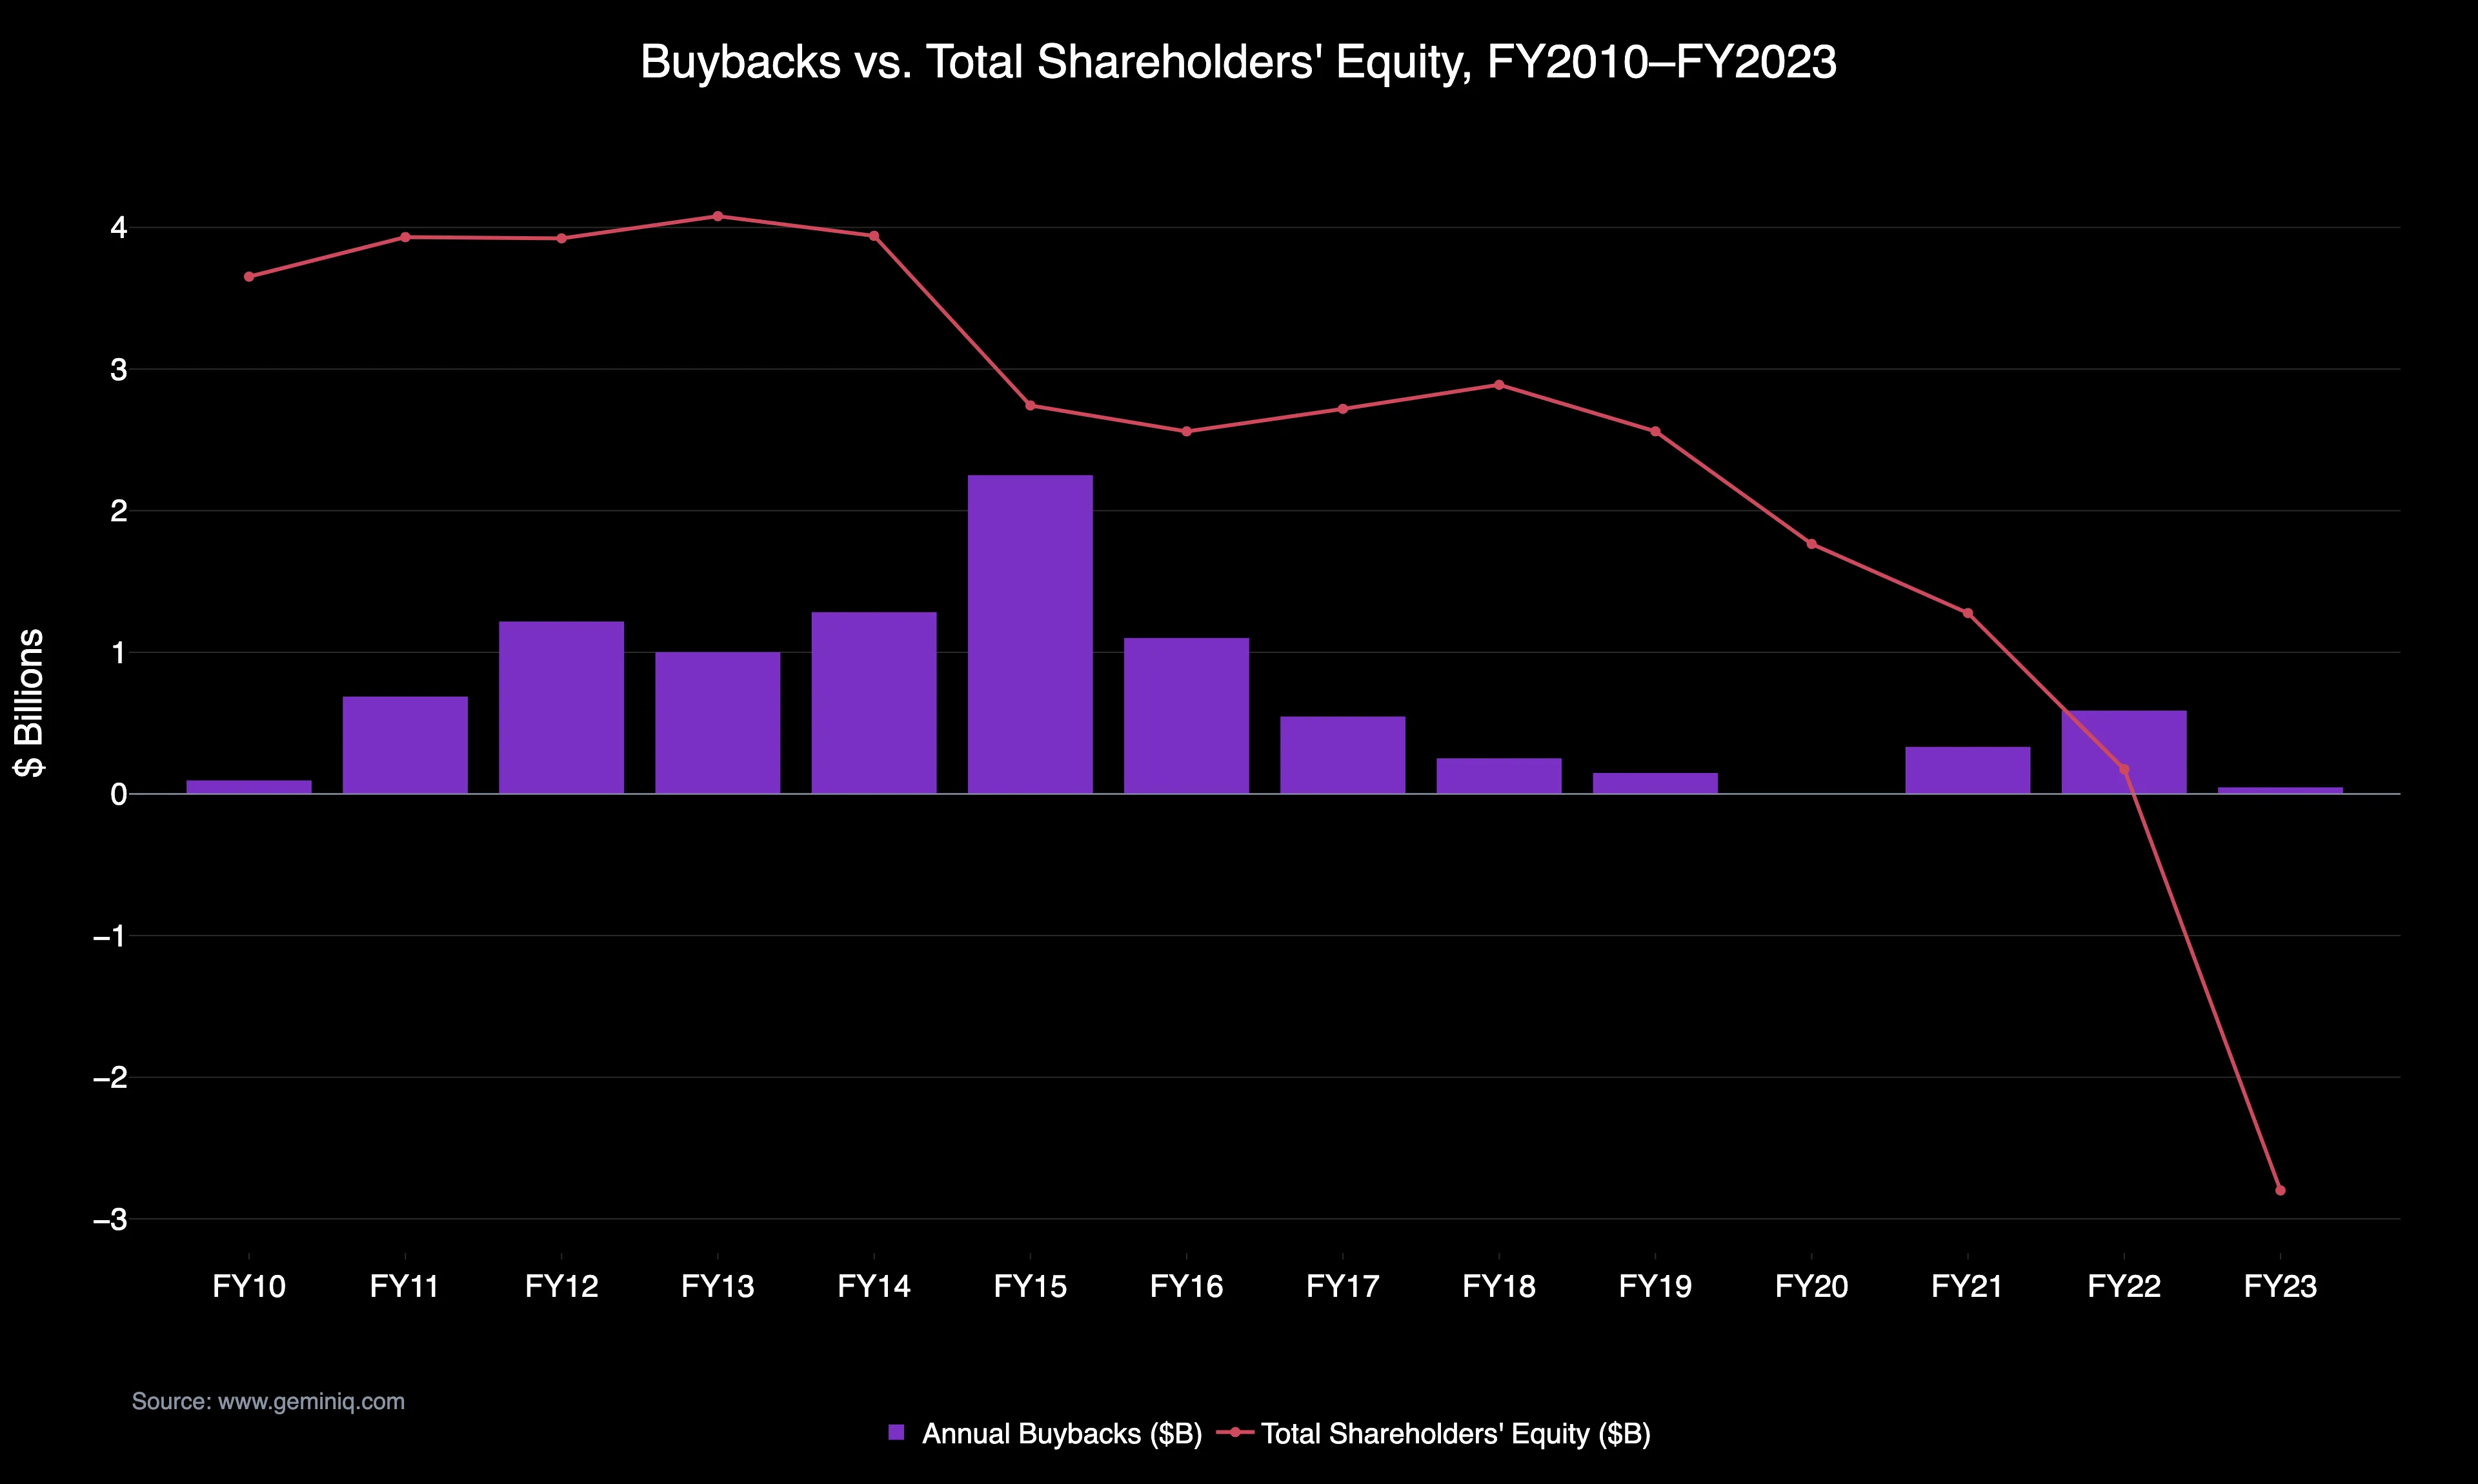
Bed Bath & Beyond filed for Chapter 11 bankruptcy in April 2023, wiping out its remaining shareholders. In the thirteen fiscal years before that filing, the company spent roughly $9.55 Billion buying back its own stock. Was the collapse visible in the numbers the whole time, or did it arrive suddenly? For most of the 2010s, the market treated Bed Bath & Beyond as a mature, disciplined retailer — the kind of company confident enough in its own cash flow to keep returning capital to shareholders. The filings tell a more specific story: the buybacks didn't stop when the fundamentals started breaking. They kept going for years afterward, funded increasingly by debt, and in the final stretch, spent directly out of a balance sheet that had already gone negative.
Every figure below is drawn from Bed Bath & Beyond Inc.'s own 10-K and 10-Q filings between fiscal 2010 and fiscal 2023, read in the order they were filed.
| Field | Detail |
|---|---|
| Ticker (historical) | BBBY — delisted 2023; the ticker is now used by an unrelated company |
| Filing window | FY2010–FY2023, 56 filings (14 10-Ks, 42 10-Qs) |
| Filing types covered | 10-K, 10-Q |
| Outcome metric | Total Shareholders' Equity: $3.65 Billion (FY2010) → -$2.80 Billion (FY2023, final filing) |
The Full Timeline: Buybacks, Equity, Margins and Altman Z by Fiscal Year
| Fiscal Year | Buyback Spend | Total Shareholders' Equity | Gross Margin | Operating Margin (TTM) | Altman Z-Score |
|---|---|---|---|---|---|
| FY2010 | $95 Million | $3.65 Billion | 40.8% | — | Above 5.0 |
| FY2011 | — | — | — | — | Above 5.0 |
| FY2012 | — | — | — | — | Above 5.0 |
| FY2013 | — | — | — | — | Above 5.0 |
| FY2014 | — | — | — | — | Above 5.0 |
| FY2015 | $2.25 Billion | — | 38.9% | — | Above 5.0 |
| FY2016 | $1.10 Billion | — | 38.2% | — | — |
| FY2017 | $547 Million | — | — | — | — |
| FY2018 | $252 Million | — | — | — | — |
| FY2019 | $148 Million | — | 34.1% | -0.7% | — |
| FY2020 | No annual figure tagged | — | — | — | — |
| FY2021 | $332.5 Million | $1.28 Billion | — | -3.6% | — |
| FY2022 | $589.4 Million | $174 Million | — | -5.2% | — |
| FY2023 | $46 Million | -$2.80 Billion | — | -9.1% (May 2022) | -2.66 (final quarter) |
Blank cells are fiscal years for which this study does not report a filed figure, not zeros. Two readings inside fiscal 2023 are worth pulling out of the annual row: shareholders' equity first went negative at -$220 Million in the quarter ended May 2022, the same quarter the company spent $43.0 Million on buybacks, and the Altman Z-Score had already fallen to 3.44 by August 2022 before reaching -2.66 in the final reported quarter. FY2010–FY2015 buyback spend totals $6.54 Billion; cumulative spend through the FY2019 operating-margin crossover was $8.58 Billion.
The Buyback Machine, FY2010–FY2015
In the early 2010s, Bed Bath & Beyond was a genuinely strong business — gross margins in the low-to-mid 40s, operating margins in the mid-teens, and an Altman Z-Score well above 5.0, deep in the "safe" zone. Buybacks in this era reflected real cash generation, not desperation.
The Filing Data: Annual buyback spend climbed from $95 Million in FY2010 to a peak of $2.25 Billion in FY2015 alone. Across these six fiscal years, the company spent $6.54 Billion total on repurchases. Long Term Debt first appears on the balance sheet in the quarter ended August 2014, at $1.5 Billion — the first time the company had borrowed money — arriving in the same fiscal year the company spent a record $2.25 Billion on buybacks.
The Signal: Gross margin was already sliding roughly a point a year through this stretch (from 40.8% in early FY2010 to 38.9% by FY2015) even as buyback spending accelerated to its all-time high. The debt didn't fund expansion — it showed up the same year the buyback pace reached its peak, needing more cash than the operating business alone was generating.
FY2016–FY2019: Operating Margin Went Negative, Buybacks Didn't Stop
Revenue was still growing on paper through fiscal 2018, which masked how much profitability was already eroding underneath it.
The Filing Data: Gross margin kept falling, from 38.2% to 34.1% (TTM). Operating margin (TTM) crossed from positive to negative for the first time in the quarter ended February 2019, at -0.7%. Buybacks slowed but never stopped: $1.10 Billion (FY2016), $547 Million (FY2017), $252 Million (FY2018), $148 Million (FY2019).
The Signal: By the time operating margin turned negative, the company had already spent a cumulative $8.58 Billion on buybacks since FY2010. Long Term Debt held flat near $1.49 Billion throughout this stretch rather than being paid down — the borrowing from the prior era was never unwound, even as the business it had helped fund kept weakening.
$43.0 Million of Buybacks the Same Quarter Equity Went Negative
Revenue turned into an outright, sustained decline. Net margin was now solidly negative every quarter, and the balance sheet was running out of room to absorb it.
The Filing Data: Total Shareholders' Equity fell from $1.28 Billion (February 2021, FY2021 year-end) to $174 Million (February 2022, FY2022 year-end) — even as the company spent $332.5 Million (FY2021) and $589.4 Million (FY2022) on buybacks across those same two fiscal years. Equity crossed into negative territory the very next quarter, at -$220 Million (May 2022, the first quarter of fiscal 2023) — and the company still spent $43.0 Million on buybacks that same quarter, per the filed cash flow data. Operating margin (TTM) was already negative through this stretch: -3.6% (February 2021), -5.2% (February 2022), -9.1% by May 2022. The Altman Z-Score, which had sat above 5.0 for most of the company's history, fell to 3.44 by August 2022.
The Signal: This is the clearest single data point in the whole filing history: a company with negative shareholders' equity, negative and worsening margins, and a deteriorating credit profile still wrote a $43 million check to buy back its own stock. Announced repurchase capacity and actual spend are two different things, in both directions — the gap between a buyback authorization and what gets filed is the only place this kind of decision is visible.
FY2023: Buybacks Reverse Into Share Issuance, Altman Z at -2.66
By early 2023, the buyback era was effectively over — but not because the company chose to stop.
The Filing Data: Buyback spend collapsed to $46 Million for the full fiscal year, then to essentially nothing ($219,000) in the final quarter. Basic shares outstanding, which had fallen from 257.8 Million to 79.6 Million over that span — a 69% reduction funded almost entirely by buybacks — increased for the first time in years, to 90.7 Million (November 2022) and 97.1 Million (February 2023), as the company turned to issuing new shares to raise cash. The Altman Z-Score was -2.66 in the final reported quarter. Total Shareholders' Equity: -$2.80 Billion.
The Signal: The exact mechanism reversed. A stretch spent retiring shares to return capital to shareholders ended with the company diluting those same shareholders just to survive a few more months — the same move, made under duress, that shows up across GeminIQ's ranking of companies that dilute shareholders.
Three Warning Signs Converged Eleven Months Before Chapter 11
By the quarter ended May 31, 2022, at least three separate warning signs had already converged in Bed Bath & Beyond's own filings: shareholders' equity had turned negative, operating margin was solidly negative and worsening, and the company was still buying back stock rather than conserving cash. None of this required special access — it was sitting in the same 10-Q anyone could have pulled. GeminIQ's post-filing price-reaction data isn't available for this period, since the company delisted before a resolvable ongoing trading history could be captured. But the public record isn't in dispute: the company filed for Chapter 11 bankruptcy eleven months later, in April 2023, and common shareholders were wiped out.
A delisted 2023 bankruptcy is also exactly the kind of entity that normalized-data providers drop from coverage or never carried in the first place — once a company stops trading, the ticker stops being worth maintaining, and the history behind it tends to go with it. GeminIQ still holds all 56 of Bed Bath & Beyond's filings from this window — 14 10-Ks and 42 10-Qs — exactly as they were filed, which is the coverage difference our comparison with BamSEC is about.
Check Your Holdings
This same check works on any company you hold, whether or not it's anywhere near trouble. Pull up Payments For Repurchase Of Common Stock alongside Total Shareholders' Equity and operating margin in GeminIQ's Financial Statements and Calculated Metrics views. A company still buying back stock while equity is shrinking toward zero, or while margins are compressing quarter after quarter, is showing the exact pattern that sat in Bed Bath & Beyond's own filings more than a year before its bankruptcy. That's worth checking before the next buyback announcement gets read as a vote of confidence.
Frequently Asked Questions
How much did Bed Bath & Beyond spend on buybacks before filing for bankruptcy?
Roughly $9.55 Billion across fiscal 2010 through fiscal 2023, based on GeminIQ's as-filed data for the Payments For Repurchase Of Common Stock line. No annual repurchase figure was tagged for fiscal 2020, likely reflecting a pause during that year.
Did Bed Bath & Beyond keep buying back stock after its equity went negative?
Yes. The quarter ended May 31, 2022 shows $43.0 Million in buybacks the same three months Total Shareholders' Equity first went negative, per GeminIQ's filed data.
When did Bed Bath & Beyond file for bankruptcy?
April 2023, according to public record — about eleven months after its own filings first showed negative shareholders' equity.
What happened to Bed Bath & Beyond?
The company filed for Chapter 11 bankruptcy in April 2023 and its common shareholders were wiped out. Its filings show the deterioration running for more than a decade first: gross margin fell from 40.8% in early FY2010 to 34.1% by FY2019, operating margin turned negative in the quarter ended February 2019, Total Shareholders' Equity went from $3.65 Billion to -$2.80 Billion, and the Altman Z-Score fell from above 5.0 to -2.66. Across that same stretch the company spent roughly $9.55 Billion repurchasing its own stock.
Did buybacks cause Bed Bath & Beyond's bankruptcy?
This study doesn't make that claim, and the filings alone can't establish it. What they do show is sequencing: $9.55 Billion left the company as repurchases while margins compressed, debt first appeared on the balance sheet in the same fiscal year buyback spend peaked at $2.25 Billion, and $43.0 Million was still being spent in the quarter equity turned negative. That is cash unavailable to absorb what came next, whatever else contributed.
Is buying back stock always a warning sign?
No. Buybacks funded by genuine, sustained cash generation are an ordinary capital allocation choice — the companies that genuinely shrank their share count over the last decade did it out of real cash flow. The pattern in this post — buybacks continuing while margins deteriorate and the balance sheet weakens — is the specific combination worth watching for, not buybacks in isolation.
Wall Street's data. Main Street's price.
Institutional terminals charge thousands a year for as-filed accuracy. GeminIQ gives you the same thing for a fraction of the cost: financials built directly from raw SEC EDGAR filings, not third-party APIs, with full XBRL traceability back to the original 10-K or 10-Q. No normalized guesswork, just calculated metrics, charts, screeners, and watchlists built on numbers exactly as the company reported them. Start researching now at GeminIQ.com.
All financial figures in this article are drawn from Bed Bath & Beyond Inc.'s (CIK0000886158) 10-K and 10-Q filings, filed 2009–2023 and publicly available on SEC EDGAR. This entity is no longer publicly traded. The Bed Bath & Beyond brand and ticker were subsequently acquired out of bankruptcy by a separate company and are not the subject of this analysis.
Disclaimer: The content in this blog is for educational and entertainment purposes only and does not constitute financial, legal, or tax advice. Investing involves risk, including the loss of principal. The views expressed are my own and not intended as financial advice or a guarantee of future performance.