
Companies That Dilute Shareholders: The Worst Offenders

By Chad Hartman
Published · Last updated
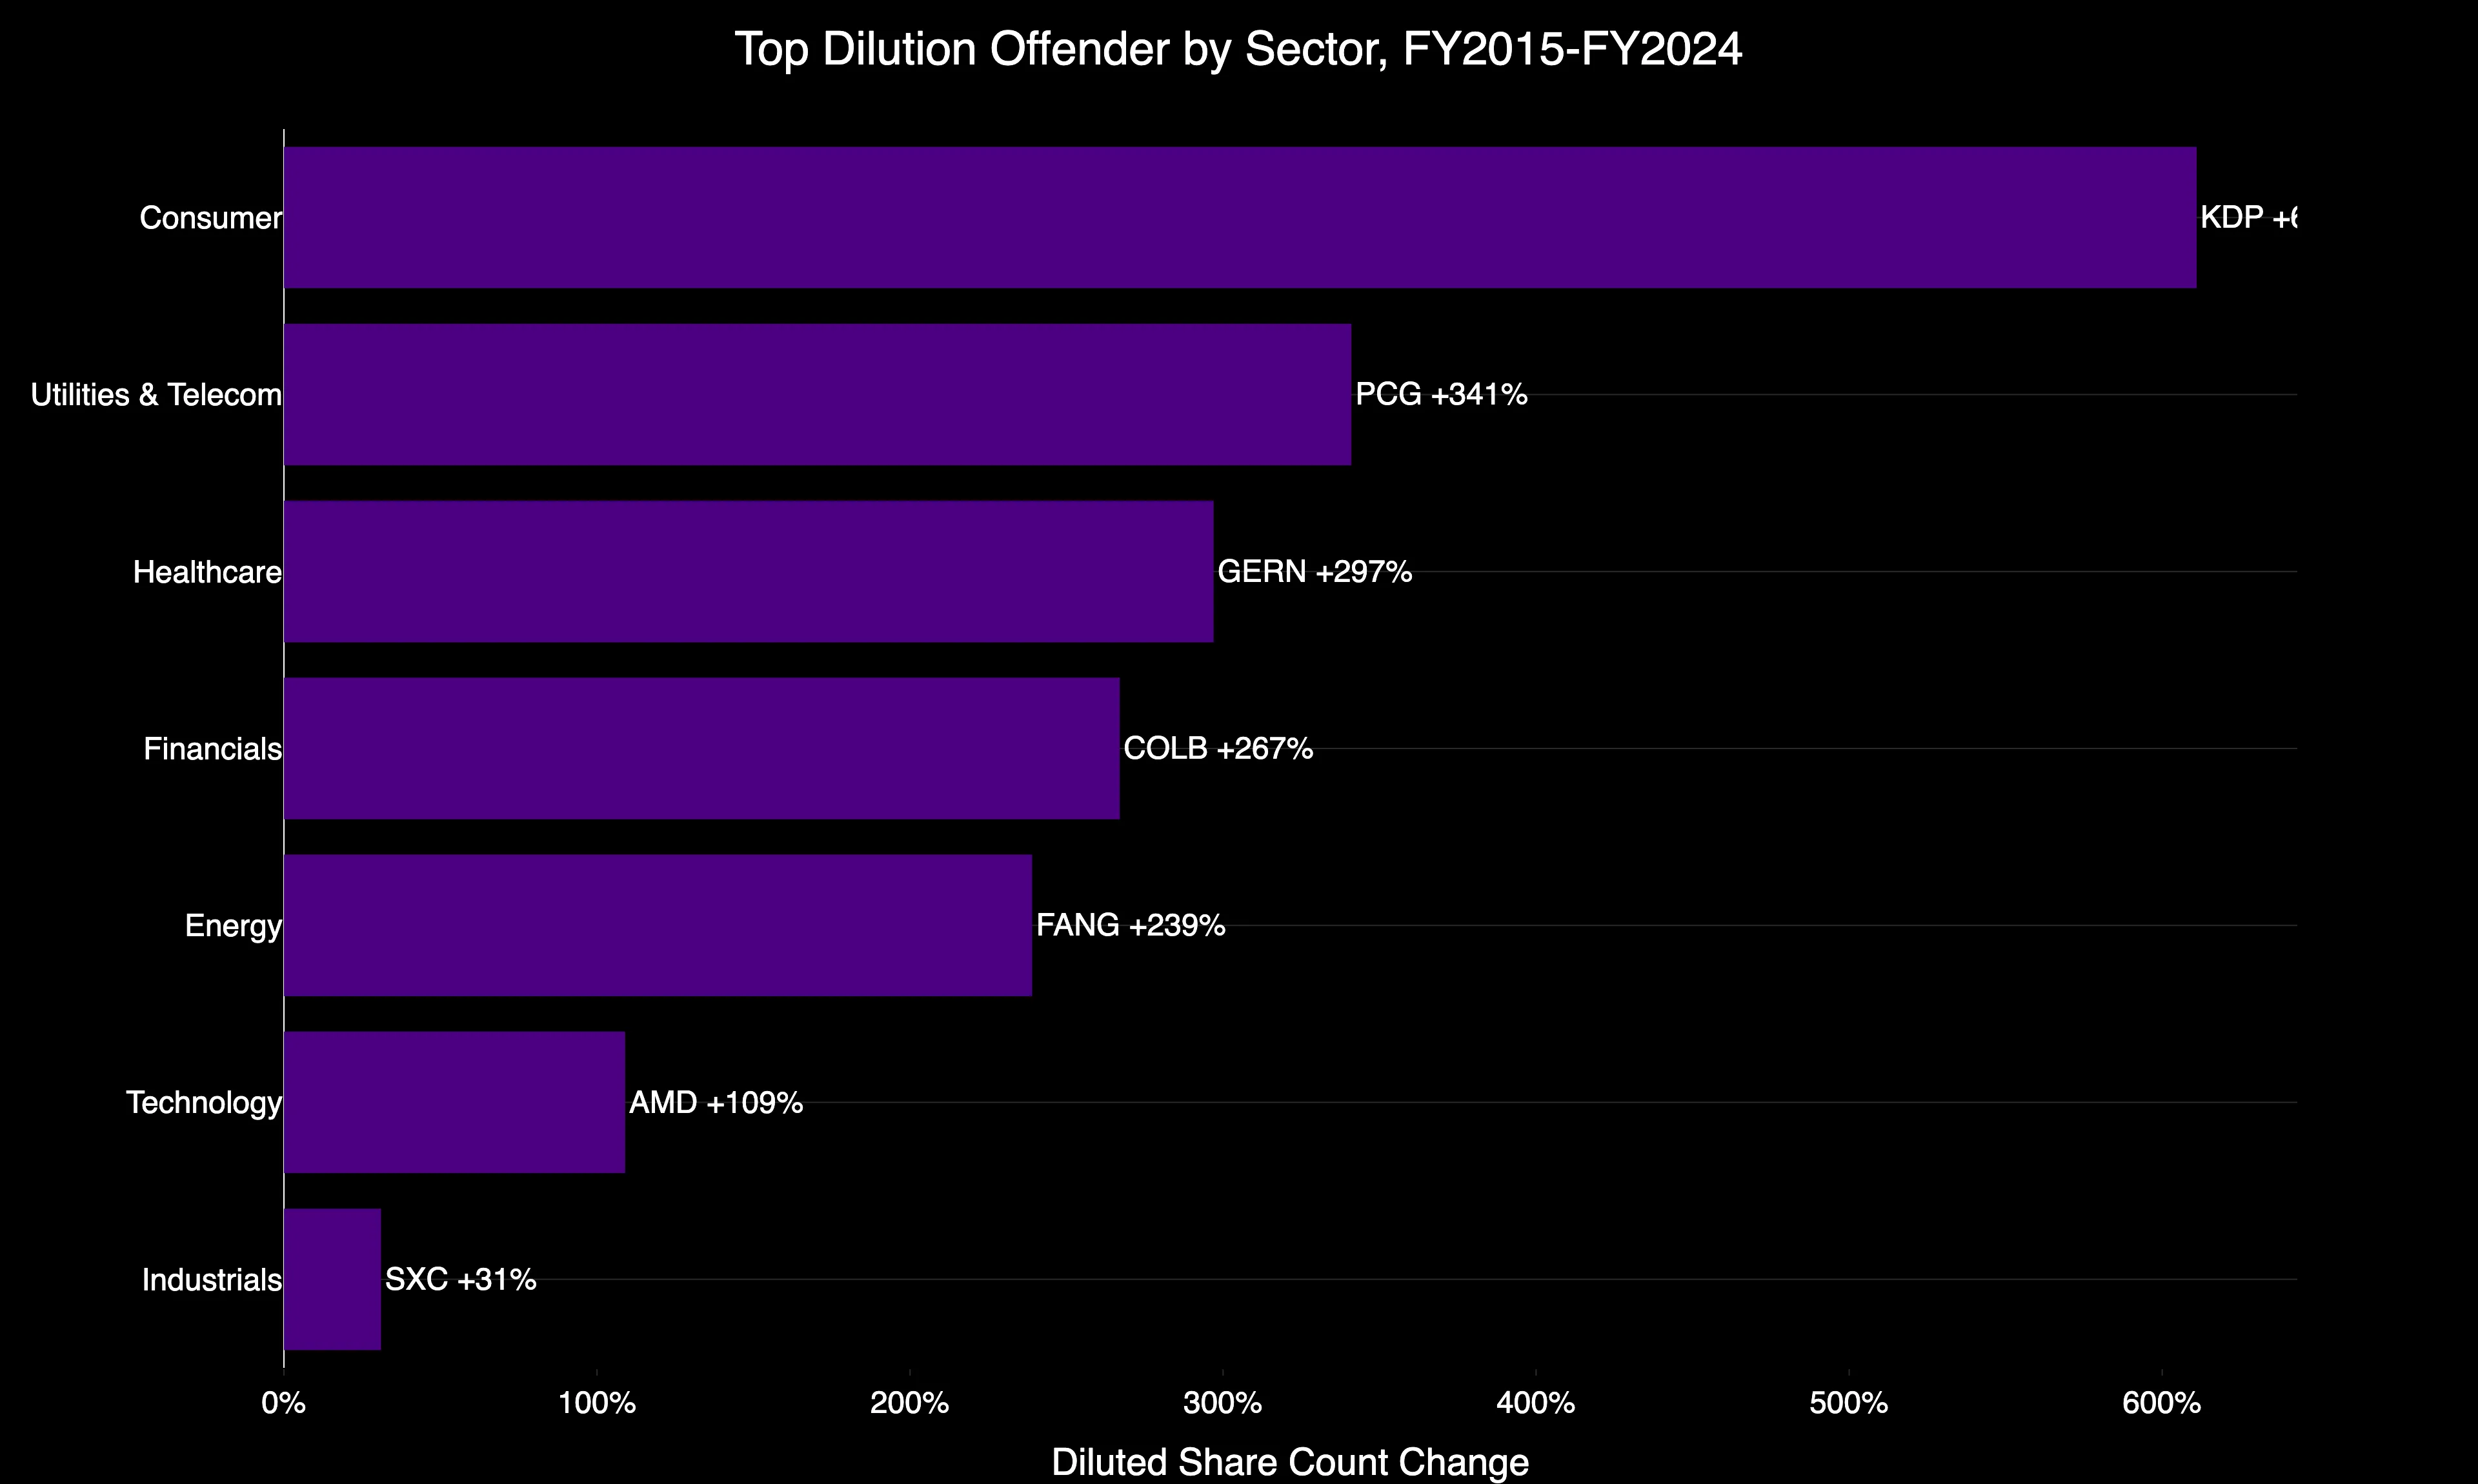
Rank every public company by raw growth in diluted shares outstanding and the leaderboard fills with penny stocks and shell companies — a name with 1 million shares that issues 10 million more books an infinite-looking percentage gain that says nothing about a real business. Set a size floor, take out companies whose growth-through-equity-issuance is the entire business model, and shareholder dilution stops being one story and becomes seven: a different playbook in every sector, each one traceable to a specific line in a specific filing.
Study Scope Statement. This study covers 677 companies with a complete FY2015-FY2024 10-K filing history and a diluted share count of at least 50 Million shares in FY2015, pulled as-filed from SEC XBRL data via GeminIQ. This study excludes real estate investment trusts — REITs raise external equity as a structural requirement of their business model, not as a symptom of shareholder-hostile management, and mixing the two produces a misleading ranking. This analysis split-adjusts diluted share counts to control for stock splits, which multiply share count without diluting anyone's proportional ownership. This is a filing-data pattern study, not a forward-looking signal — nothing here predicts what any of these stocks will do next.
The Universe Note
This study's 677-company universe is not the same universe used in GeminIQ's companion study of companies reducing share count. The two studies apply different inclusion rules — this one sets a 50 Million minimum diluted share count and excludes REITs — so the base rates the two studies report are not directly comparable, and neither ranking should be read as the mirror image of the other.
Technology: AMD's Share Count Up 109% on $5.1 Billion of SBC
Software and semiconductor companies dominate this sector's leaderboard, and the pattern is almost entirely stock-based compensation rather than distressed financing.
| Ticker | FY2015 Diluted Shares | FY2024 Diluted Shares | Change |
|---|---|---|---|
| KOPN | 63.5M | 132.9M | +109% |
| AMD | 783M | 1,637M | +109% |
| FIS | 289M | 555M | +92% |
| RBA | 107.4M | 185.3M | +72% |
| HQY | 51.9M | 87.0M | +68% |
| CRM | 624.1M | 984.0M | +58% |
| ADI | 316.9M | 498.7M | +57% |
| MXL | 53.4M | 83.6M | +57% |
The Data: AMD's diluted share count grew 109% over the window, from 783 million to 1.637 billion, against $5.1 Billion in cumulative Share Based Compensation. AMD also closed its all-stock acquisition of Xilinx in 2022, one of the largest stock-funded semiconductor deals on record — a real driver of share growth that sits alongside, not instead of, the SBC total.
The GeminIQ Edge: A screener built on trailing revenue growth or margin expansion would show AMD as an unambiguous success story over this window. Only pulling the raw share count directly from the filing — not a processed "shares outstanding" figure smoothed by an aggregator — shows the other side of that growth: the business scaled, their ownership didn't.
Financials: Columbia Banking System Up 267% on an All-Stock Merger
Regional banks show up almost exclusively for one reason: using their own stock to pay for another bank.
| Ticker | FY2015 Diluted Shares | FY2024 Diluted Shares | Change |
|---|---|---|---|
| COLB | 57.0M | 209.3M | +267% |
| ONB | 116.3M | 311.0M | +168% |
| FHN | 236.3M | 544.3M | +130% |
| UCB | 65.5M | 119.9M | +83% |
| HBAN | 817.1M | 1,476.4M | +81% |
| TFC | 757.8M | 1,331.1M | +76% |
| IBKR | 250.0M | 436.0M | +74% |
| PFS | 63.1M | 109.7M | +74% |
The Data: Columbia Banking System leads the sector at +267%, with $2.6 Billion in cumulative stock issued for acquisitions against just $108 Million in Share Based Compensation over the same decade. That ratio is the tell: this isn't a stock-comp story. Columbia Banking System's 2023 combination with Umpqua Holdings was structured as an all-stock merger of equals, and the share count reflects exactly that.
The GeminIQ Edge: That $2.6 Billion sits under a single tag, Stock Issued During Period Value Acquisitions — the exact line an all-stock, tax-free merger press release never quotes, because the number that matters to existing shareholders isn't the deal's advertised terms, it's how many new shares got created to pay for it.
Healthcare: Geron Up 297% Funding a Pipeline With New Stock
Every name on this list is a clinical-stage company funding a pipeline with no product revenue to lean on, and the pattern repeats with almost no variation.
| Ticker | FY2015 Diluted Shares | FY2024 Diluted Shares | Change |
|---|---|---|---|
| GERN | 162.7M | 646.0M | +297% |
| PACB | 78.3M | 288.4M | +268% |
| MNKD | 81.2M | 283.8M | +249% |
| BCRX | 72.9M | 206.7M | +184% |
| LCTX | 79.7M | 200.2M | +151% |
| CERS | 96.9M | 184.6M | +90% |
| PKTX | 198.0M | 358.6M | +81% |
| GMED | 96.1M | 137.9M | +43% |
The Data: Geron tops this sector at +297%, quadrupling its diluted share count from 162.7 million to 646.0 million shares, funded through $130.8 Million in new stock offerings layered on top of a decade of clinical trial costs. Geron had no approved product generating revenue for almost the entire window — its 2024 FDA approval of Rytelo came only at the very end of this study's period.
The GeminIQ Edge: Standard financial media covers clinical-stage biotech through the lens of trial results and FDA calendar dates. The dilution story runs underneath every one of those headlines the whole time — a company can clear every clinical hurdle and still hand existing shareholders a fraction of the company they started with, and that fact is sitting in the raw filing data years before any approval headline runs.
Utilities & Telecom: PG&E Up 341% on $19.3 Billion of New Stock
This sector's leaderboard splits into two distinct stories: one bankruptcy-driven, the rest structural.
| Ticker | FY2015 Diluted Shares | FY2024 Diluted Shares | Change |
|---|---|---|---|
| PCG | 487.0M | 2,147.0M | +341% |
| TRGP | 53.6M | 221.3M | +313% |
| FYBR | 72.3M | 248.2M | +243% |
| ECHO | 93.5M | 274.1M | +193% |
| AROC | 68.4M | 162.4M | +137% |
| LUMN | 555.1M | 987.7M | +78% |
| WMB | 749.3M | 1,223.0M | +63% |
| ATO | 101.9M | 152.7M | +50% |
The Data: PG&E leads this sector at +341%, with $19.3 Billion in new stock issued against zero dollars of Share Based Compensation over the window — the entire increase is a single event, not creep. PG&E filed for Chapter 11 bankruptcy in January 2019 following California wildfire liability claims and emerged in 2020 funded substantially through new equity raised specifically to cover those liabilities.
The GeminIQ Edge: None of that $19.3 Billion shows up as an operating charge or a one-time writedown anywhere in PG&E's income statement — it's a balance sheet event, permanent and non-recurring, sitting in the equity issuance tags rather than anywhere an earnings-focused reader would think to look for a bankruptcy's cost.
Consumer: Keurig Dr Pepper Up 611% on the 2018 Merger
Consumer is the thinnest story in this study — one company explains almost the entire sector's dilution.
| Ticker | FY2015 Diluted Shares | FY2024 Diluted Shares | Change |
|---|---|---|---|
| KDP | 192.4M | 1,368.3M | +611% |
| PENN | 90.9M | 152.1M | +67% |
| WYNN | 101.7M | 110.3M | +8% |
| ARMK | 246.6M | 266.2M | +8% |
| FIVE | 218.3M | 222.5M | +2% |
The Data: Keurig Dr Pepper's diluted share count grew 611%, from 192.4 million to 1.37 billion shares, against $441 Million in stock issued for acquisitions and $642 Million in cumulative Share Based Compensation. The bulk of that jump traces to the 2018 combination of Keurig Green Mountain and Dr Pepper Snapple Group, structured with a substantial new-equity component to fund the deal.
The GeminIQ Edge: After that, the sector goes quiet — every other name in Consumer moved in the single digits to low double digits over a full decade. That's not an accident of this sample; it reflects that mature consumer businesses with steady cash flow generally don't need to issue stock to fund operations, which makes KDP's number a merger artifact rather than a sector pattern.
Energy: Diamondback Up 239% on $24.3 Billion of Stock-Funded M&A
Shale consolidation shows up here as clearly as the bank mergers do in Financials — stock, not cash, funded the decade's biggest deals.
| Ticker | FY2015 Diluted Shares | FY2024 Diluted Shares | Change |
|---|---|---|---|
| FANG | 63.0M | 213.5M | +239% |
| EQT | 152.9M | 514.6M | +236% |
| PTEN | 145.4M | 397.2M | +173% |
| RIG | 363.0M | 925.0M | +155% |
| CTRA | 413.7M | 745.0M | +80% |
| EGY | 58.3M | 103.7M | +78% |
| SM | 67.7M | 116.0M | +71% |
The Data: Diamondback Energy leads at +239%, with $24.3 Billion in stock issued for acquisitions dwarfing $407.5 Million in Share Based Compensation and $4.0 Billion in buybacks over the same window. Diamondback's 2023 all-stock combination with Endeavor Energy Resources, valued near $26 Billion, is the single largest driver of that figure.
The GeminIQ Edge: Diamondback also ran a real buyback program in parallel — $4.0 Billion worth — which a shareholder-yield calculation would read as capital return. Read next to $24.3 Billion in stock issued for one acquisition, the buyback is a rounding error against the dilution, not an offset to it. Neither number alone tells the story; the ratio between them does.
The Exception: Industrials Topped Out at +31%
Every sector above shows hundreds of percent of dilution somewhere near the top. Industrials tops out at +31% (SXC), and most of the sector's largest, most recognizable names — Danaher, Roper, Keysight — moved in the low single digits over the full decade. That's not a data gap; it's a sector where mature, cash-generative businesses simply didn't need to issue stock at scale, and it's worth stating plainly rather than forcing a seventh villain leaderboard where the data doesn't support one.
The Method
This study pulls Weighted Average Number Of Diluted Shares Outstanding, split-adjusted for stock splits, from as-filed 10-K data across the full GeminIQ filing universe, cross-referenced against Share Based Compensation, Payments For Repurchase Of Common Stock, and stock-issuance tags for cause attribution. Full methodology is covered in The Filing Data Study Methodology.
Check Your Holdings
Pull up any company's 10-K on GeminIQ's Financial Statements view and look at Weighted Average Number Of Diluted Shares Outstanding across five or ten years. If it's climbing, check it against Share Based Compensation and Payments For Repurchase Of Common Stock over the same window — a buyback program that isn't outrunning the share count it's supposed to offset isn't actually returning capital, it's just slowing the leak. Ten seconds, any ticker.
Frequently Asked Questions
What counts as shareholder dilution in SEC filings?
Shareholder dilution shows up as growth in a company's diluted shares outstanding — the weighted-average share count used to calculate earnings per share, filed each period in the 10-K and 10-Q. A rising count means each existing share represents a smaller proportional claim on the company, regardless of what drove the increase.
Do stock splits count as dilution?
No. A stock split multiplies the share count and divides the share price by the same factor, leaving every shareholder's proportional ownership unchanged. This study adjusts for splits specifically to avoid counting them as dilution.
Is stock-based compensation always bad for shareholders?
Not inherently — it's a real form of employee pay, and some level of share issuance to fund it is normal even at well-run companies. It becomes a shareholder cost specifically when it isn't offset by buybacks large enough to hold the share count flat or falling, which is the comparison this study's Check Your Holdings method is built to run.
How much dilution is normal?
There is no single number, and the honest answer from this data is that it depends almost entirely on the sector. Industrials topped out at +31% across a full decade, with Danaher, Roper and Keysight moving in the low single digits. Over the same window the Healthcare leader was up +297% and the Consumer leader +611%. Judge a holding against its own sector's range rather than against one universal threshold.
What is all-stock merger dilution?
It is share-count growth created by paying for an acquisition in stock instead of cash. It shows up under the Stock Issued During Period Value Acquisitions tag rather than anywhere in the income statement, which is why a deal press release can describe a "merger of equals" while existing holders end up with a materially smaller proportional claim. Columbia Banking System is the clearest case here: +267% on $2.6 Billion of stock issued for acquisitions against just $108 Million of Share Based Compensation.
Why did my share count go up?
Three causes account for nearly all of it in this study: stock-based compensation accumulating year after year (AMD, +109%), stock used as acquisition currency (COLB, KDP, FANG), and a one-time capital raise, usually distressed (PCG, +341% following its Chapter 11 emergence). Reading Share Based Compensation next to the stock-issuance tags in the same 10-K tells you which one you are looking at.
Which stocks have the most dilution?
Within this 677-company universe, Keurig Dr Pepper leads outright at +611%, followed by PG&E at +341%, Geron at +297%, PACB at +268%, Columbia Banking System at +267%, and Diamondback Energy at +239%. Companies whose entire business model is growth through equity issuance were excluded before ranking, as were REITs.
Wall Street's data. Main Street's price.
Institutional terminals charge thousands a year for as-filed accuracy. GeminIQ gives you the same thing for a fraction of the cost: financials built directly from raw SEC EDGAR filings, not third-party APIs, with full XBRL traceability back to the original 10-K or 10-Q. No normalized guesswork, just calculated metrics, charts, screeners, and watchlists built on numbers exactly as the company reported them. Start researching now at GeminIQ.com.
Data Appendix: This study draws on GeminIQ's as-filed XBRL extraction across 677 companies with complete FY2015-FY2024 10-K coverage and a minimum 50 Million diluted share count in FY2015, using Weighted Average Number Of Diluted Shares Outstanding, split-adjusted, cross-referenced against Share Based Compensation, Payments For Repurchase Of Common Stock, and stock-issuance tags. This study excludes real estate investment trusts (SIC 6798) given their structurally different equity-financing model. Manual review also excluded companies with restated or implausibly-scaled share count figures.
Disclaimer: The content in this blog is for educational and entertainment purposes only and does not constitute financial, legal, or tax advice. Investing involves risk, including the loss of principal. The views expressed are my own and not intended as financial advice or a guarantee of future performance.