
Pandemic Stocks That Crashed: Zoom, Teladoc, and DocuSign

By Chad Hartman
Published · Last updated
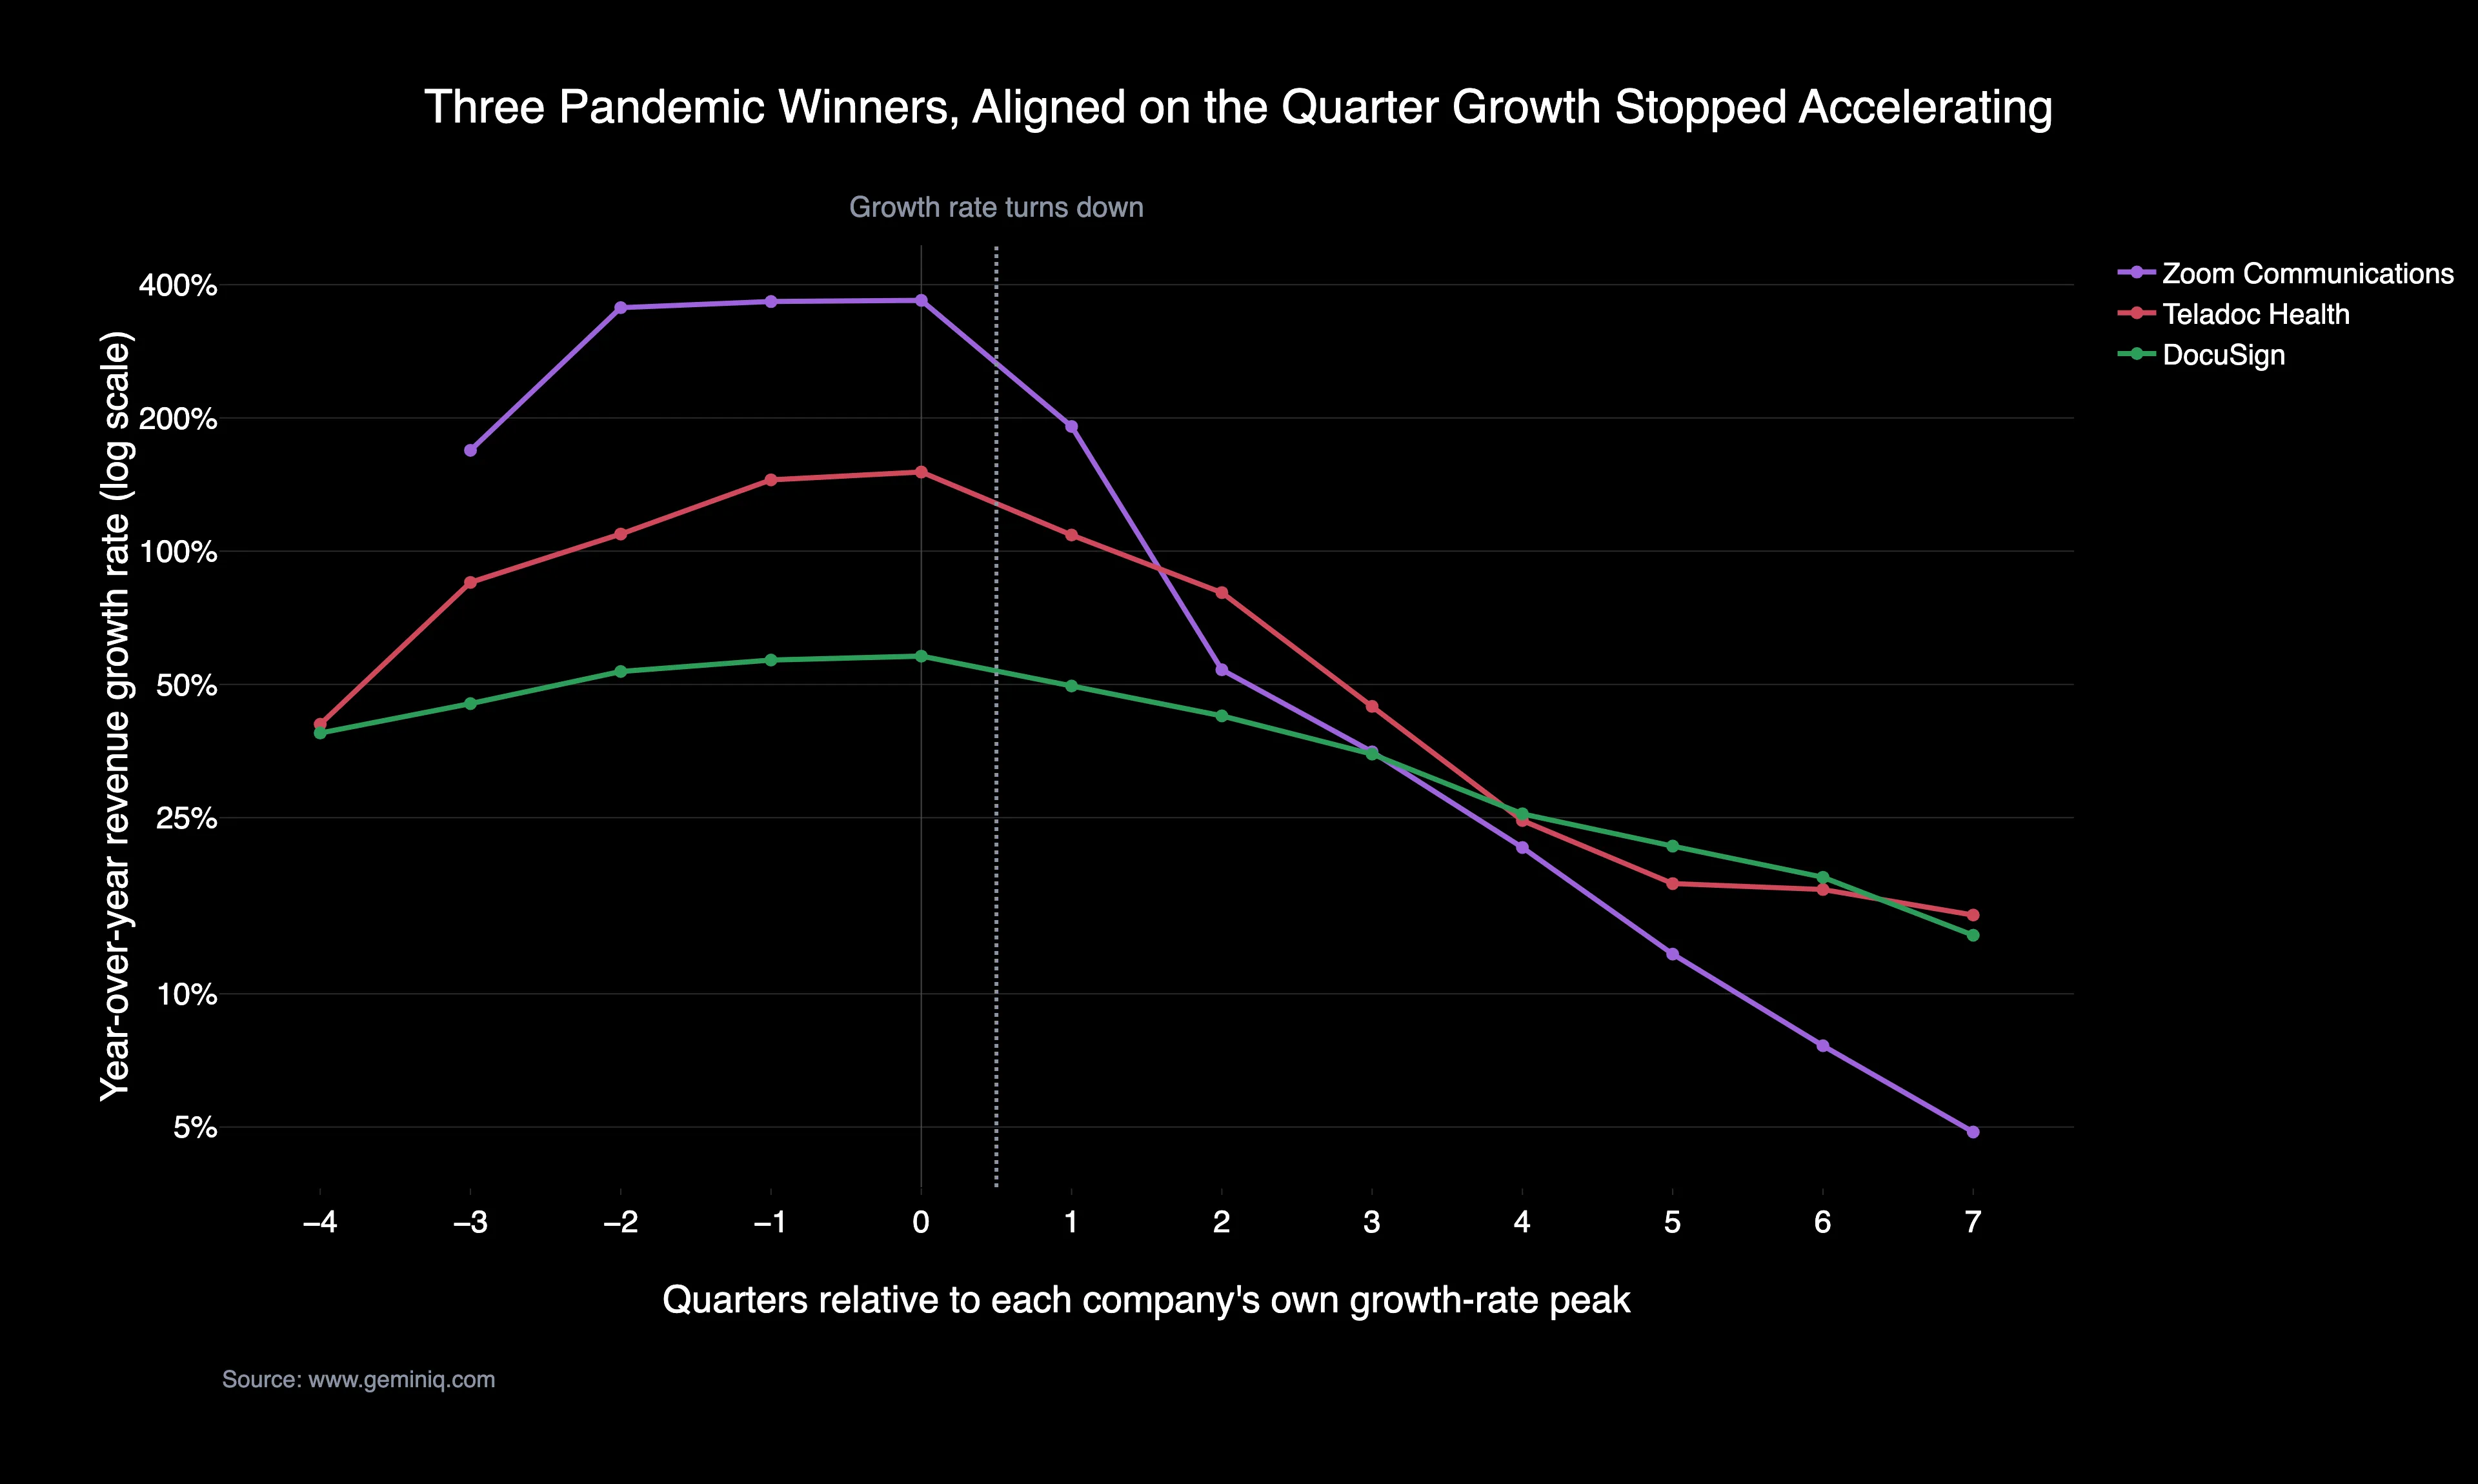
Zoom's year-over-year revenue growth rate fell from 368.8% to 191.4% in the 10-Q filed June 2, 2021, with the stock closing that quarter at $319.57. Zoom Communications ($ZM) fell 87.0% from its October 2020 quarter-end close of $460.91 to $59.98 three years later. Teladoc Health ($TDOC) fell 97.5%. DocuSign ($DOCU) fell 87.0%. A pandemic-era runup that fully unwound in hindsight reads like something nobody could have called in advance. That reading survives only if you never open the filings. Read all 106 of them in the order they were submitted to EDGAR, and the same event shows up at each company: a specific quarter where the year-over-year revenue growth rate came in below the quarter before it. The second derivative went negative. It went negative in a filing published while the stock was still trading within striking distance of its high. Growth was still enormous. Growth was no longer accelerating. Those are different facts, and only one of them was in the price.
Every figure below is drawn from Zoom Communications', Teladoc Health's, and DocuSign's own 10-K and 10-Q filings, filed between August 2015 and June 2026 — 29, 44, and 33 consecutive filings respectively, 106 in total. Each is read in the order the company filed it and joined to how the stock traded in the one to twelve months afterward. A 10-Q carries roughly three months of post-filing reaction; a 10-K carries twelve. Figures from 2020 and 2021 predate the three-year window shown on GeminIQ's stock pages and were pulled from the full as-filed history.
| Study Scope | Detail |
|---|---|
| Companies | Zoom Communications ($ZM), Teladoc Health ($TDOC), DocuSign ($DOCU) |
| Filing window | August 2015 – June 2026, 106 filings |
| Filing types | 10-K and 10-Q, as filed |
| Outcome explained | Peak-to-trough declines of 87.0%, 97.5%, and 87.0% |
| Forward-return window | 1–3 months after each 10-Q; 12 months after each 10-K |
Zoom's Revenue Growth Rate Turned From 368.8% to 191.4% in June 2021
Every extrapolation story dies the same way. Not when growth goes negative — that comes years later, if at all — but when the rate of growth stops climbing. The filings date that moment precisely for all three companies, and all three dates land in a nine-week stretch of 2021.
The Filing Data: Zoom's Revenues grew 368.8% year over year in the quarter ending January 31, 2021. In the next quarter, ending April 30, 2021, they grew 191.4% — the first time the rate had come in below the prior quarter since the pandemic began. That filing hit EDGAR on June 2, 2021, with the stock closing the quarter at $319.57. Teladoc's rate peaked at 150.9% in its March 2021 quarter and fell to 108.8% in June, filed August 2, 2021, with the stock at $166.29. DocuSign's peaked at 57.9% in its April 2021 quarter and fell to 49.6% in July, filed September 3, 2021, with the stock at $298.04 — its highest quarterly close on record.
The Signal: Zoom's sequential collapse was starker still than the annual figure. Quarterly Revenues grew 102.2% over the prior quarter in the period ending July 31, 2020, then 17.1% in the period ending October 31, 2020 — an 85.1-point deceleration inside a single quarter, disclosed in a 10-Q filed December 4, 2020. That was the same quarter Zoom closed at $460.91 on a Price-to-Sales Ratio of 67.1 and a market capitalization of $131.3 Billion. Pulling the raw Revenues line quarter by quarter through GeminIQ's Financial Statements makes that swing visible without any trailing-twelve-month smoothing to hide it. The deceleration and the all-time high are in the same filing.
Deferred Revenue Turned First: Zoom 348.0% to 309.6%, DocuSign 61.9% to 53.6%
Recognized revenue is a lagging number for a subscription business — it reports contracts signed quarters earlier. The balance sheet gets there faster, and in two of these three cases it got there a full filing ahead of the income statement.
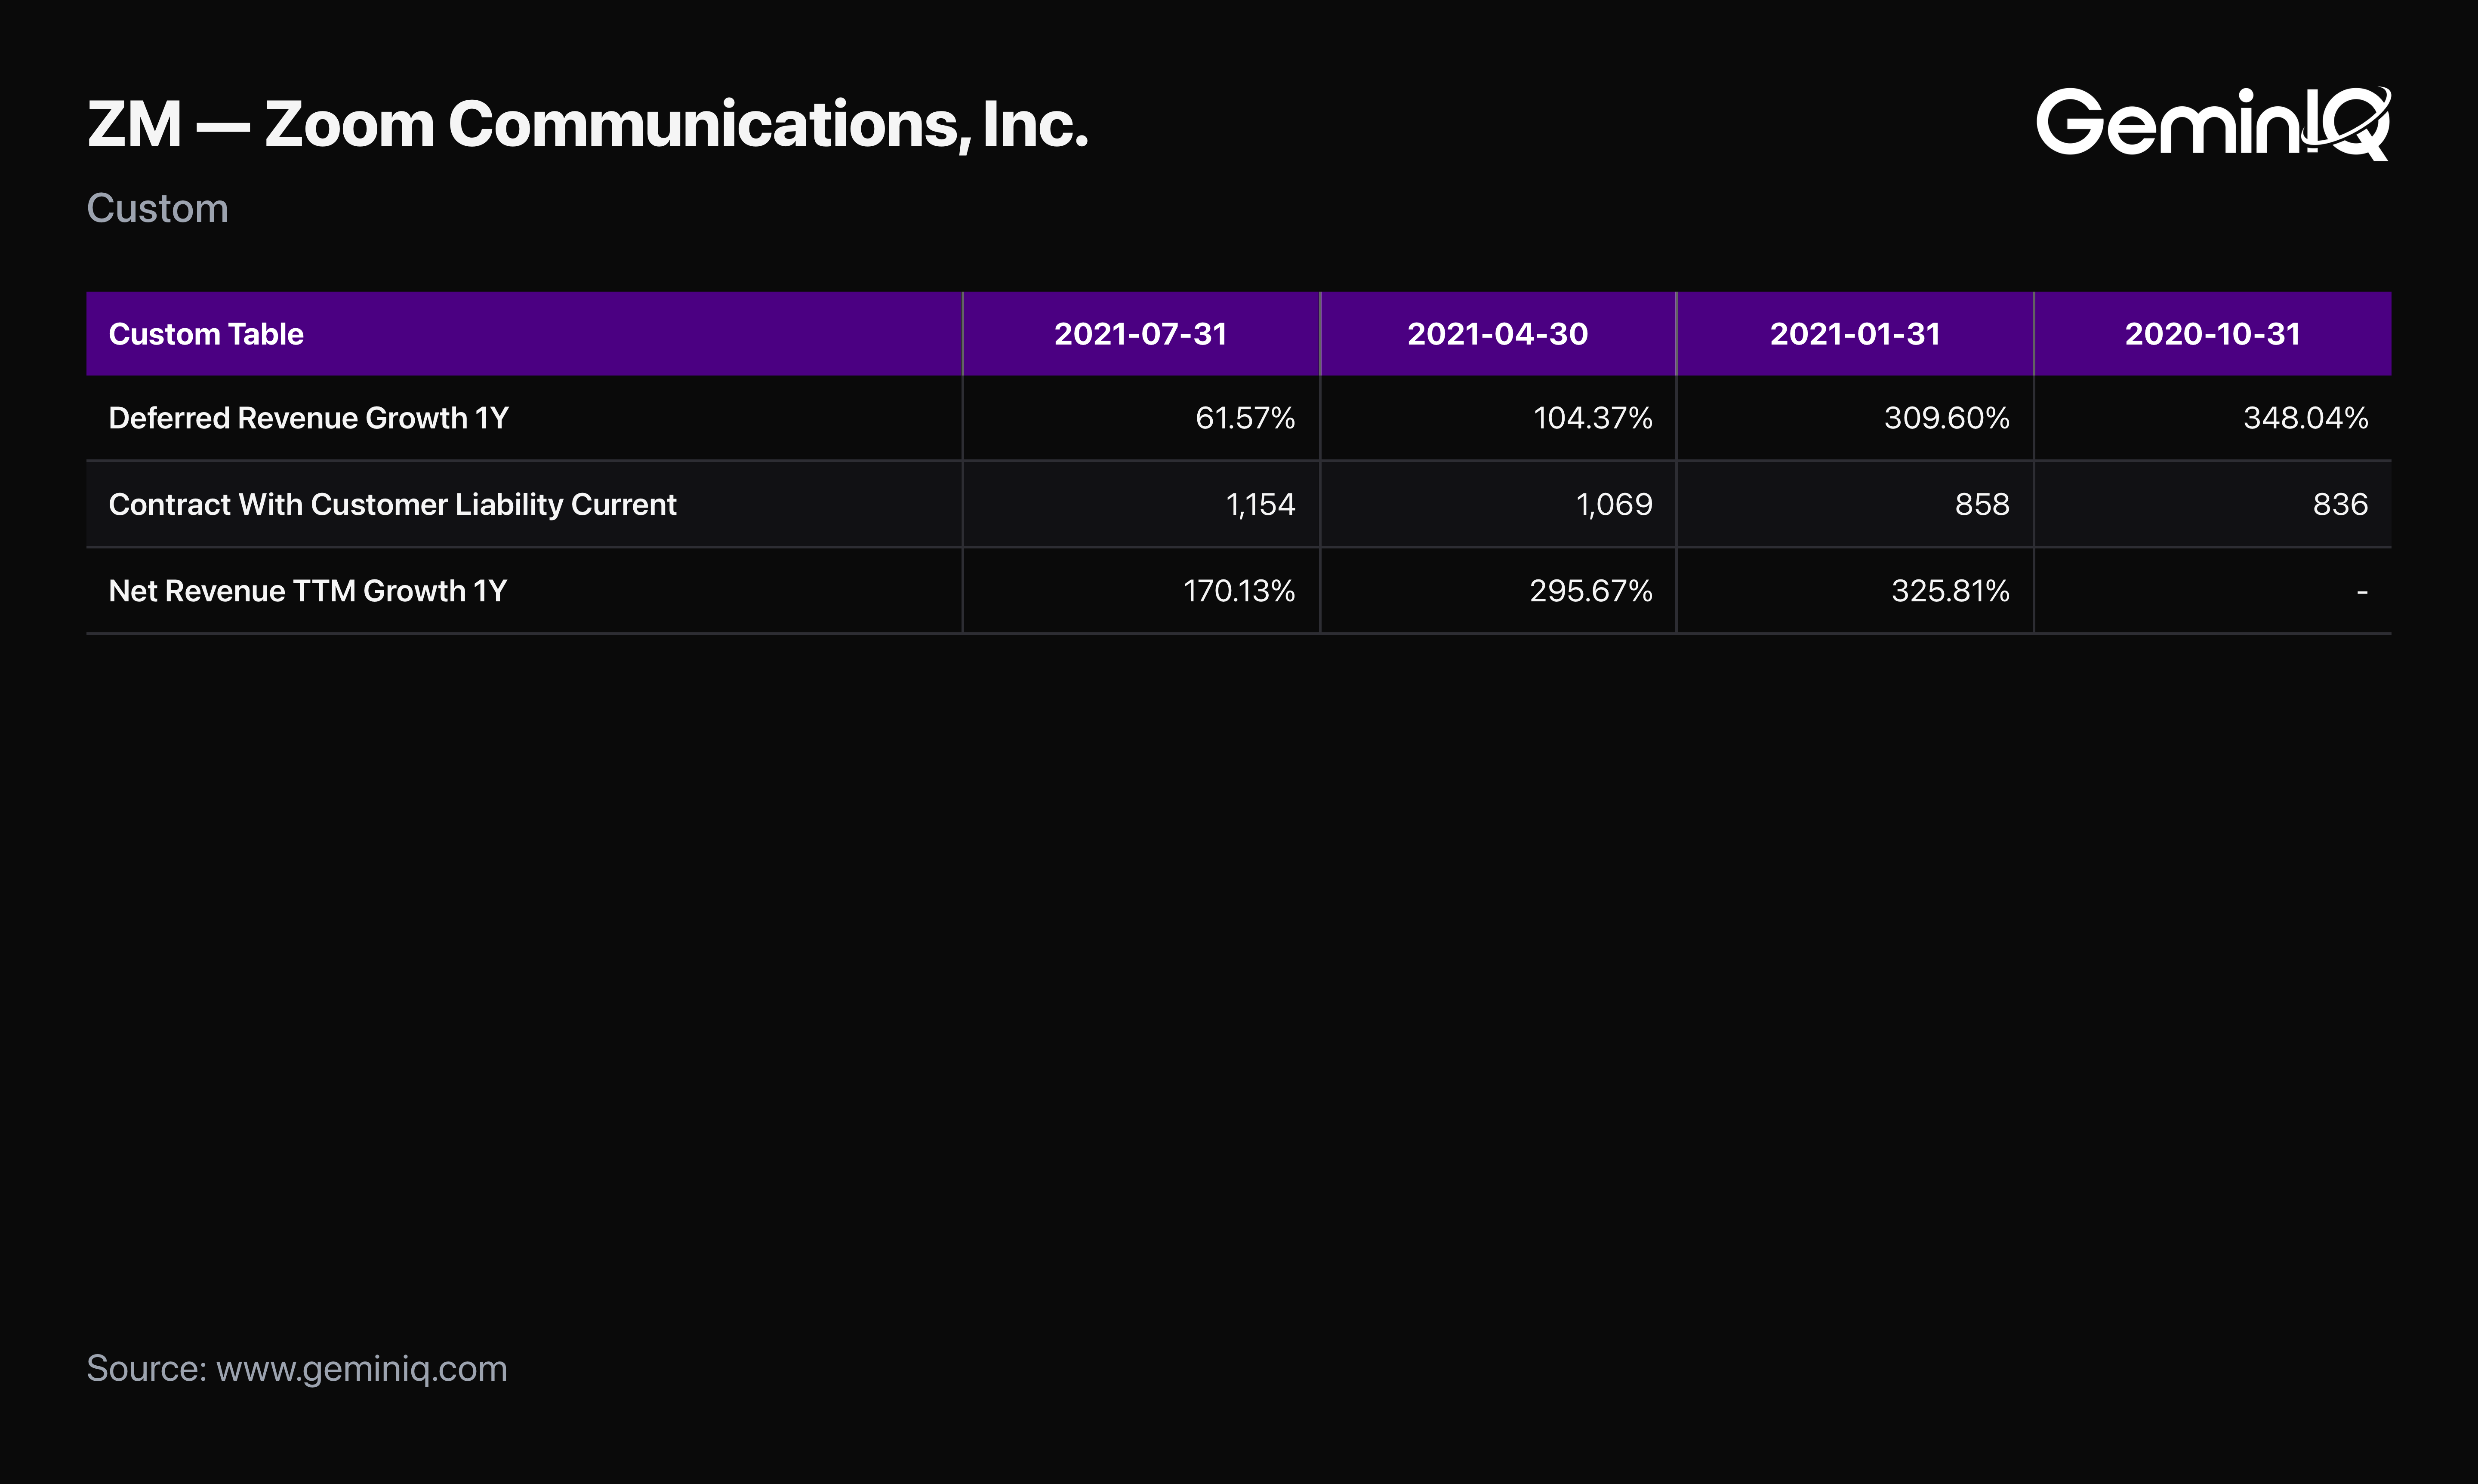
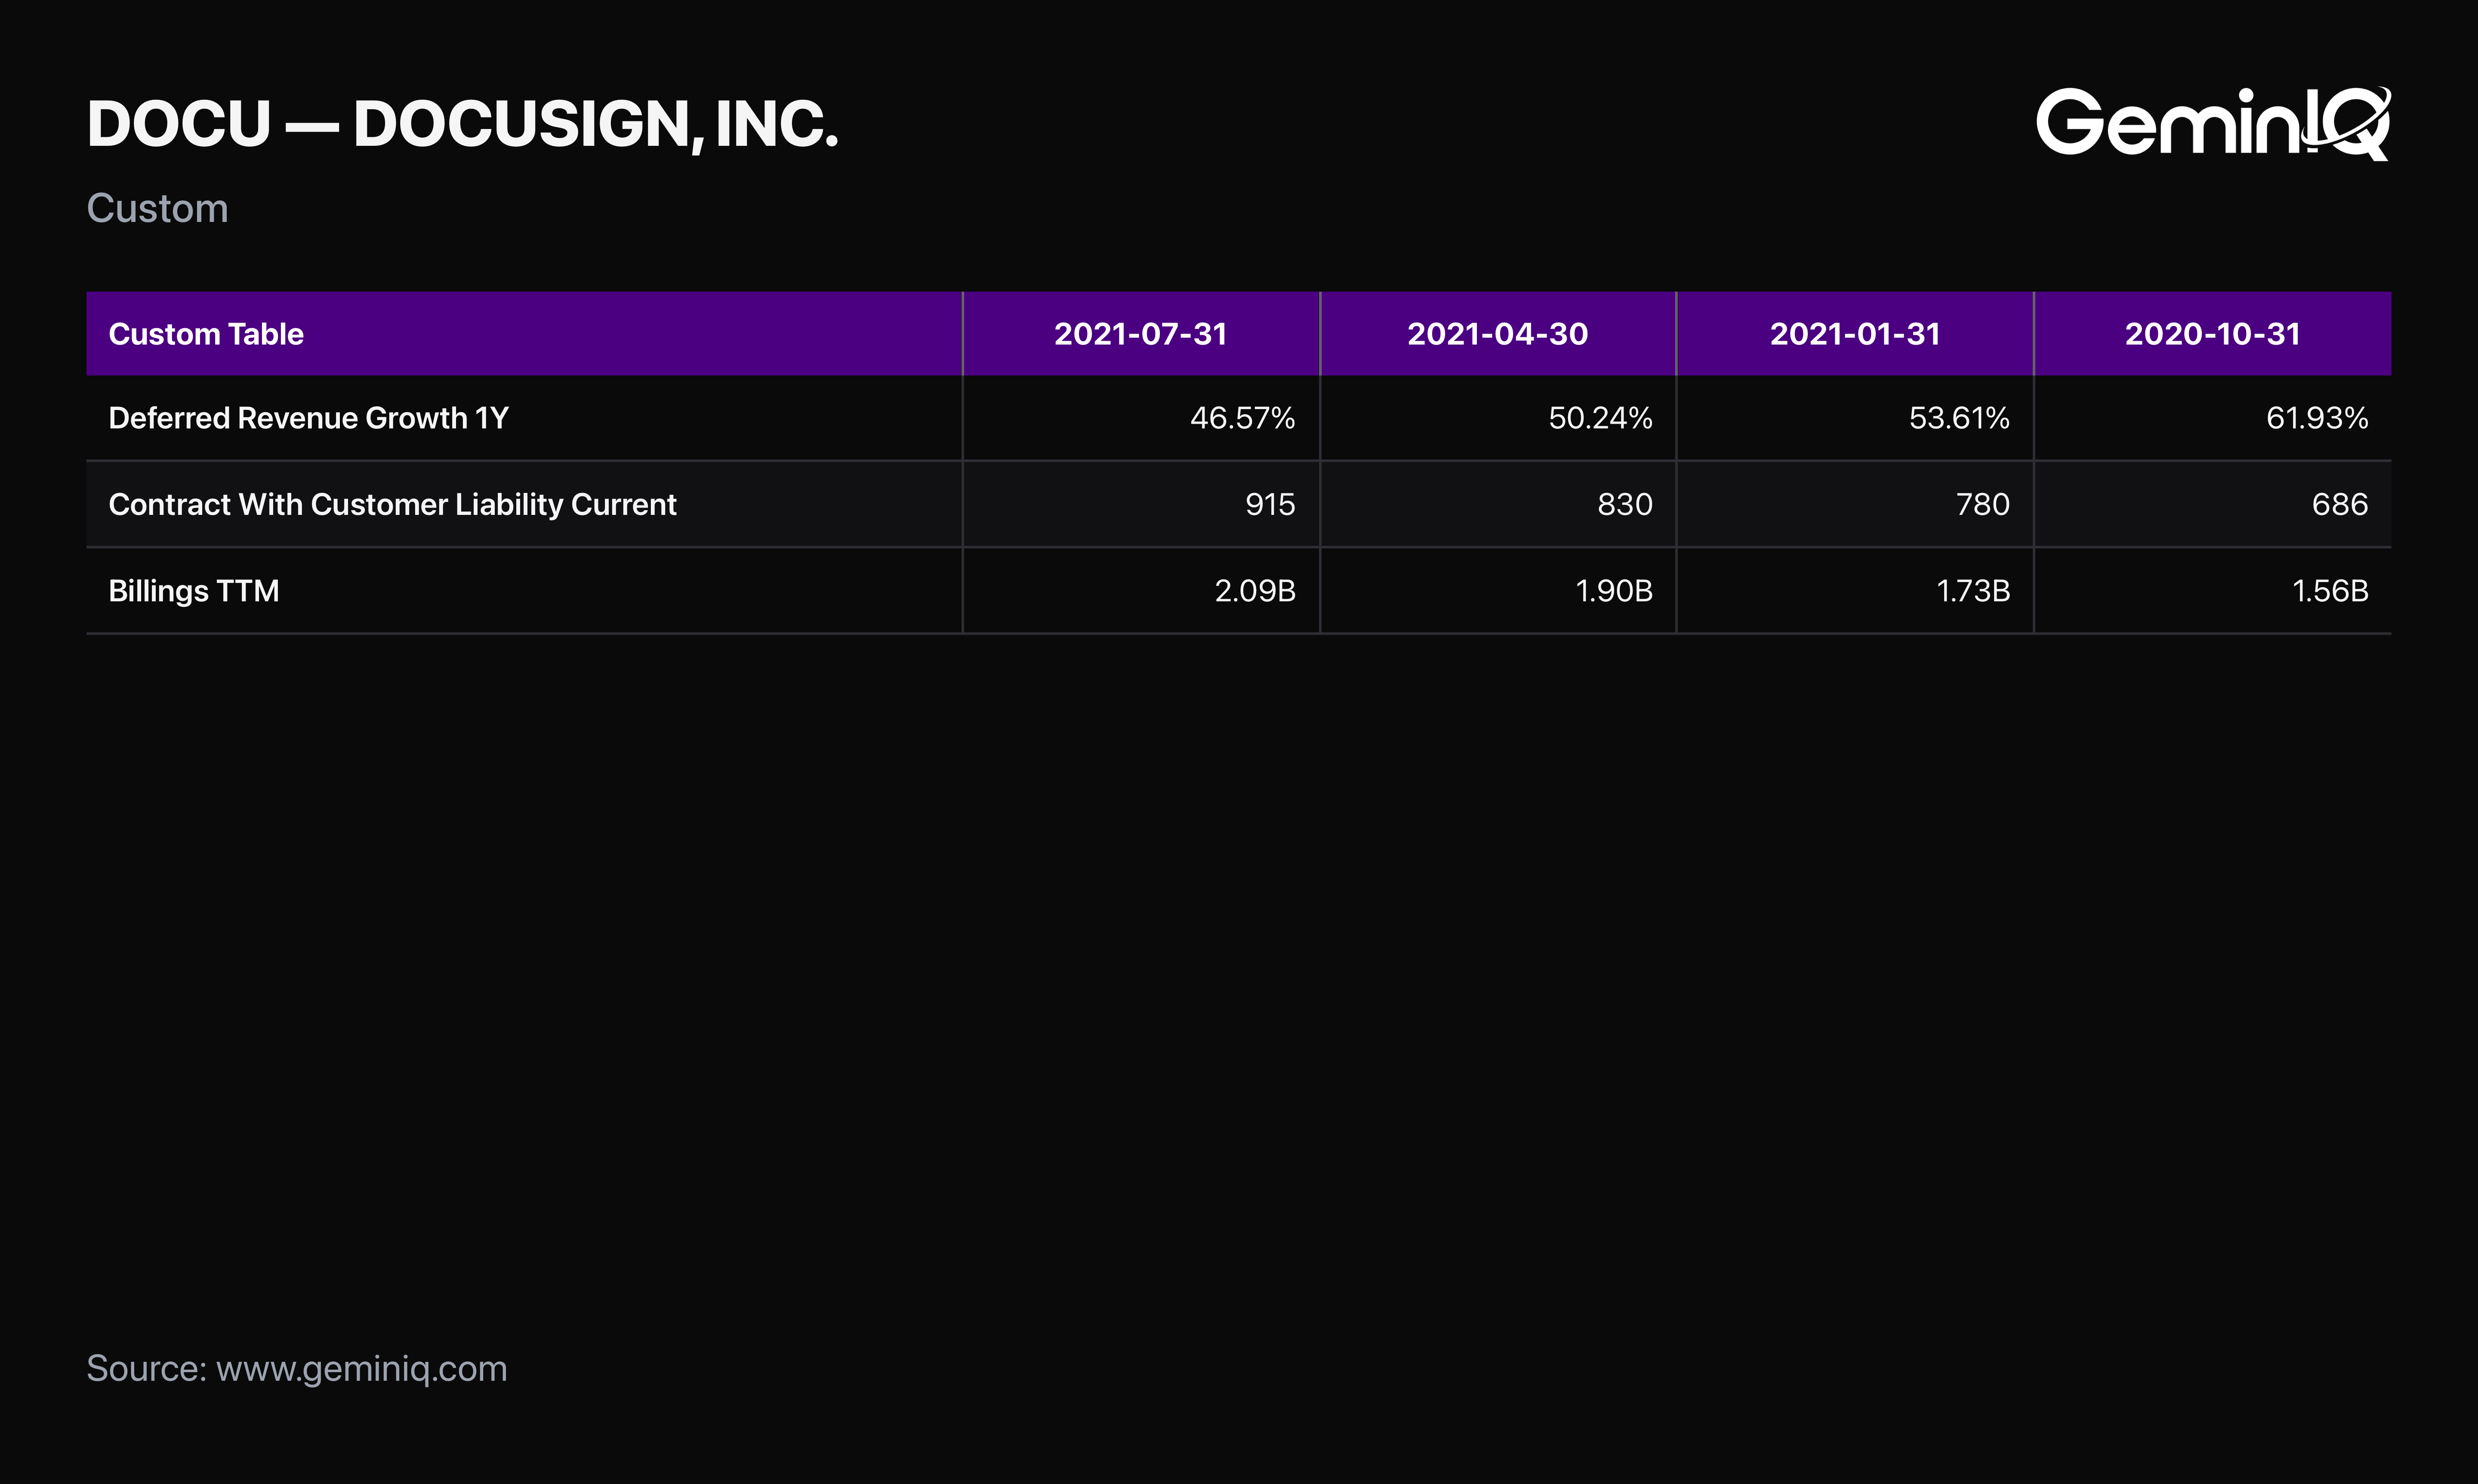
The Filing Data: Zoom's Contract With Customer Liability Current — the deferred revenue balance — grew 348.0% year over year at October 31, 2020, then 309.6% at January 31, 2021. That deceleration was filed March 18, 2021, one quarter before recognized revenue growth turned. DocuSign's deferred revenue growth peaked earlier still, at 61.9% in its October 2020 quarter, falling to 53.6% in January 2021 and 50.2% in April 2021 — two consecutive declines filed before its recognized revenue growth rate ever came in light. DocuSign's Billings, which adds the change in deferred revenue back to recognized revenue, tells the same story: 56.8% growth in the January 2021 quarter, 55.5% in April.
The Signal: Nobody needed a channel check or a management call to see this. The customers had already stopped prepaying at the old rate, and the company had said so in a document filed with the SEC. GeminIQ's pre-calculated Deferred Revenue Growth sits in the same Calculated Metrics table as revenue growth, one row apart — which turns a two-quarter head start into something a reader notices on a single screen.
The Market Took a Year: Zoom Fell 55.35%, Teladoc 68.49%, DocuSign 43.16%
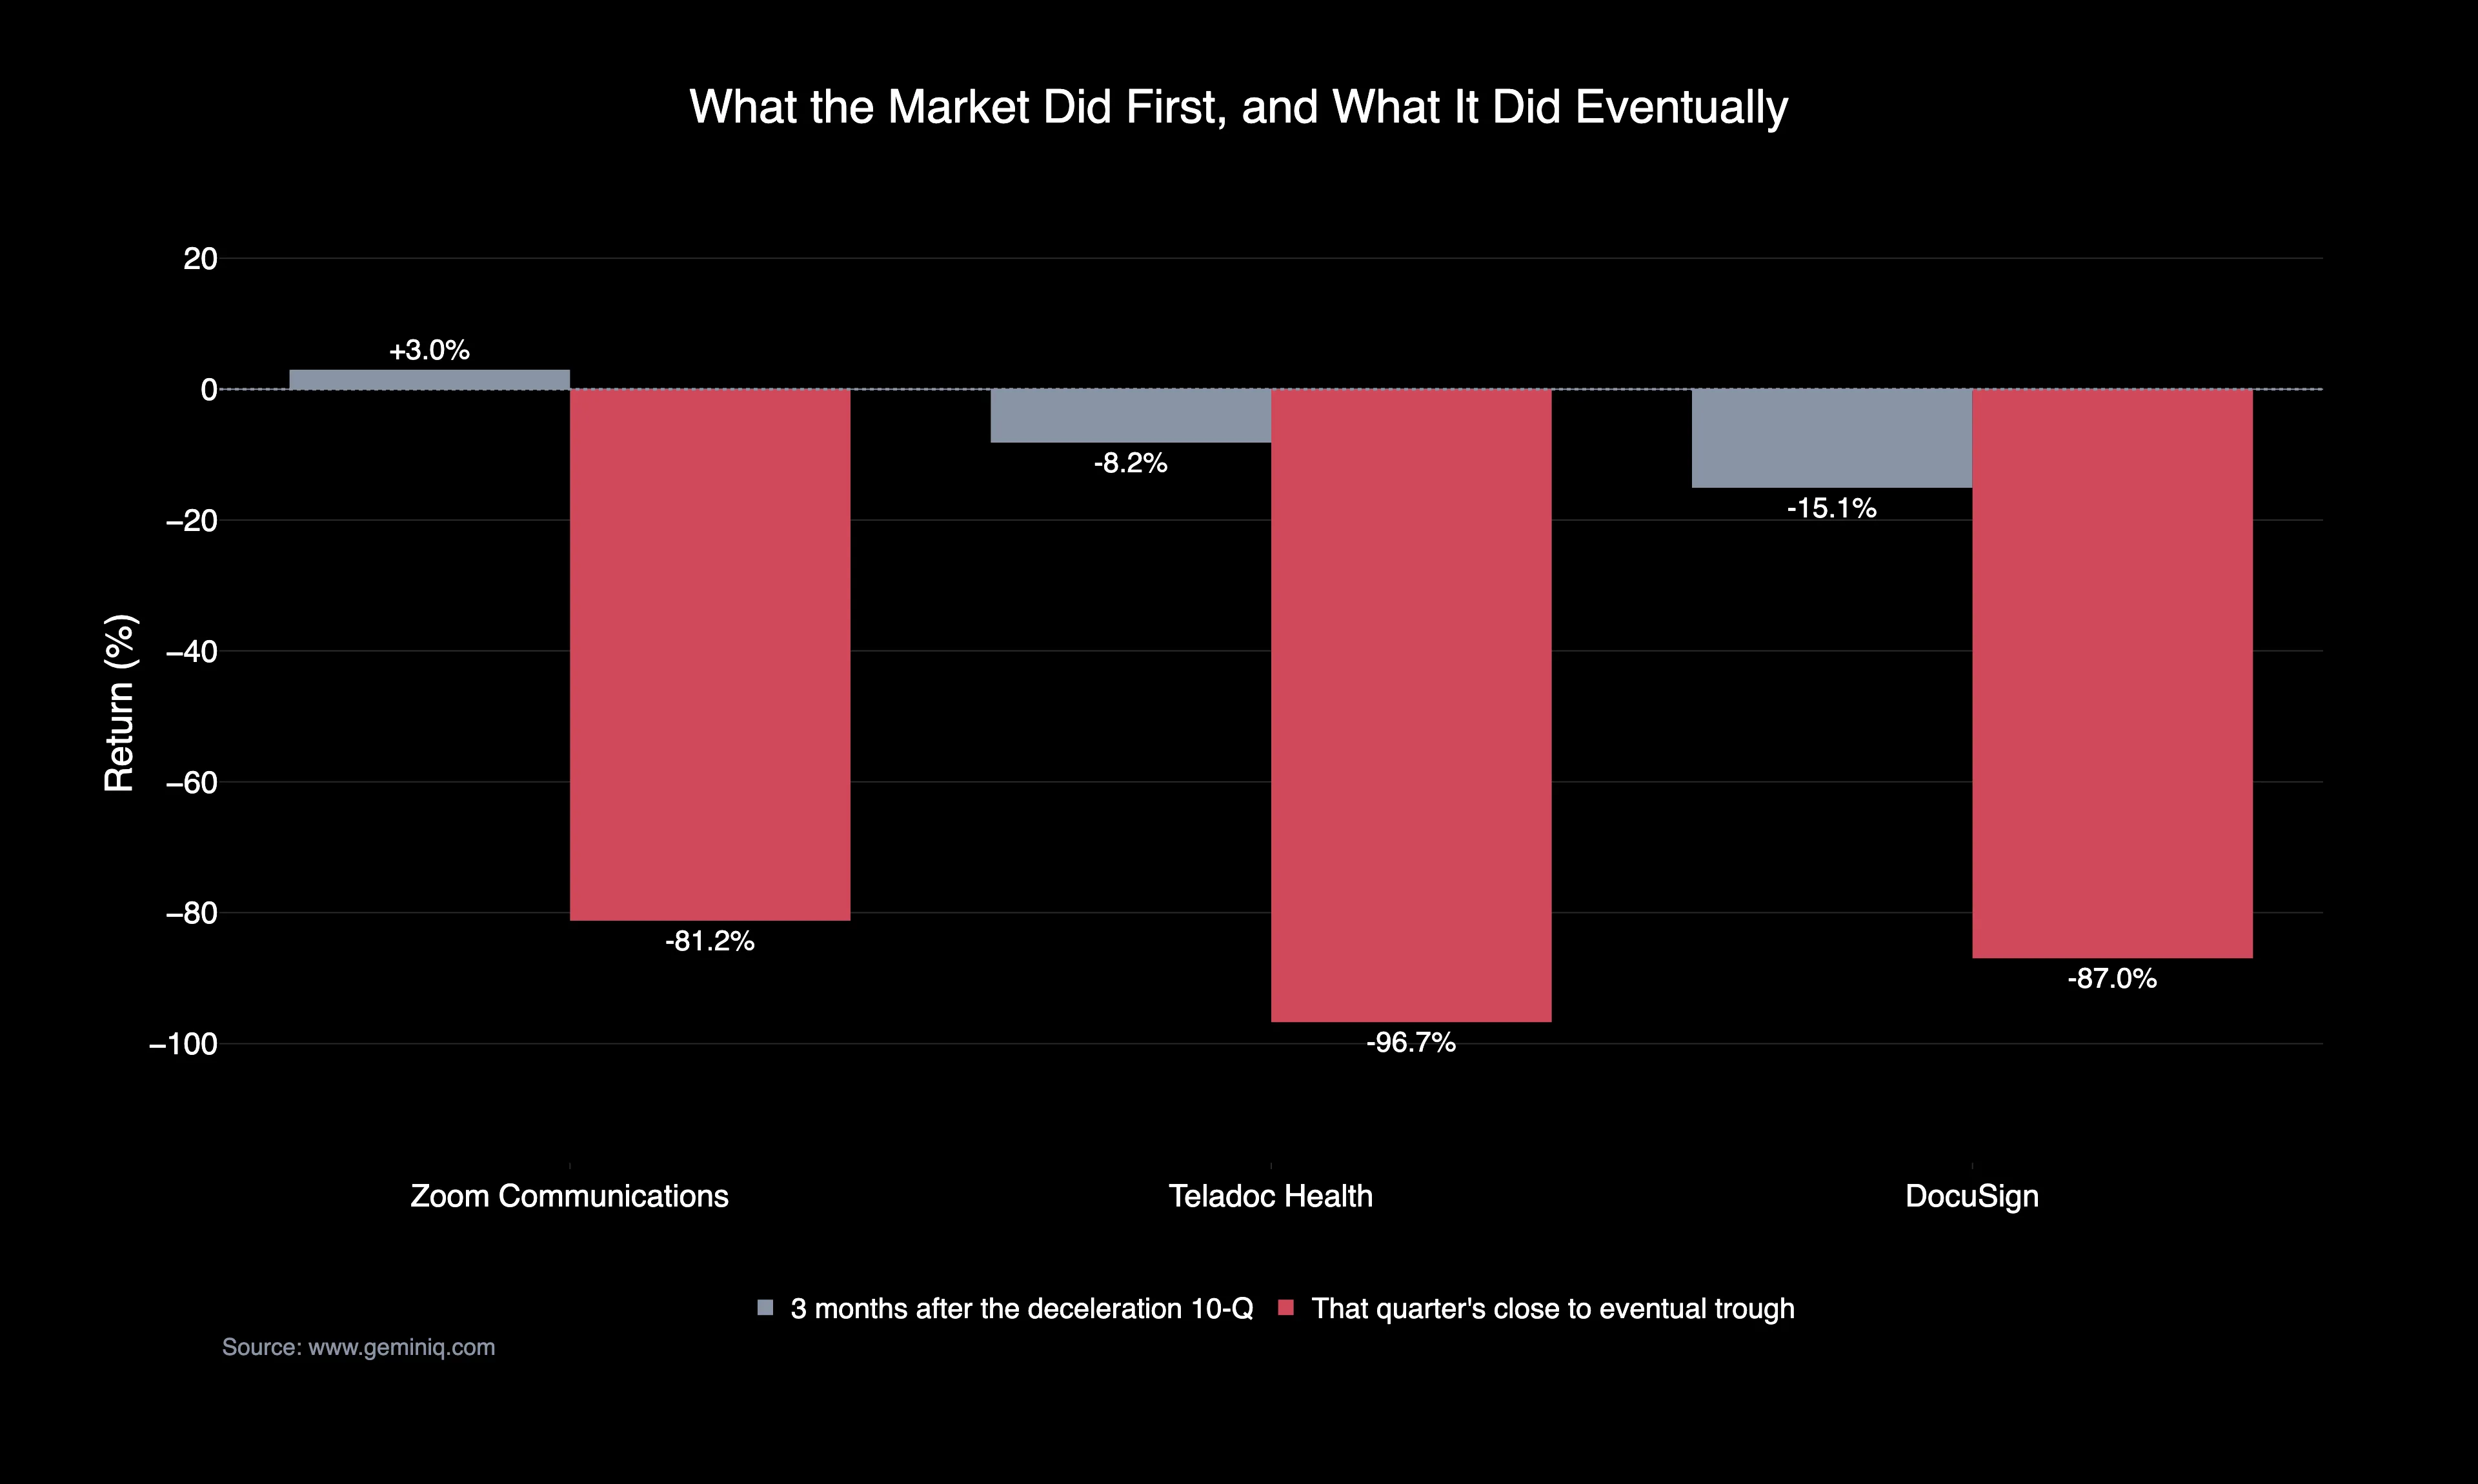
The market did not punish the deceleration filings. It barely noticed them.
The Filing Data: In the three months after Zoom filed the 10-Q containing its first slower growth rate, the stock was up 2.98%. Teladoc was down 8.18% over the same window after its deceleration filing; DocuSign was down 15.07% after its own. Now compare the annual reports. Each company's last 10-K filed while the growth story was still intact was followed by twelve months of cumulative returns that landed at -55.35% for Zoom, -68.49% for Teladoc, and -43.16% for DocuSign. DocuSign's path is the most instructive: six months after that 10-K, the cumulative figure stood at +36.90%. By month nine it was -33.27%, and by month twelve -43.16%.
The Signal: These are historical associations across a small named sample, not forecasts, and three companies cannot establish a base rate. What they do establish is a sequence. The deceleration was disclosed, the market kept paying for two to four more quarters, and the repricing arrived long after the filing that justified it. Measured from the quarter each stock closed when its growth rate first came in light, Zoom went on to fall 81.2%, DocuSign 87.0%, and Teladoc 96.7%. Every one of those numbers was on file before the decline began. The gap between disclosure and repricing is where the money went.
Teladoc Wrote Off $13.403 Billion of Livongo Goodwill in FY2022
Teladoc's deceleration has a second layer the other two don't, and it sits on the balance sheet in a number large enough to be difficult to misread.
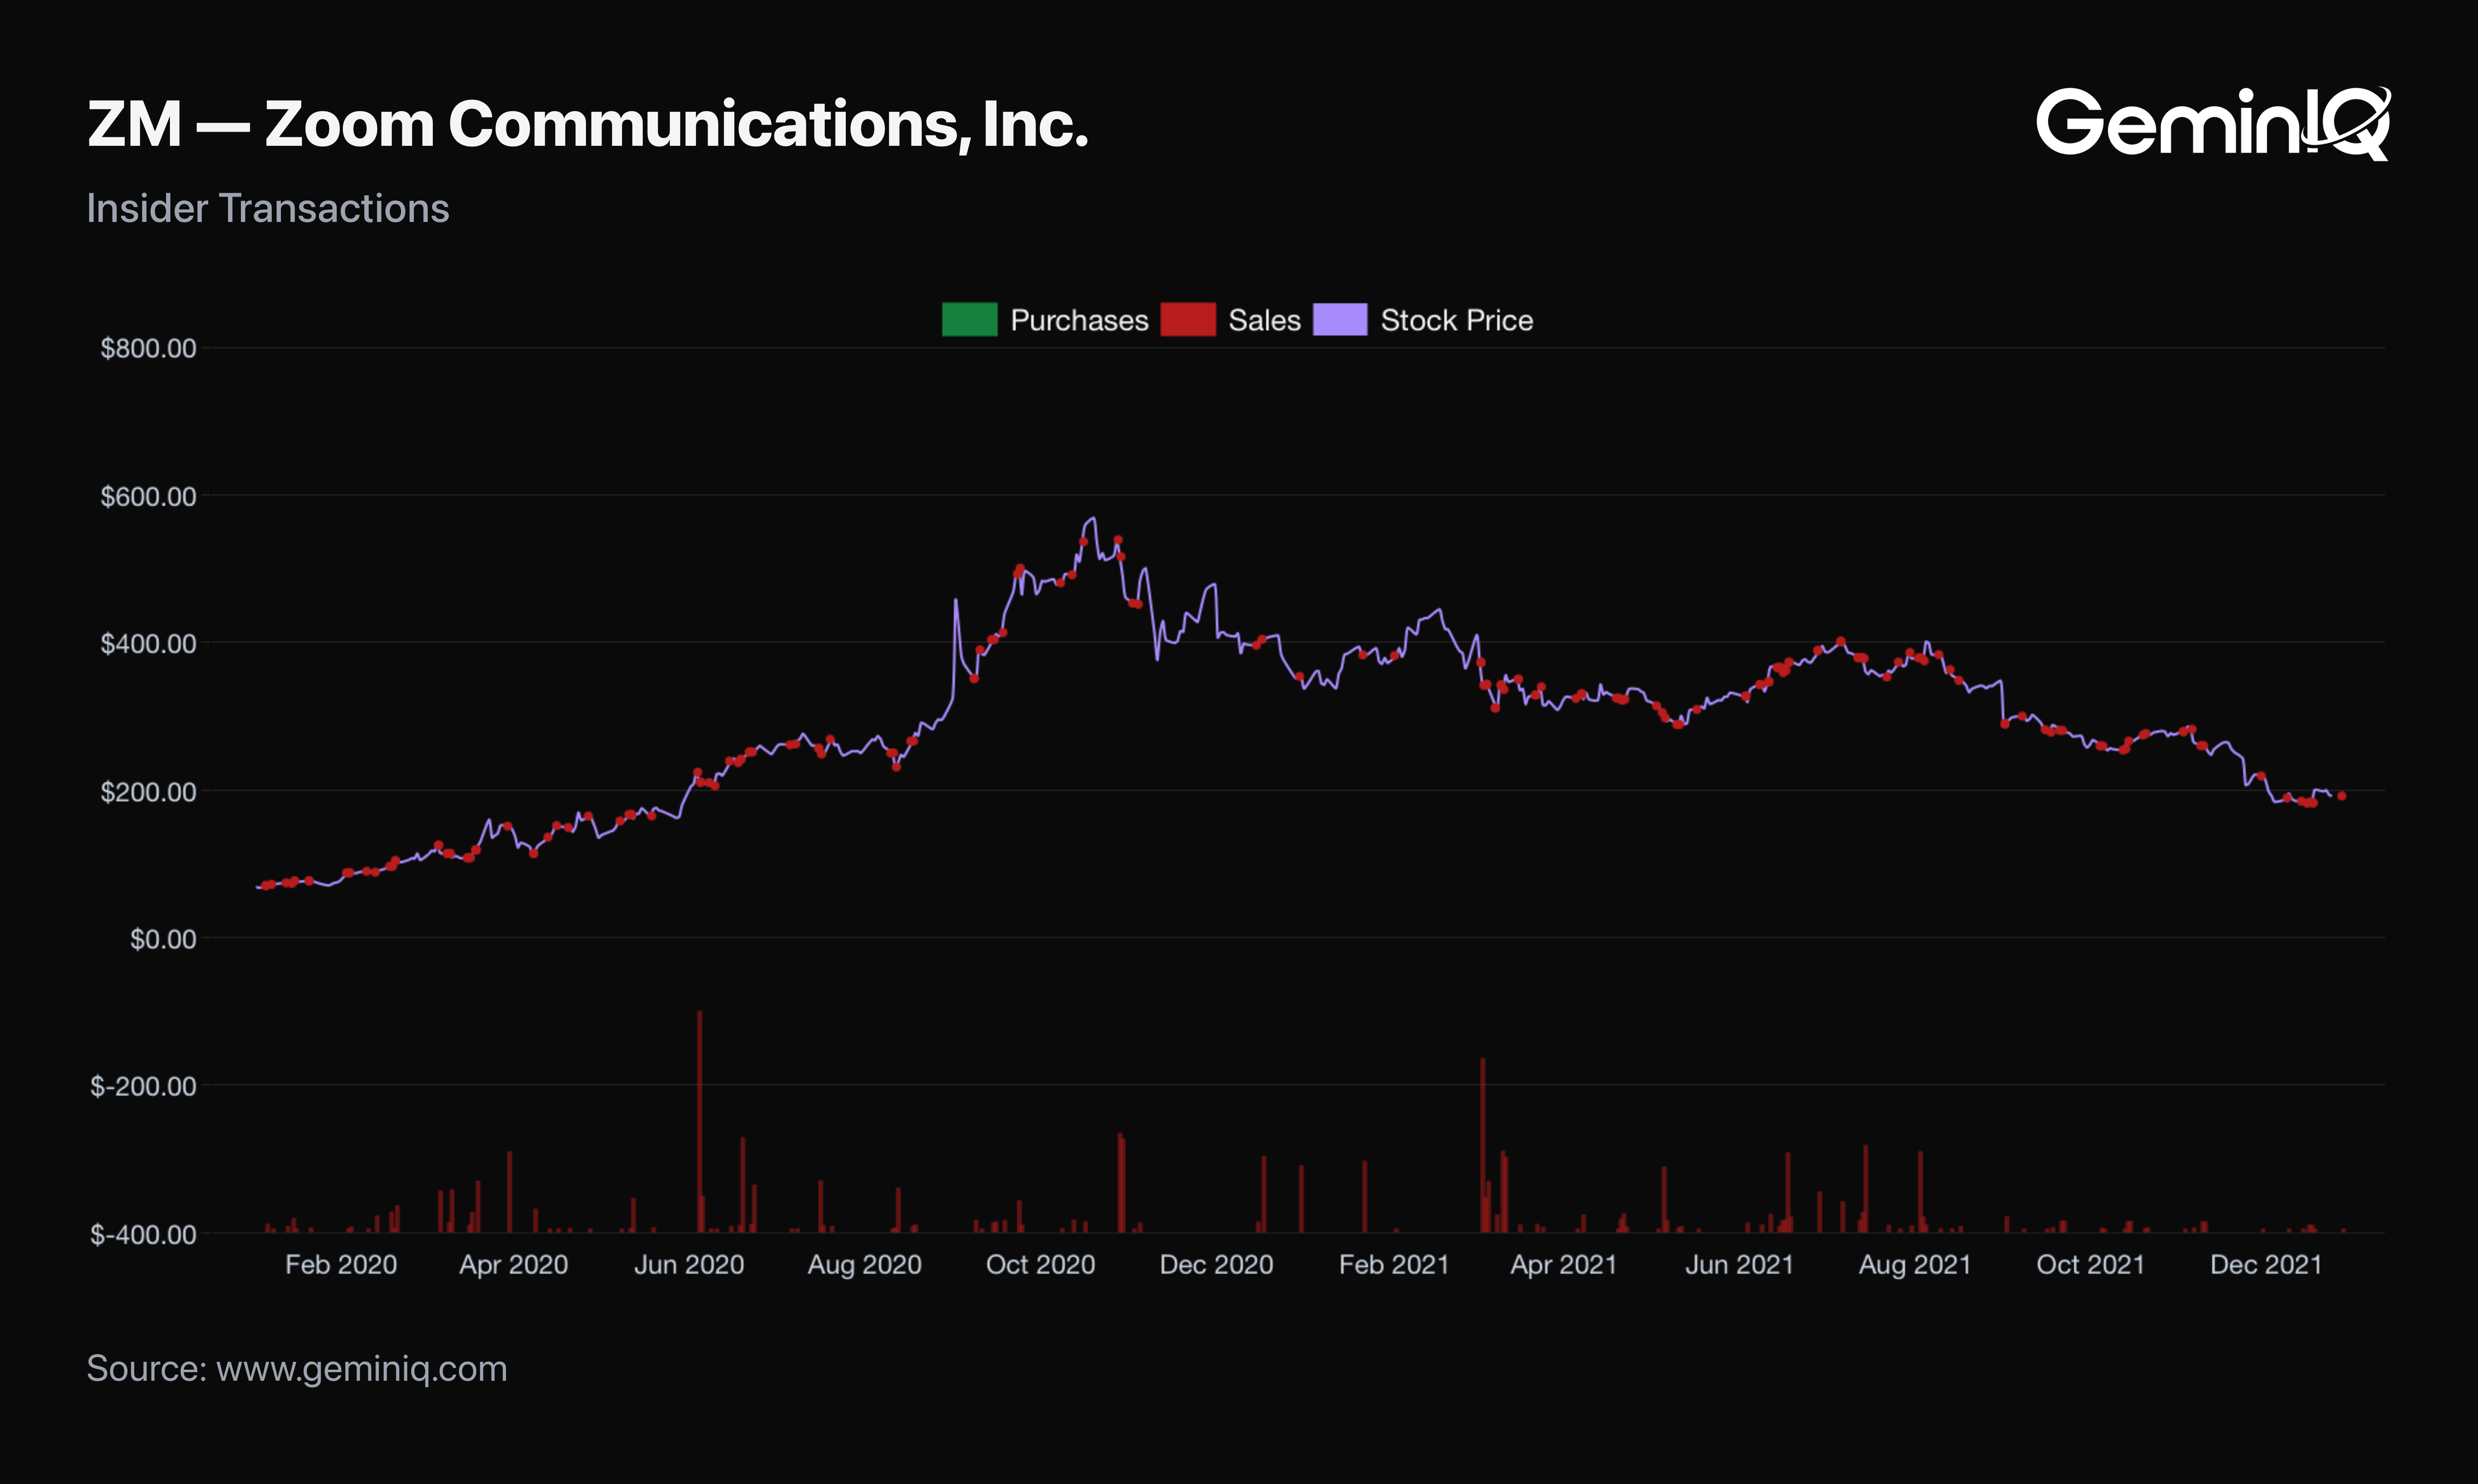
The Filing Data: Teladoc's Goodwill was $742.3 Million at June 30, 2020. By December 31, 2020 it was $14.581 Billion, following the Livongo acquisition, and it stood at $14.504 Billion in the FY2021 10-K. Against that, Teladoc's full-year Revenues for 2021 came to $2.033 Billion — roughly seven times more goodwill on the balance sheet than revenue on the income statement. The reckoning started in the quarter after the growth rate turned. Goodwill Impairment Loss was $6.600 Billion in the March 2022 quarter, $3.030 Billion in June, and $3.773 Billion in December, totaling $13.403 Billion for FY2022. Goodwill closed 2022 at $1.073 Billion and stood at $283.19 Million by June 30, 2024.
The Signal: Teladoc wrote off roughly 98% of the goodwill it carried at the end of 2021 within thirty months. An impairment is management conceding in an SEC filing that the future cash flows it paid for will not arrive. Pulling the raw Balance Sheet quarter over quarter through GeminIQ's Financial Statements, the gap between a $14.5 Billion goodwill balance and a $2.0 Billion revenue base was visible in the FY2021 annual report — filed February 28, 2022, more than two months before the first write-down was disclosed.
Zoom's Stock Compensation Went From 10.4% to 29.3% of Revenue
Revenue growth rates fell by an order of magnitude at all three companies. One major expense line did not follow them down, and at Zoom it went the other way entirely.
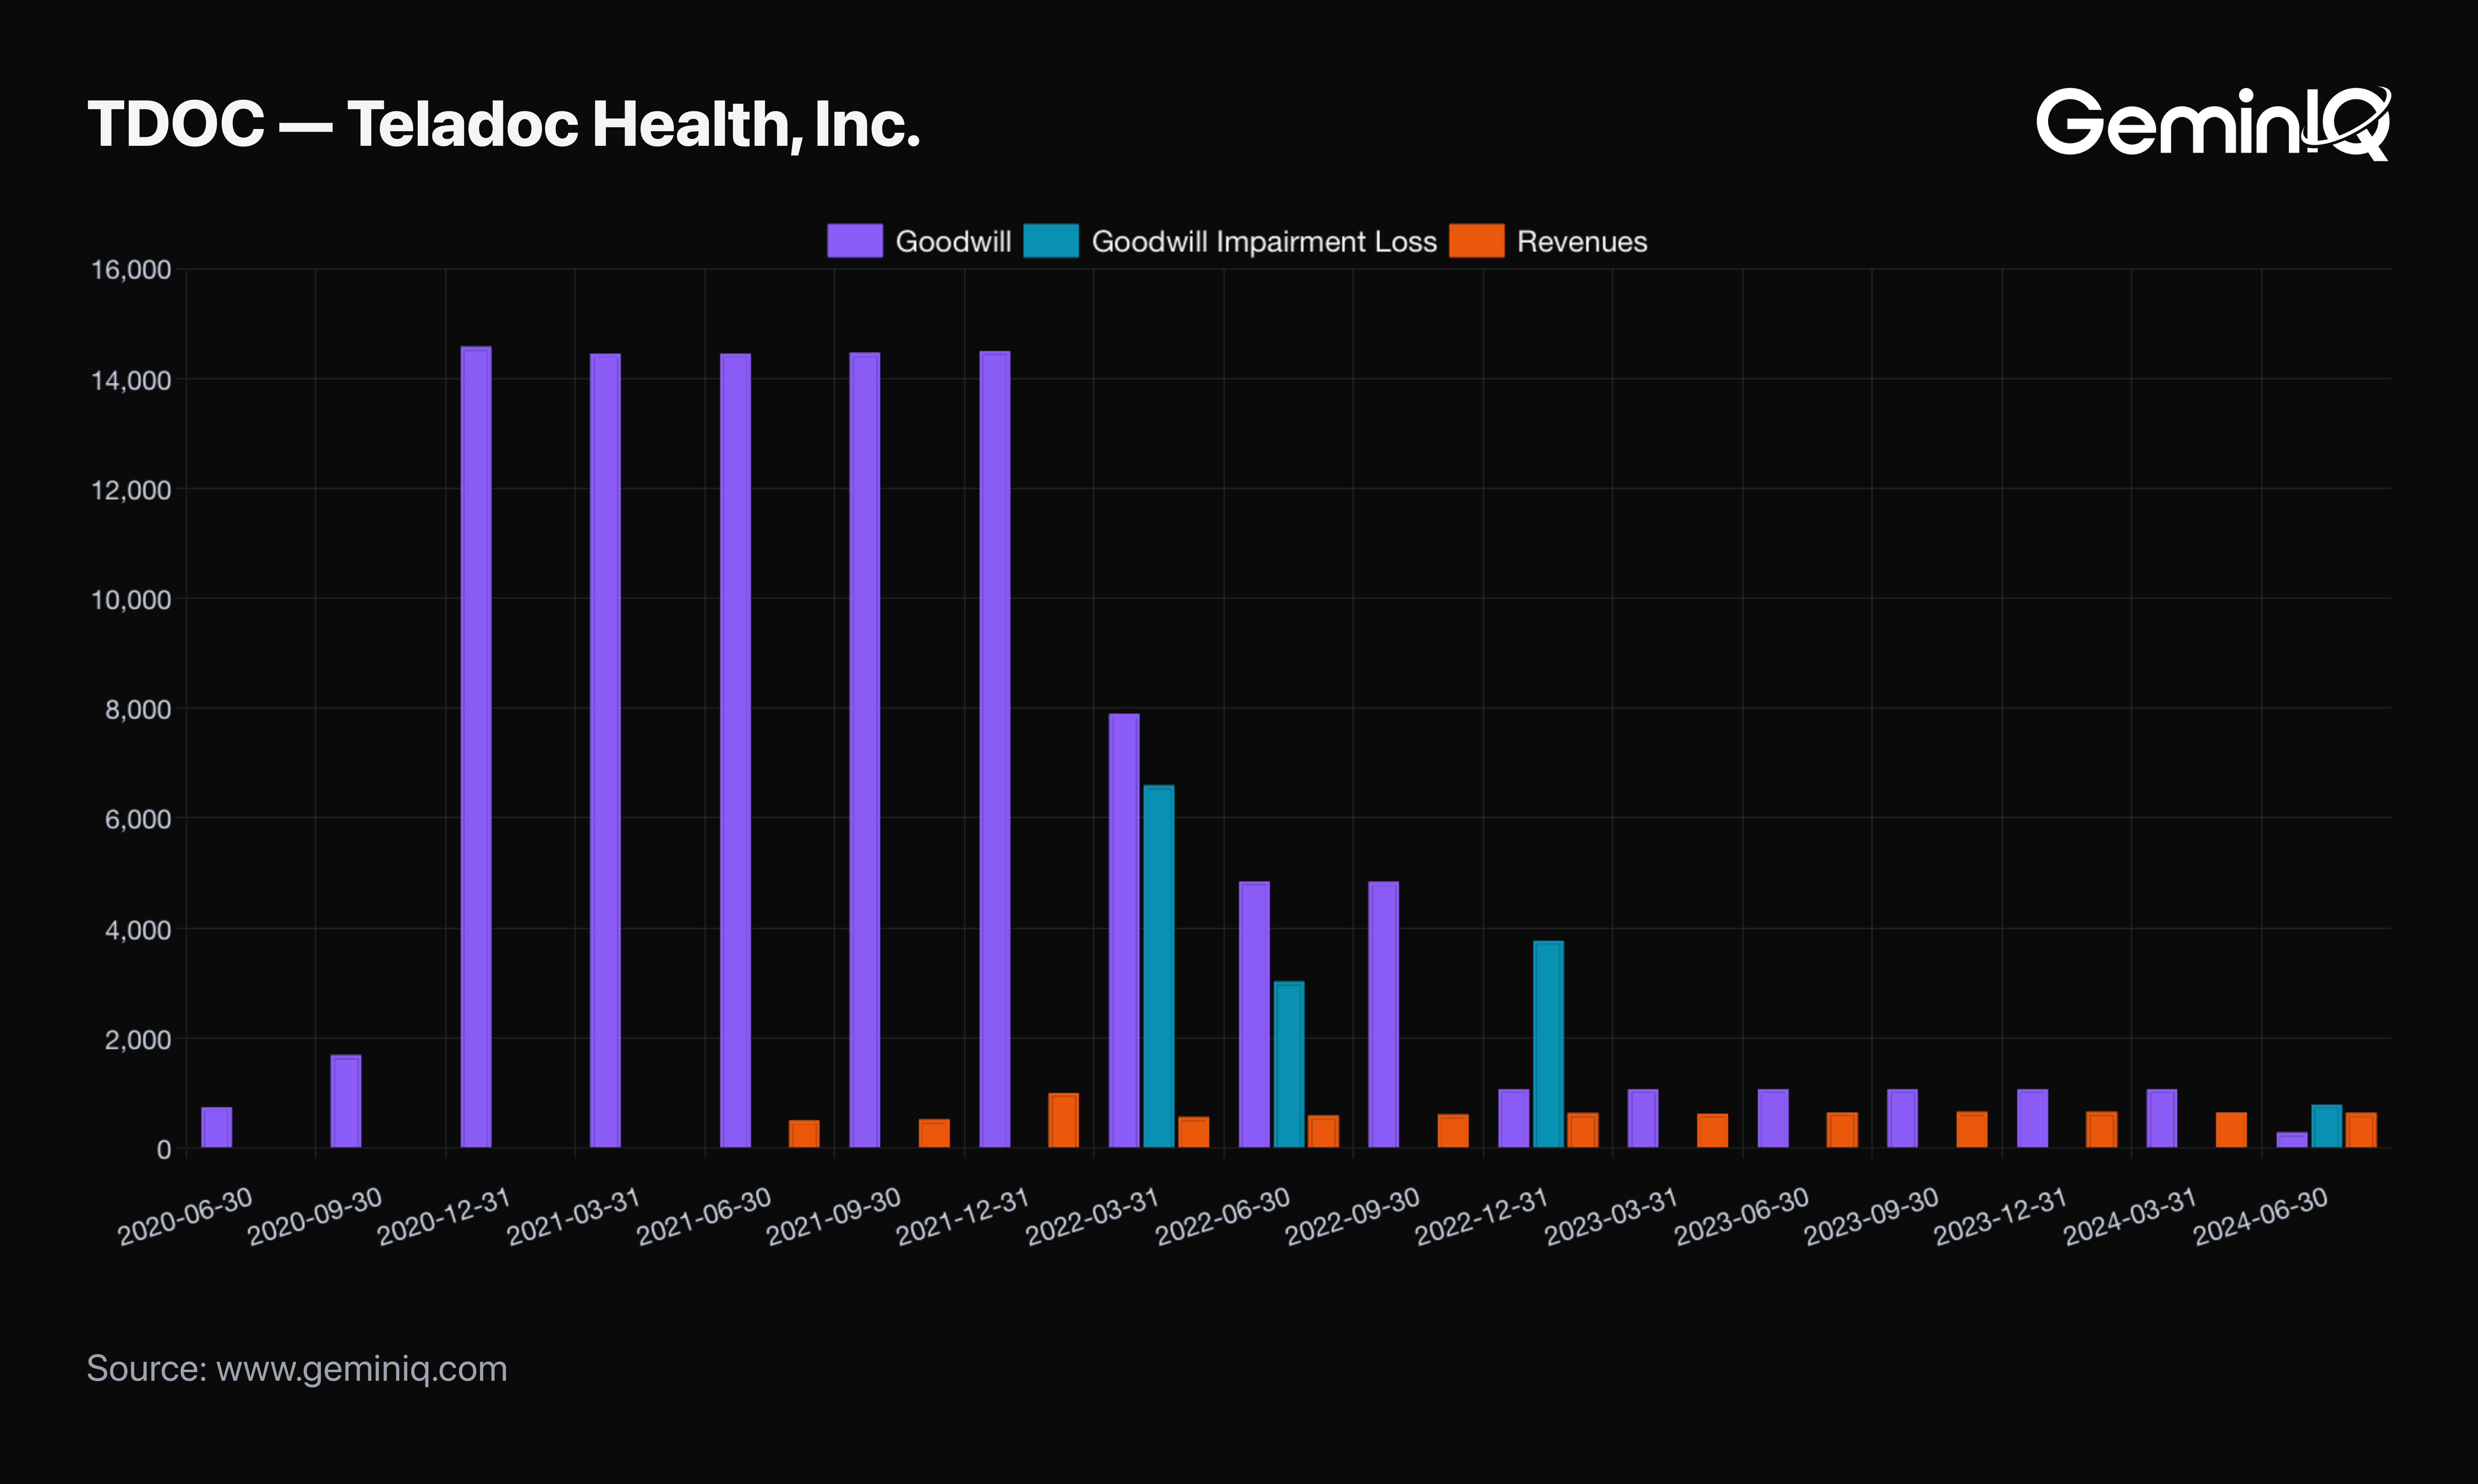
The Filing Data: Zoom's annual Share Based Compensation was $275.8 Million in FY2021, or 10.4% of Revenues. By FY2023 it reached $1,285.8 Million, or 29.3% of revenue. Over those two years Zoom's revenue grew 65.7% while its stock compensation grew 366.2% — in a period when year-over-year revenue growth had already fallen to 7.1%. DocuSign's Allocated Share Based Compensation Expense behaved differently but no better: $286.9 Million in FY2021 at 19.7% of revenue, rising to $616.8 Million in FY2024 at 22.3%, holding roughly one fifth of every revenue dollar while trailing-twelve-month revenue growth fell from 49.2% to 9.8%.
The Signal: A compensation structure sized for hypergrowth does not resize itself when hypergrowth ends. GeminIQ's pre-calculated Stock-Based Compensation to Revenue makes that divergence a single trackable line rather than a two-statement reconciliation. Zoom's ratio nearly tripled in twenty-four months. That is what it looks like when a company keeps paying for a growth rate it no longer has.
Zoom, Teladoc, and DocuSign Insiders Sold $2.034 Billion Across 2020 and 2021
What are the people actually running the company doing with their own money? Form 4 data is quarterly and lands with a lag, so it answers that question late — a hook rather than a trigger. Across two years and three companies, the answer is still hard to ignore.
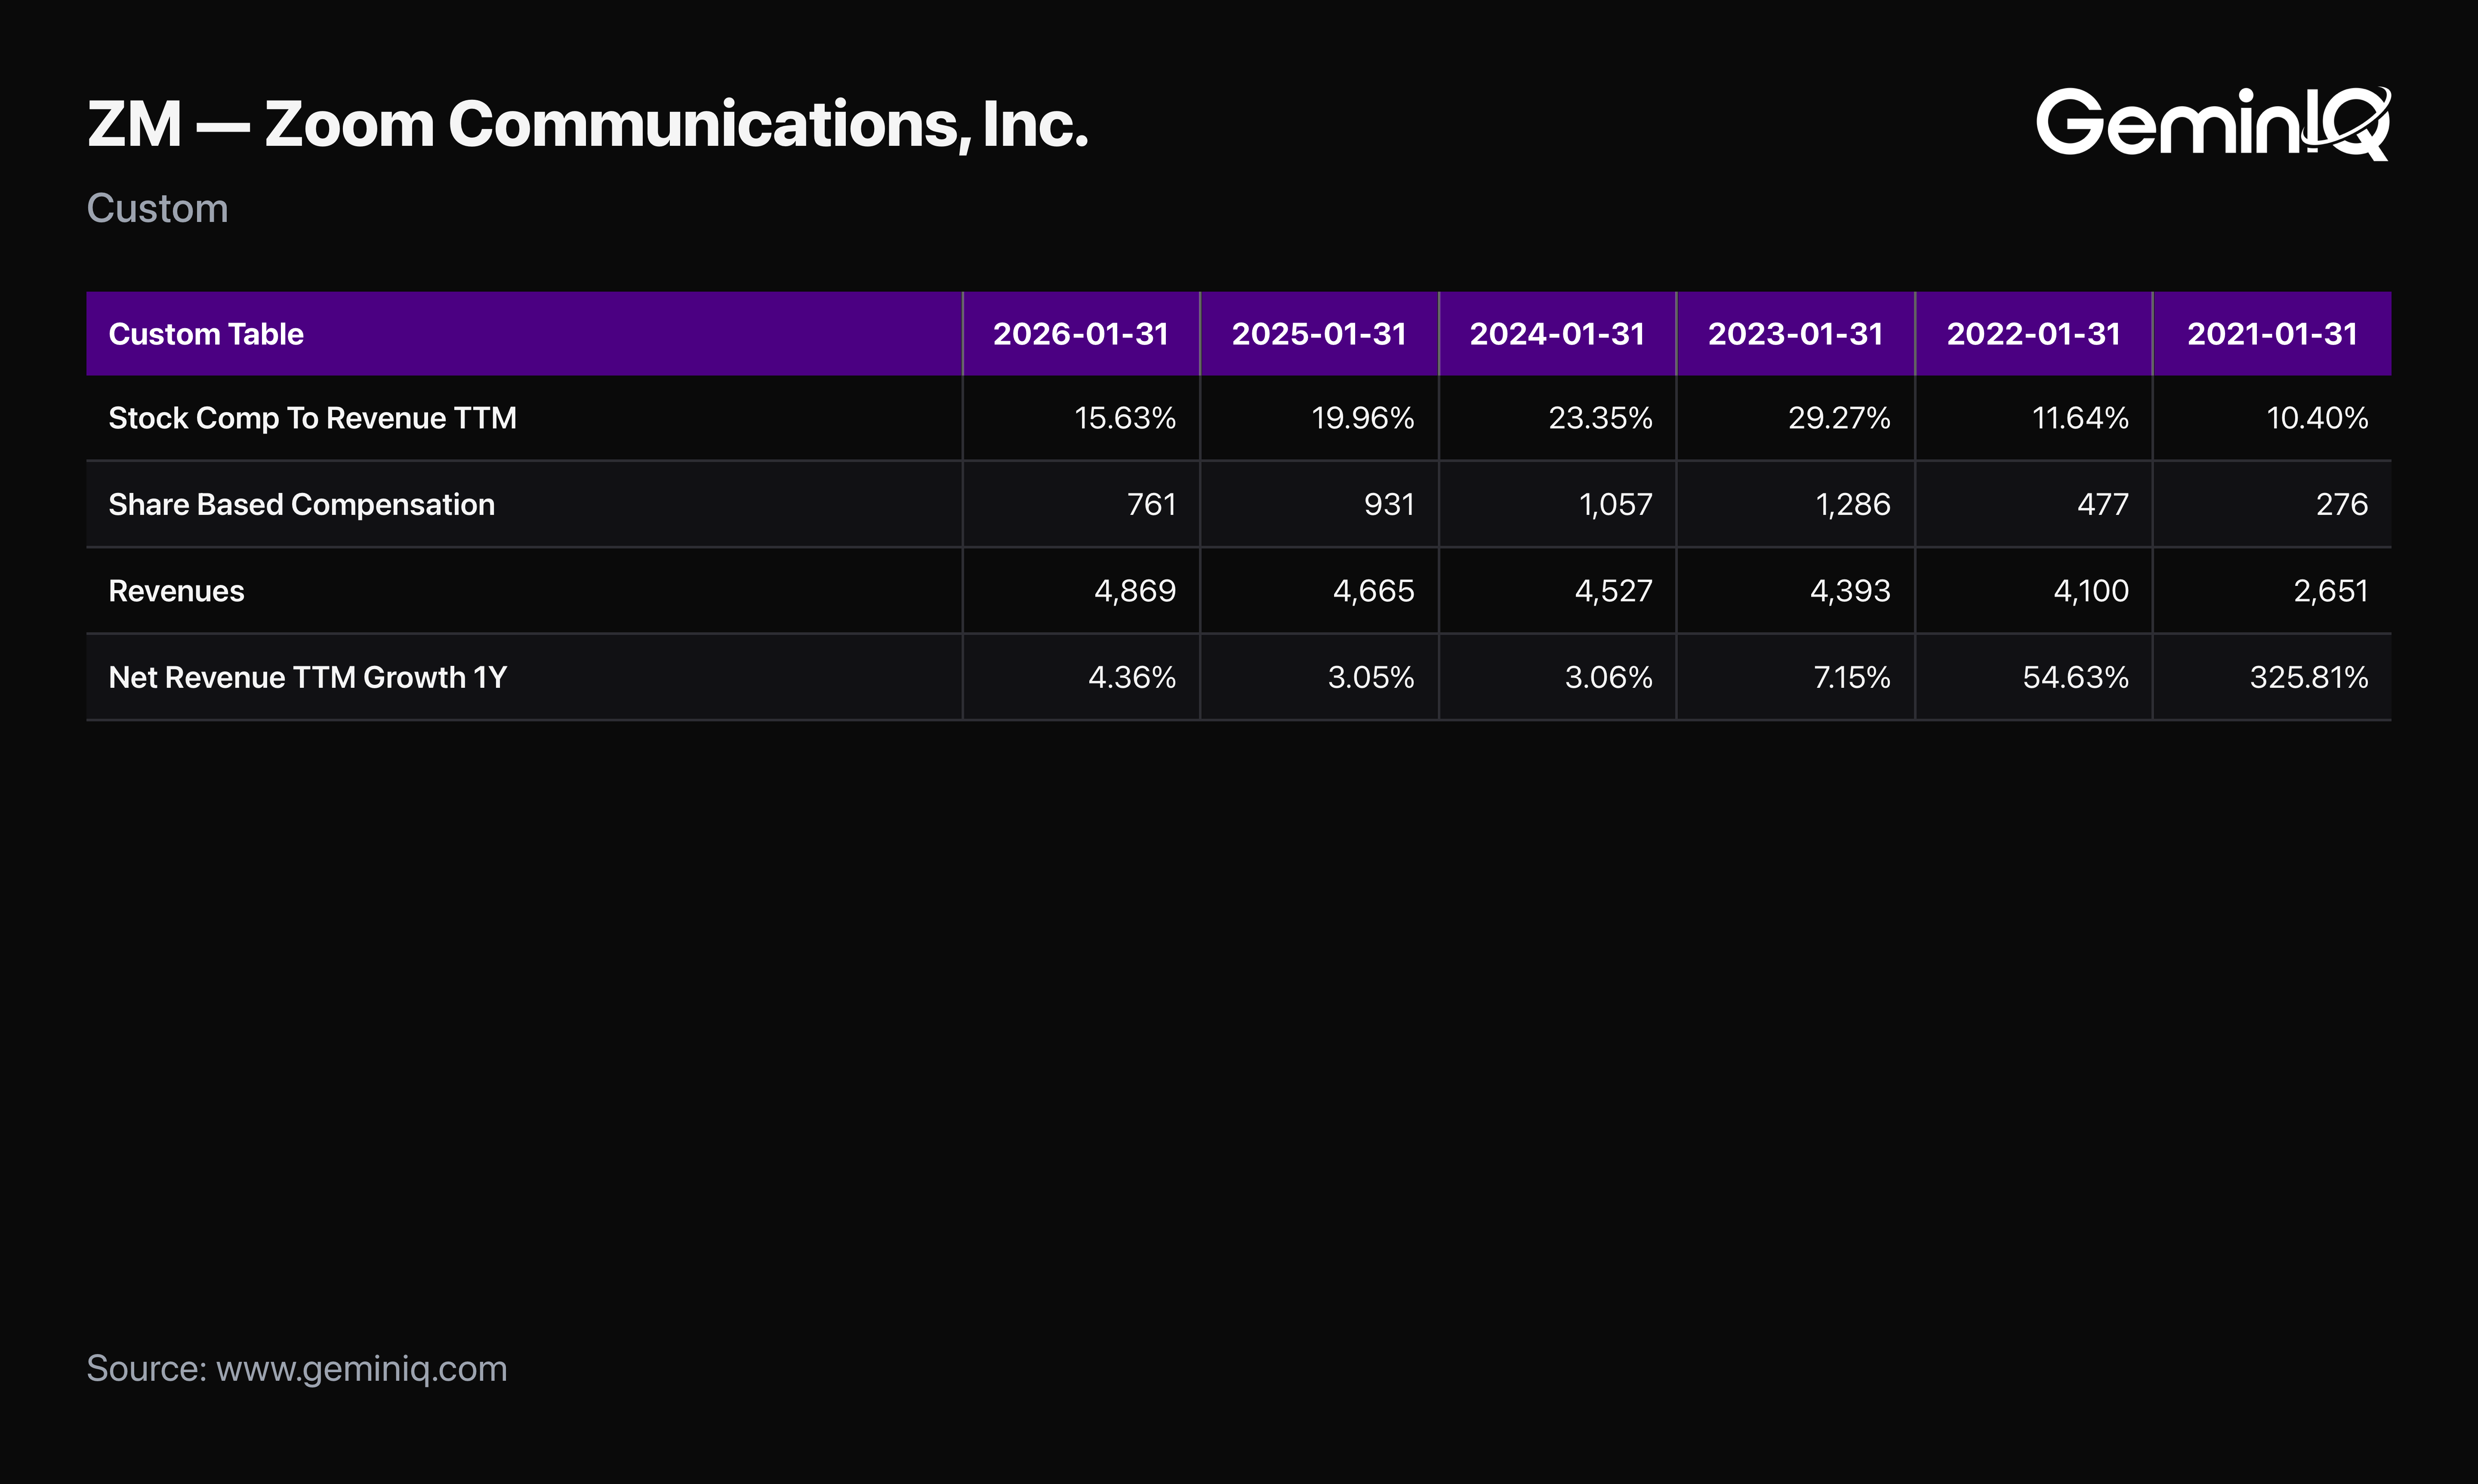
The Filing Data: Across 2020 and 2021, insiders at the three companies filed 446 Form 4 sale records — one of them a 4/A amendment restating an earlier filing — totaling $2.034 Billion in filed sale value, against exactly two purchase records totaling $5.0 Million. Zoom accounted for $1.216 Billion across 199 sale records with no insider purchases in either year. Teladoc accounted for $423.9 Million across 182 records, also with no purchases. DocuSign accounted for $393.6 Million across 65 records against those two purchases.
The Signal: Between 2020 and 2021, at three companies whose growth rates were in the process of peaking, a net $2.029 Billion went out the door. Scheduled 10b5-1 plans explain a share of that volume, which is why GeminIQ's raw Form 4 feed inside Insider Transactions shows the transaction code on every line rather than collapsing everything into a single "insider activity" score. The direction was not ambiguous, and it pointed the same way at all three names simultaneously.
Three Filings in Nine Weeks of 2021 Dated Every Decline
The warnings stacked to three deep in a single quarter, and the quarter is the same one at every company.
For Zoom, that quarter ended April 30, 2021, in the 10-Q filed June 2, 2021: recognized revenue growth had fallen from 368.8% to 191.4%, deferred revenue growth had already turned the filing before, and insiders had sold $698.9 Million across the prior calendar year without a single purchase. The stock closed that quarter at $319.57, still 341% above where it would trade thirty months later. For DocuSign, the quarter ended July 31, 2021, filed September 3: growth down from 57.9% to 49.6%, deferred revenue growth in its third consecutive decline, and stock compensation running at 19.3% of revenue. The stock closed at $298.04 — its record — and reached $38.88 by October 2023. For Teladoc, the quarter ended June 30, 2021, filed August 2: growth down from 150.9% to 108.8%, carrying $14.45 Billion of goodwill against a business generating $1.63 Billion of trailing-twelve-month revenue. The stock closed at $166.29. It traded at $5.45 in March 2026.
Three companies, three different products, three different fiscal calendars, one shared sequence. In each case the growth rate turned in a filing the market read as fine. In each case the balance sheet had turned first. And in each case the twelve months after the last confident annual report were followed by declines of 43% to 68%. The filings were published, timestamped, and freely available to anyone who opened them.
Check Your Holdings
The step-by-step version of this check — what to pull, what to subtract, and what counts as a turn — is written up separately in how to check revenue growth deceleration. The short version: read the year-over-year growth rate down the column and mark the first quarter it comes in below the quarter before, no matter how large the rate itself still is. Zoom's was 191.4% on the quarter it turned.
Then run the same read on the deferred revenue balance, filed as Contract With Customer Liability Current or Deferred Revenue Current depending on the issuer. That is the version that turned a quarter to two quarters earlier at both Zoom and DocuSign. In GeminIQ, both are pre-computed as Revenue Growth and Deferred Revenue Growth, sitting adjacent in the same Calculated Metrics table across a company's full filing history (how that compares with other filing-data platforms). It would have dated all three of these turns while every one of the stocks was still near its high.
Frequently Asked Questions
How many filings does this study cover?
106 as-filed 10-K and 10-Q filings — 29 from Zoom Communications, 44 from Teladoc Health, and 33 from DocuSign — filed between August 2015 and June 2026 and read in submission order.
When did Zoom's revenue growth start slowing?
In the quarter ended April 30, 2021. Year-over-year Revenues growth came in at 191.4%, down from 368.8% in the quarter ended January 31, 2021 — the first time the rate had fallen below the prior quarter since the pandemic began. That 10-Q hit EDGAR on June 2, 2021, with Zoom closing the quarter at $319.57. Sequential growth had turned earlier still: 102.2% quarter over quarter in the period ending July 31, 2020, then 17.1% in the period ending October 31, 2020, an 85.1-point deceleration disclosed in a 10-Q filed December 4, 2020.
How much Livongo goodwill did Teladoc write off?
$13.403 Billion across FY2022 — Goodwill Impairment Loss of $6.600 Billion in the March 2022 quarter, $3.030 Billion in June and $3.773 Billion in December. Teladoc's Goodwill had gone from $742.3 Million at June 30, 2020 to $14.581 Billion at December 31, 2020 following the Livongo acquisition, standing at $14.504 Billion in the FY2021 10-K. It closed 2022 at $1.073 Billion and stood at $283.19 Million by June 30, 2024 — roughly 98% of the end-2021 balance written off within thirty months.
Did DocuSign's decline show up in the filings first?
Its deferred revenue growth did. DocuSign's deferred revenue growth peaked at 61.9% in the October 2020 quarter and fell to 53.6% in January 2021 and 50.2% in April 2021 — two consecutive declines filed before its recognized revenue growth rate ever came in light. Recognized growth turned from 57.9% to 49.6% in the July 2021 quarter, filed September 3, 2021, with the stock at $298.04, its highest quarterly close on record. It reached $38.88 by October 2023. This is a sequence in one company's filings, not evidence that the filings caused the decline.
What was Zoom's peak valuation?
At the October 2020 quarter close — the peak this study measures the 87.0% decline from — Zoom closed at $460.91 with a market capitalization of $131.3 Billion and a Price-to-Sales Ratio of 67.1. That is the same quarter in which Zoom's sequential revenue growth fell from 102.2% to 17.1%, disclosed in a 10-Q filed December 4, 2020.
Does a growth-rate peak predict a stock decline?
No. This study documents a historical association across three named companies over a specific window, not a predictive relationship. Three companies is far too small a sample to establish a base rate, and none of these figures forecast any stock's future. The finding is that the deceleration appeared in the filings before it appeared in the price at all three.
Is GeminIQ's insider data live?
No. Form 4 and 13F data are quarterly filings with a reporting lag, and GeminIQ presents them as such. Insider activity in this study is used as context alongside the fundamentals, not as a standalone trigger.
Wall Street's data. Main Street's price.
Institutional terminals charge thousands a year for as-filed accuracy. GeminIQ gives you the same thing for a fraction of the cost: financials built directly from raw SEC EDGAR filings, not third-party APIs, with full XBRL traceability back to the original 10-K or 10-Q. No normalized guesswork, just calculated metrics, charts, screeners, and watchlists built on numbers exactly as the company reported them. Start researching now at GeminIQ.com.
All financial figures in this article are drawn from Zoom Communications Inc.'s 10-K and 10-Q filings, filed 2019–2026 and publicly available on SEC EDGAR. All financial figures for Teladoc Health, Inc. are drawn from its 10-K and 10-Q filings, filed 2015–2026 and publicly available on SEC EDGAR. All financial figures for DocuSign, Inc. are drawn from its 10-K and 10-Q filings, filed 2018–2026 and publicly available on SEC EDGAR.
Disclaimer: The content in this blog is for educational and entertainment purposes only and does not constitute financial, legal, or tax advice. Investing involves risk, including the loss of principal. The views expressed are my own and not intended as financial advice or a guarantee of future performance.