
Earnings Drops That Recovered: The Biggest Overreactions

By Chad Hartman
Published · Last updated
Carvana lost 24.1% in the month after it filed its FY2022 10-K, carrying $8.309 Billion in debt against a business whose revenue growth had collapsed from 123.9% to 6.2% in a year. Twelve months later, the stock was up 345.6% — the second-largest twelve-month round-trip in GeminIQ's as-filed database, trailing only a pandemic-driven outlier that had nothing to do with its own filing. That distinction matters: of the eleven biggest reversals in this study, Carvana's is the largest one a reader could have actually seen coming from the numbers themselves. The other ten split across a debt refinancing, a pandemic reopening trade, a meme-stock revival, a lending freeze, and a first profitable quarter — eleven different reasons a stock cratered, eleven different reasons it came back. That diversity is the actual finding here, not any single one of the stories.
This study reads every 10-K and 10-Q in GeminIQ's as-filed database from 2009 through mid-2026 — 264,286 filings across 5,637 companies. Each is bucketed by its cumulative return in the month after filing, then tracked forward three months for quarterly filers and twelve months for annual filers. The eleven filings below are the largest round-trips found in the worst-reacting fifth of that entire universe: the deepest first-month drops that also posted the largest subsequent gain.
The Eleven Biggest Round-Trips
| Rank | Company | Filing | Initial Drop | Recovery Window | Return |
|---|---|---|---|---|---|
| 1 | Wayfair | FY2019 10-K | -56.9% | 12 months | +374.5% |
| 2 | Carvana | FY2022 10-K | -24.1% | 12 months | +345.6% |
| 3 | Etsy | FY2019 10-K | -45.3% | 12 months | +268.8% |
| 4 | Roku | FY2019 10-K | -23.7% | 12 months | +239.3% |
| 5 | Five Below | FY2025 10-K | -20.6% | 12 months | +170.6% |
| 6 | SoFi | FY2023 10-K | -20.2% | 12 months | +95.9% |
| 7 | MongoDB | FY2025 10-K | -15.7% | 12 months | +91.3% |
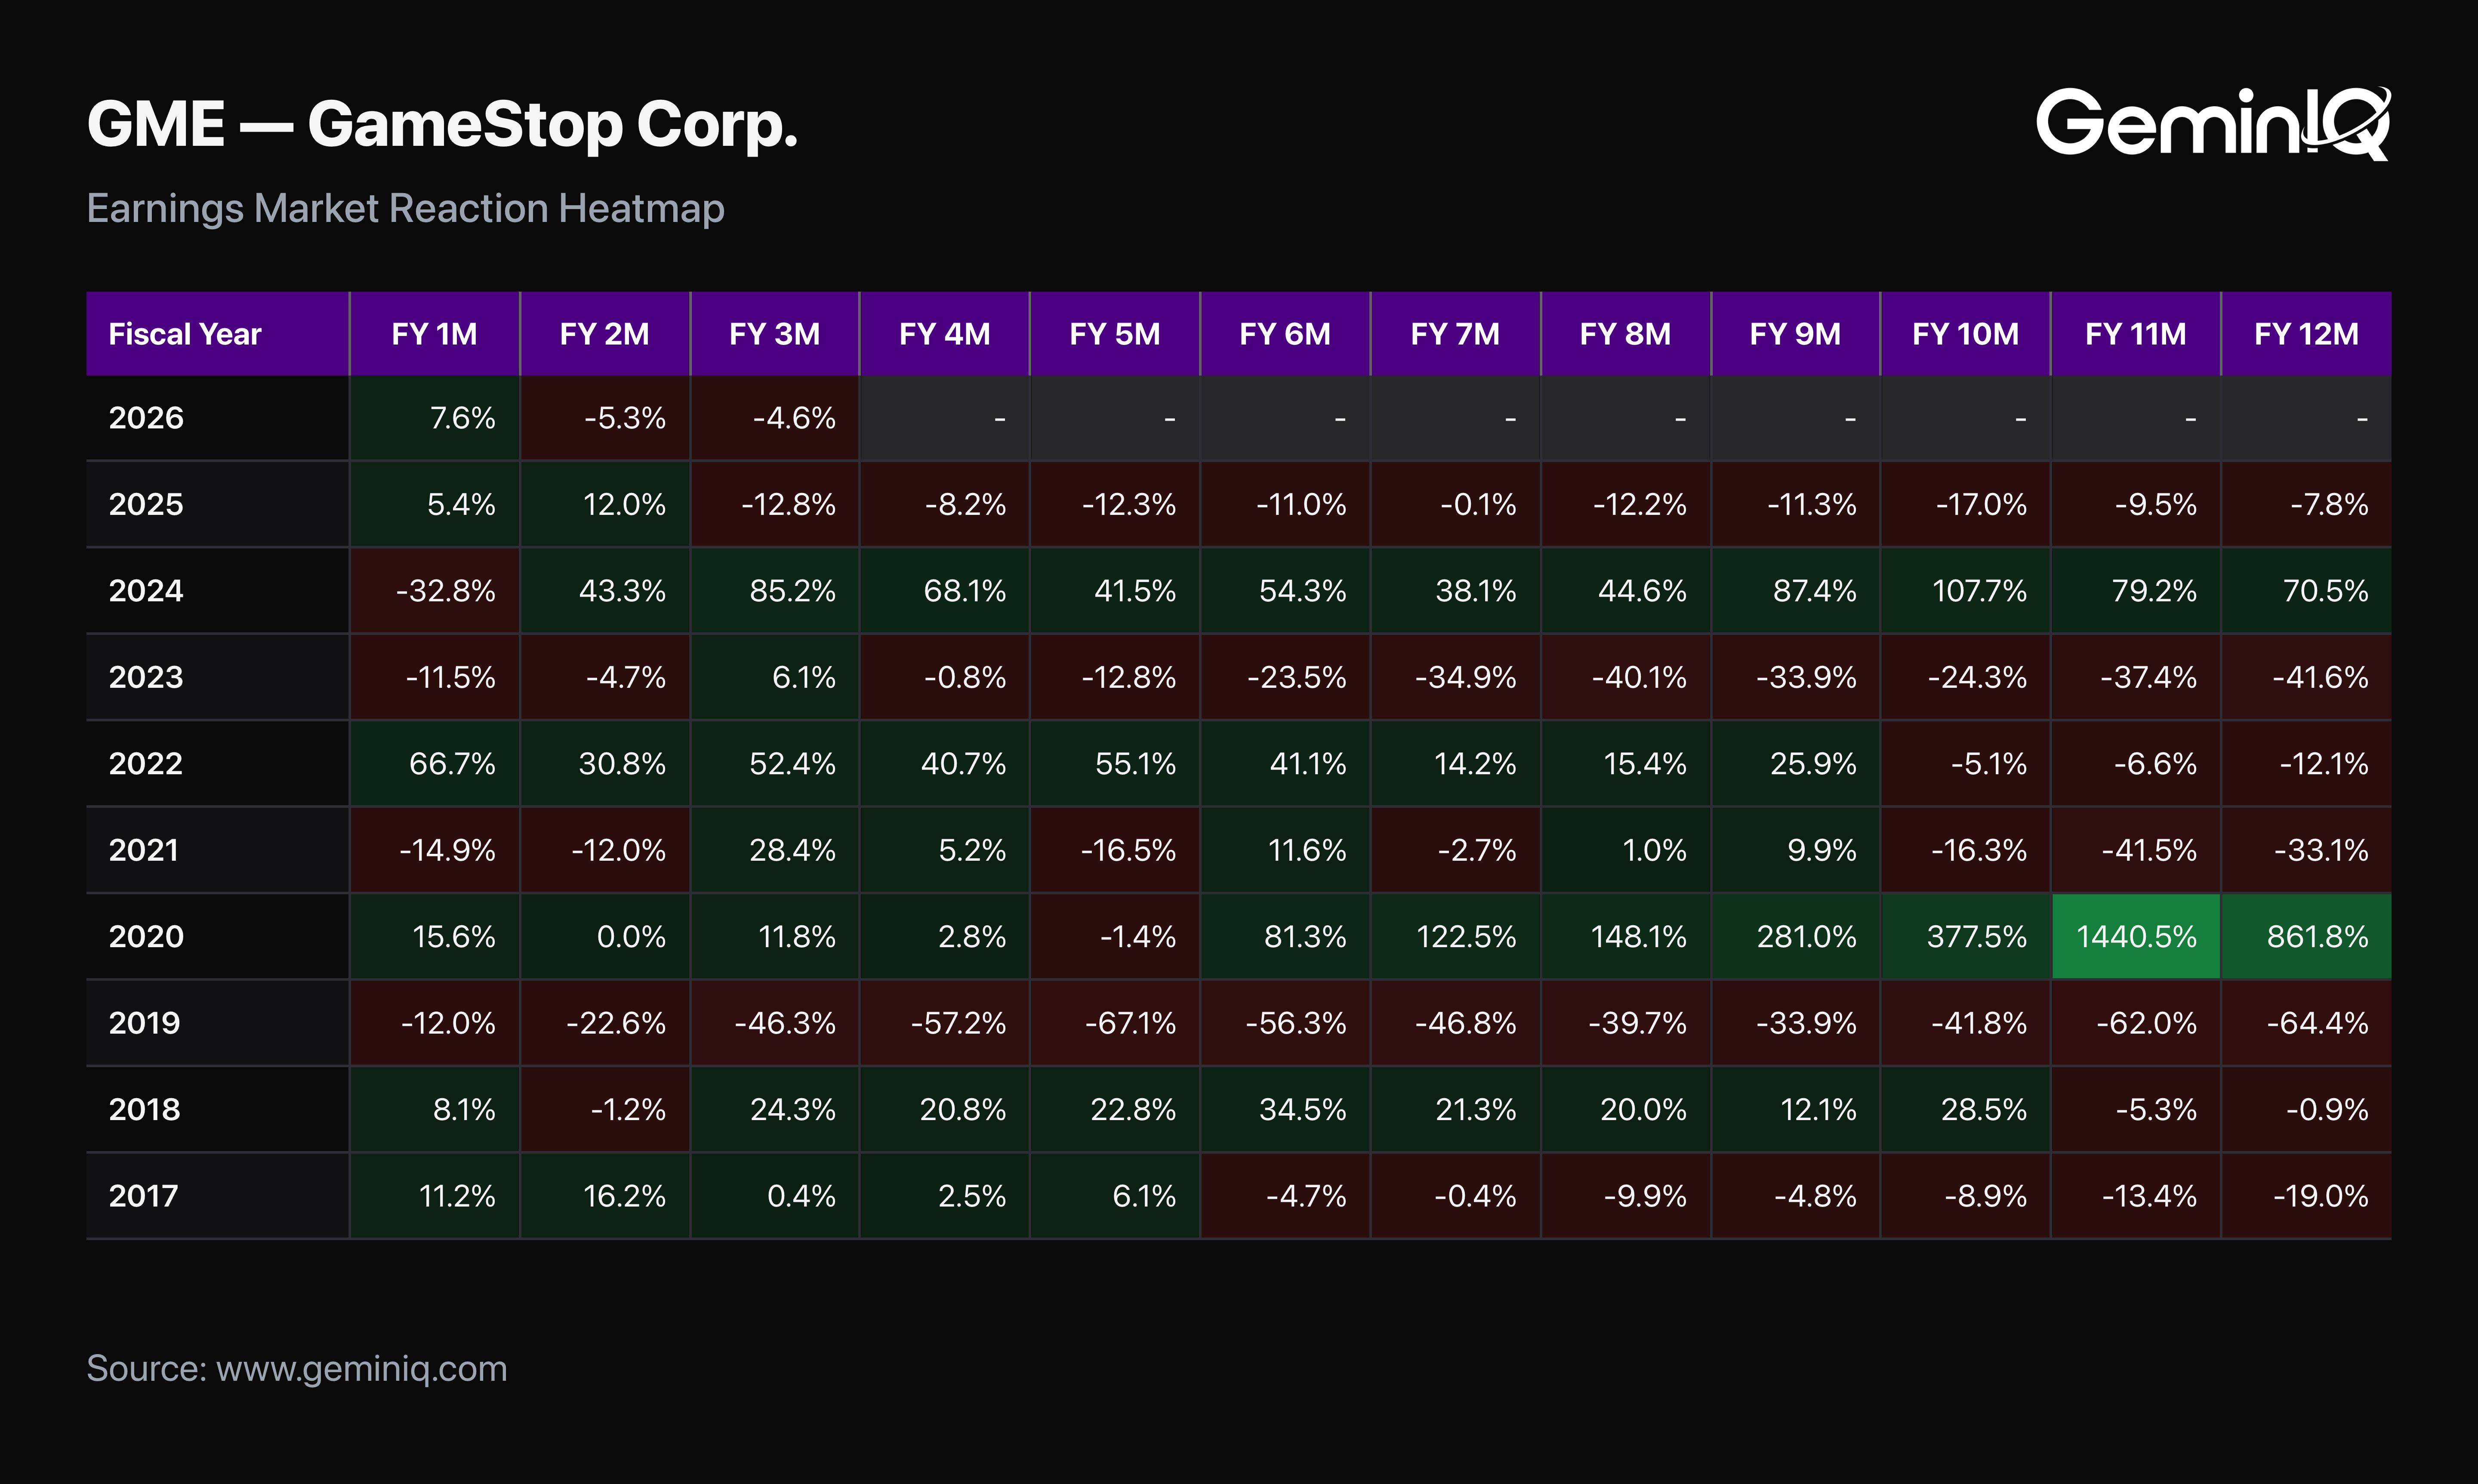
| 8 | GameStop | FY2024 10-K | -32.8% | 12 months | +70.5% |
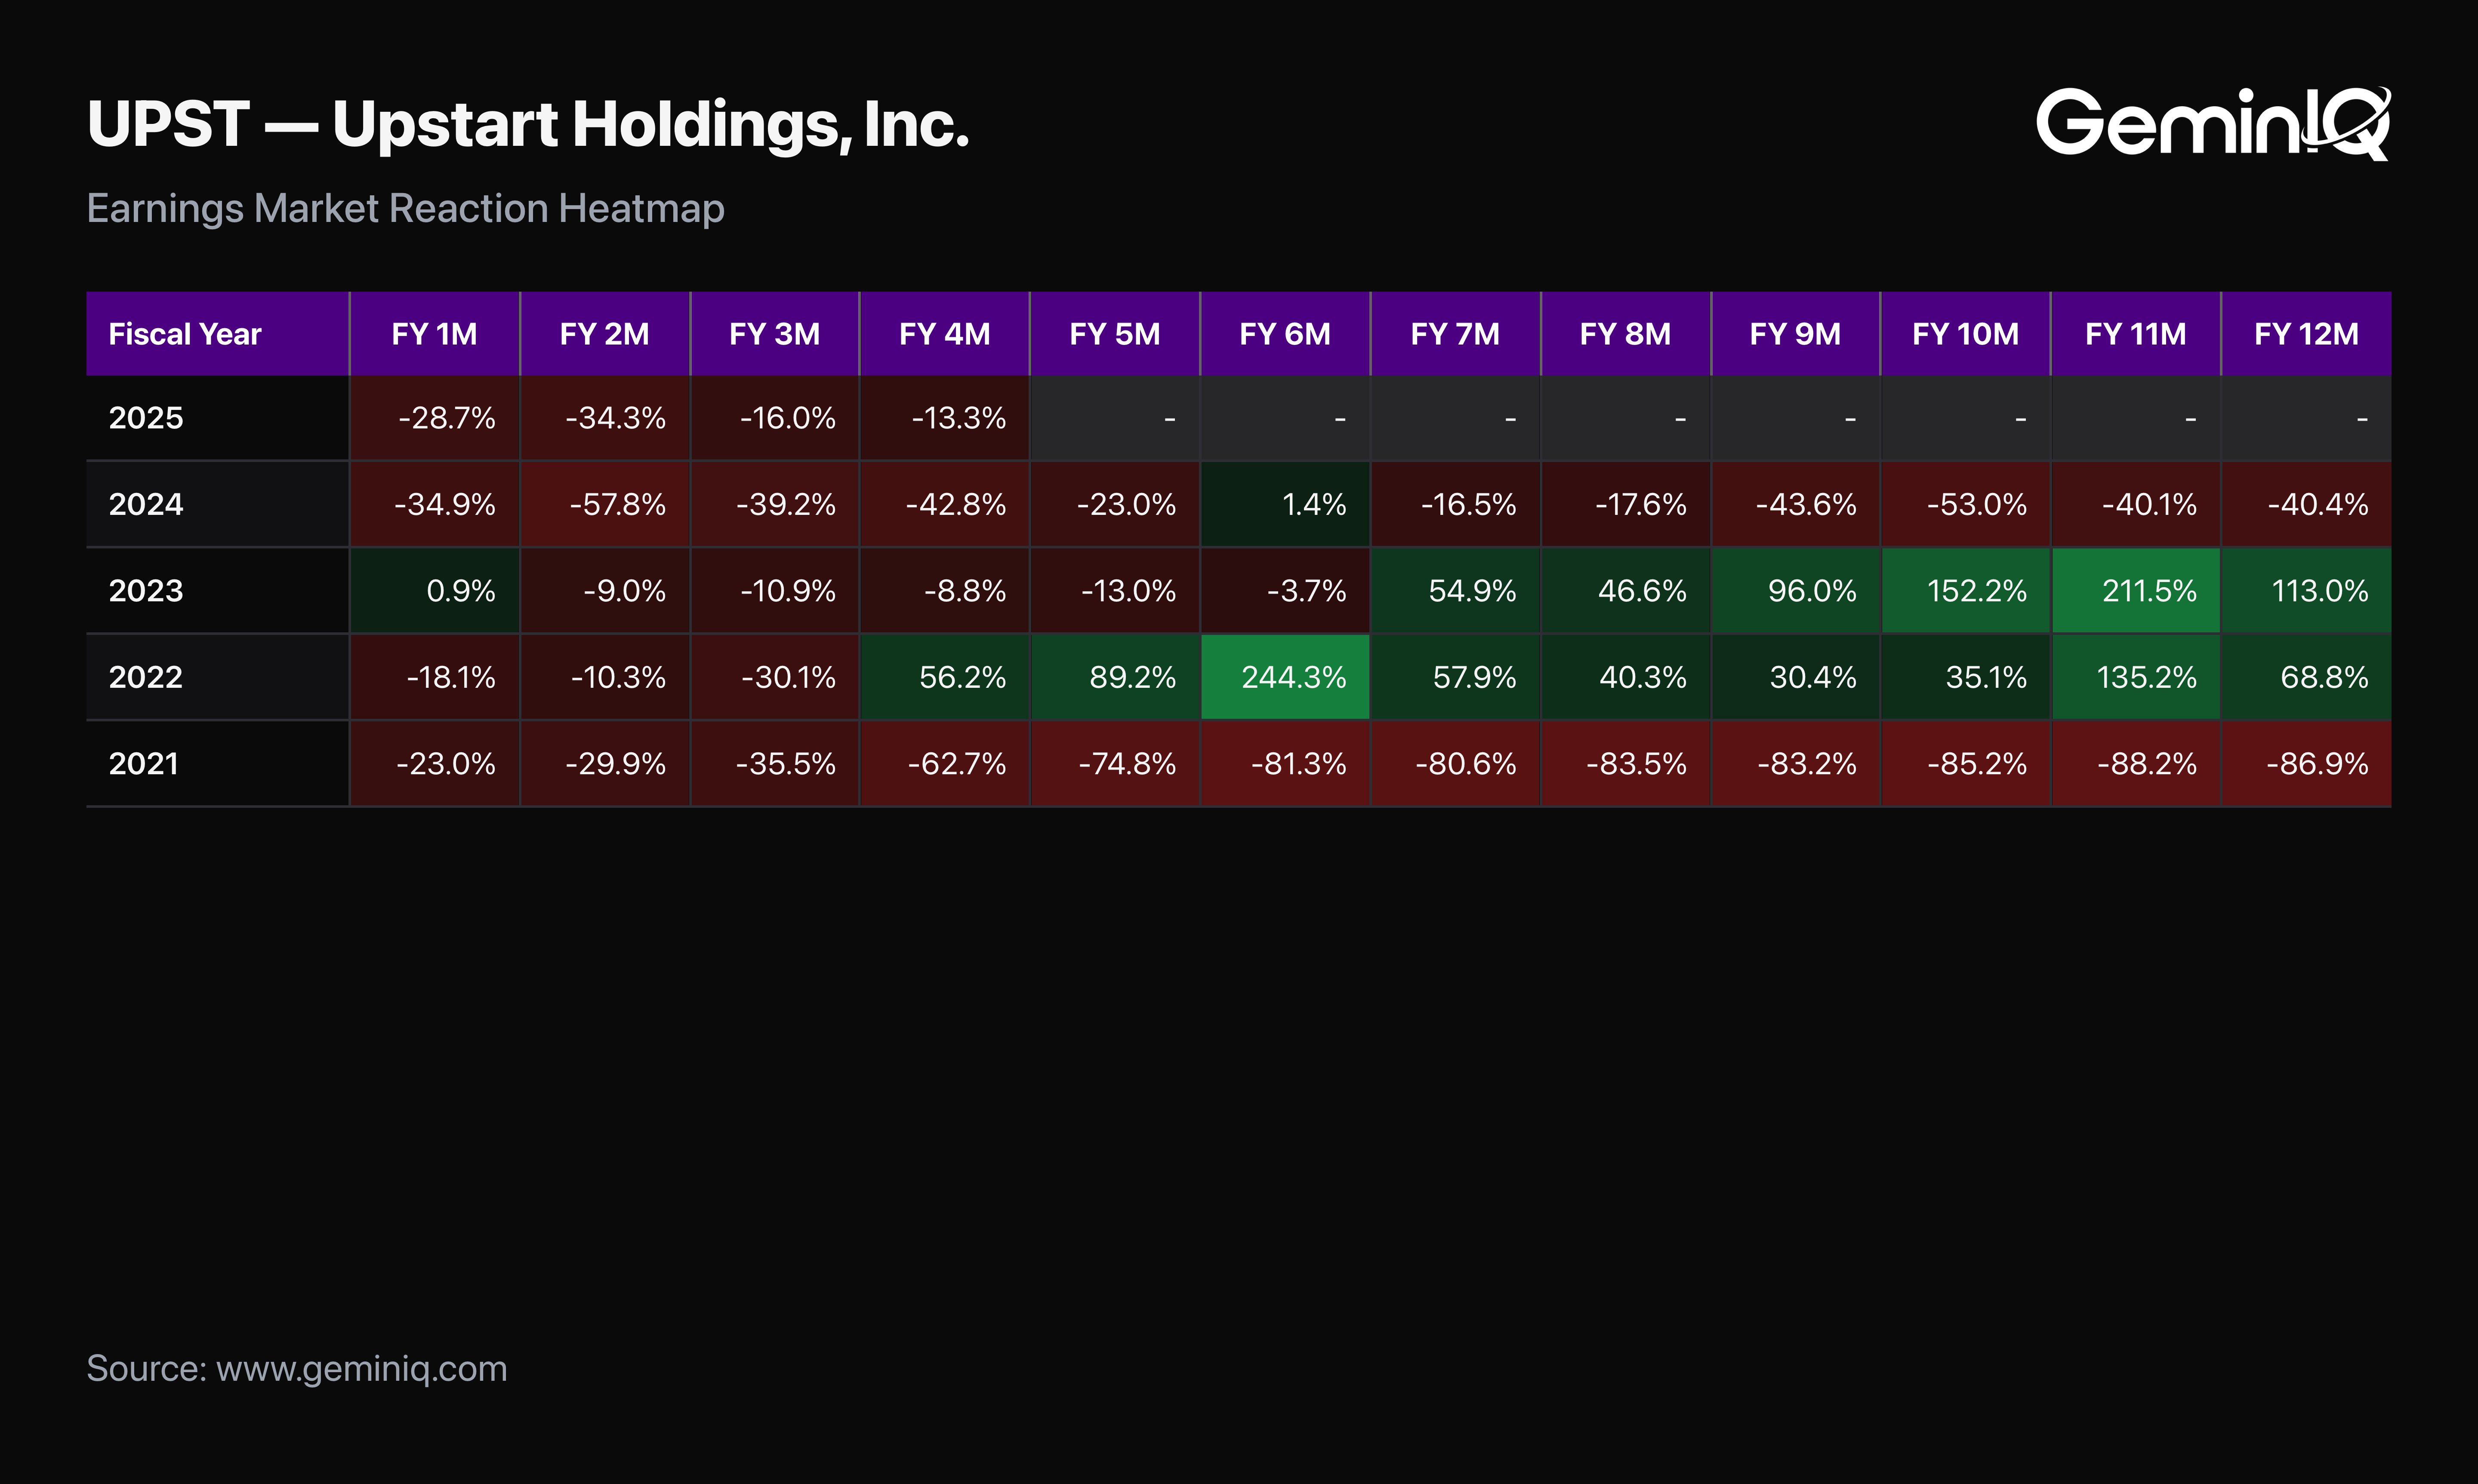
| 9 | Upstart | FY2022 10-K | -18.1% | 12 months | +68.8% |
| 10 | Teladoc | FY2015 10-K | -22.0% | 12 months | +61.2% |
| 11 | Datadog | FY2022 10-K | -10.5% | 12 months | +70.0% |
Three of the eleven — Wayfair, Etsy, and Roku, ranked first, third, and fourth — share a filing date that has nothing to do with any single company. All three filed FY2019 annual reports in the last week of February or the first days of March 2020, days before a pandemic crashed and then reflated the entire market. Standard financial media would tell each of those stories separately, as if three companies independently overreacted to their own numbers. The filing dates say otherwise. The other eight names on the list — including four of the five covered in detail below — are not tied to that week; whatever drove each of them, it wasn't a shared calendar.
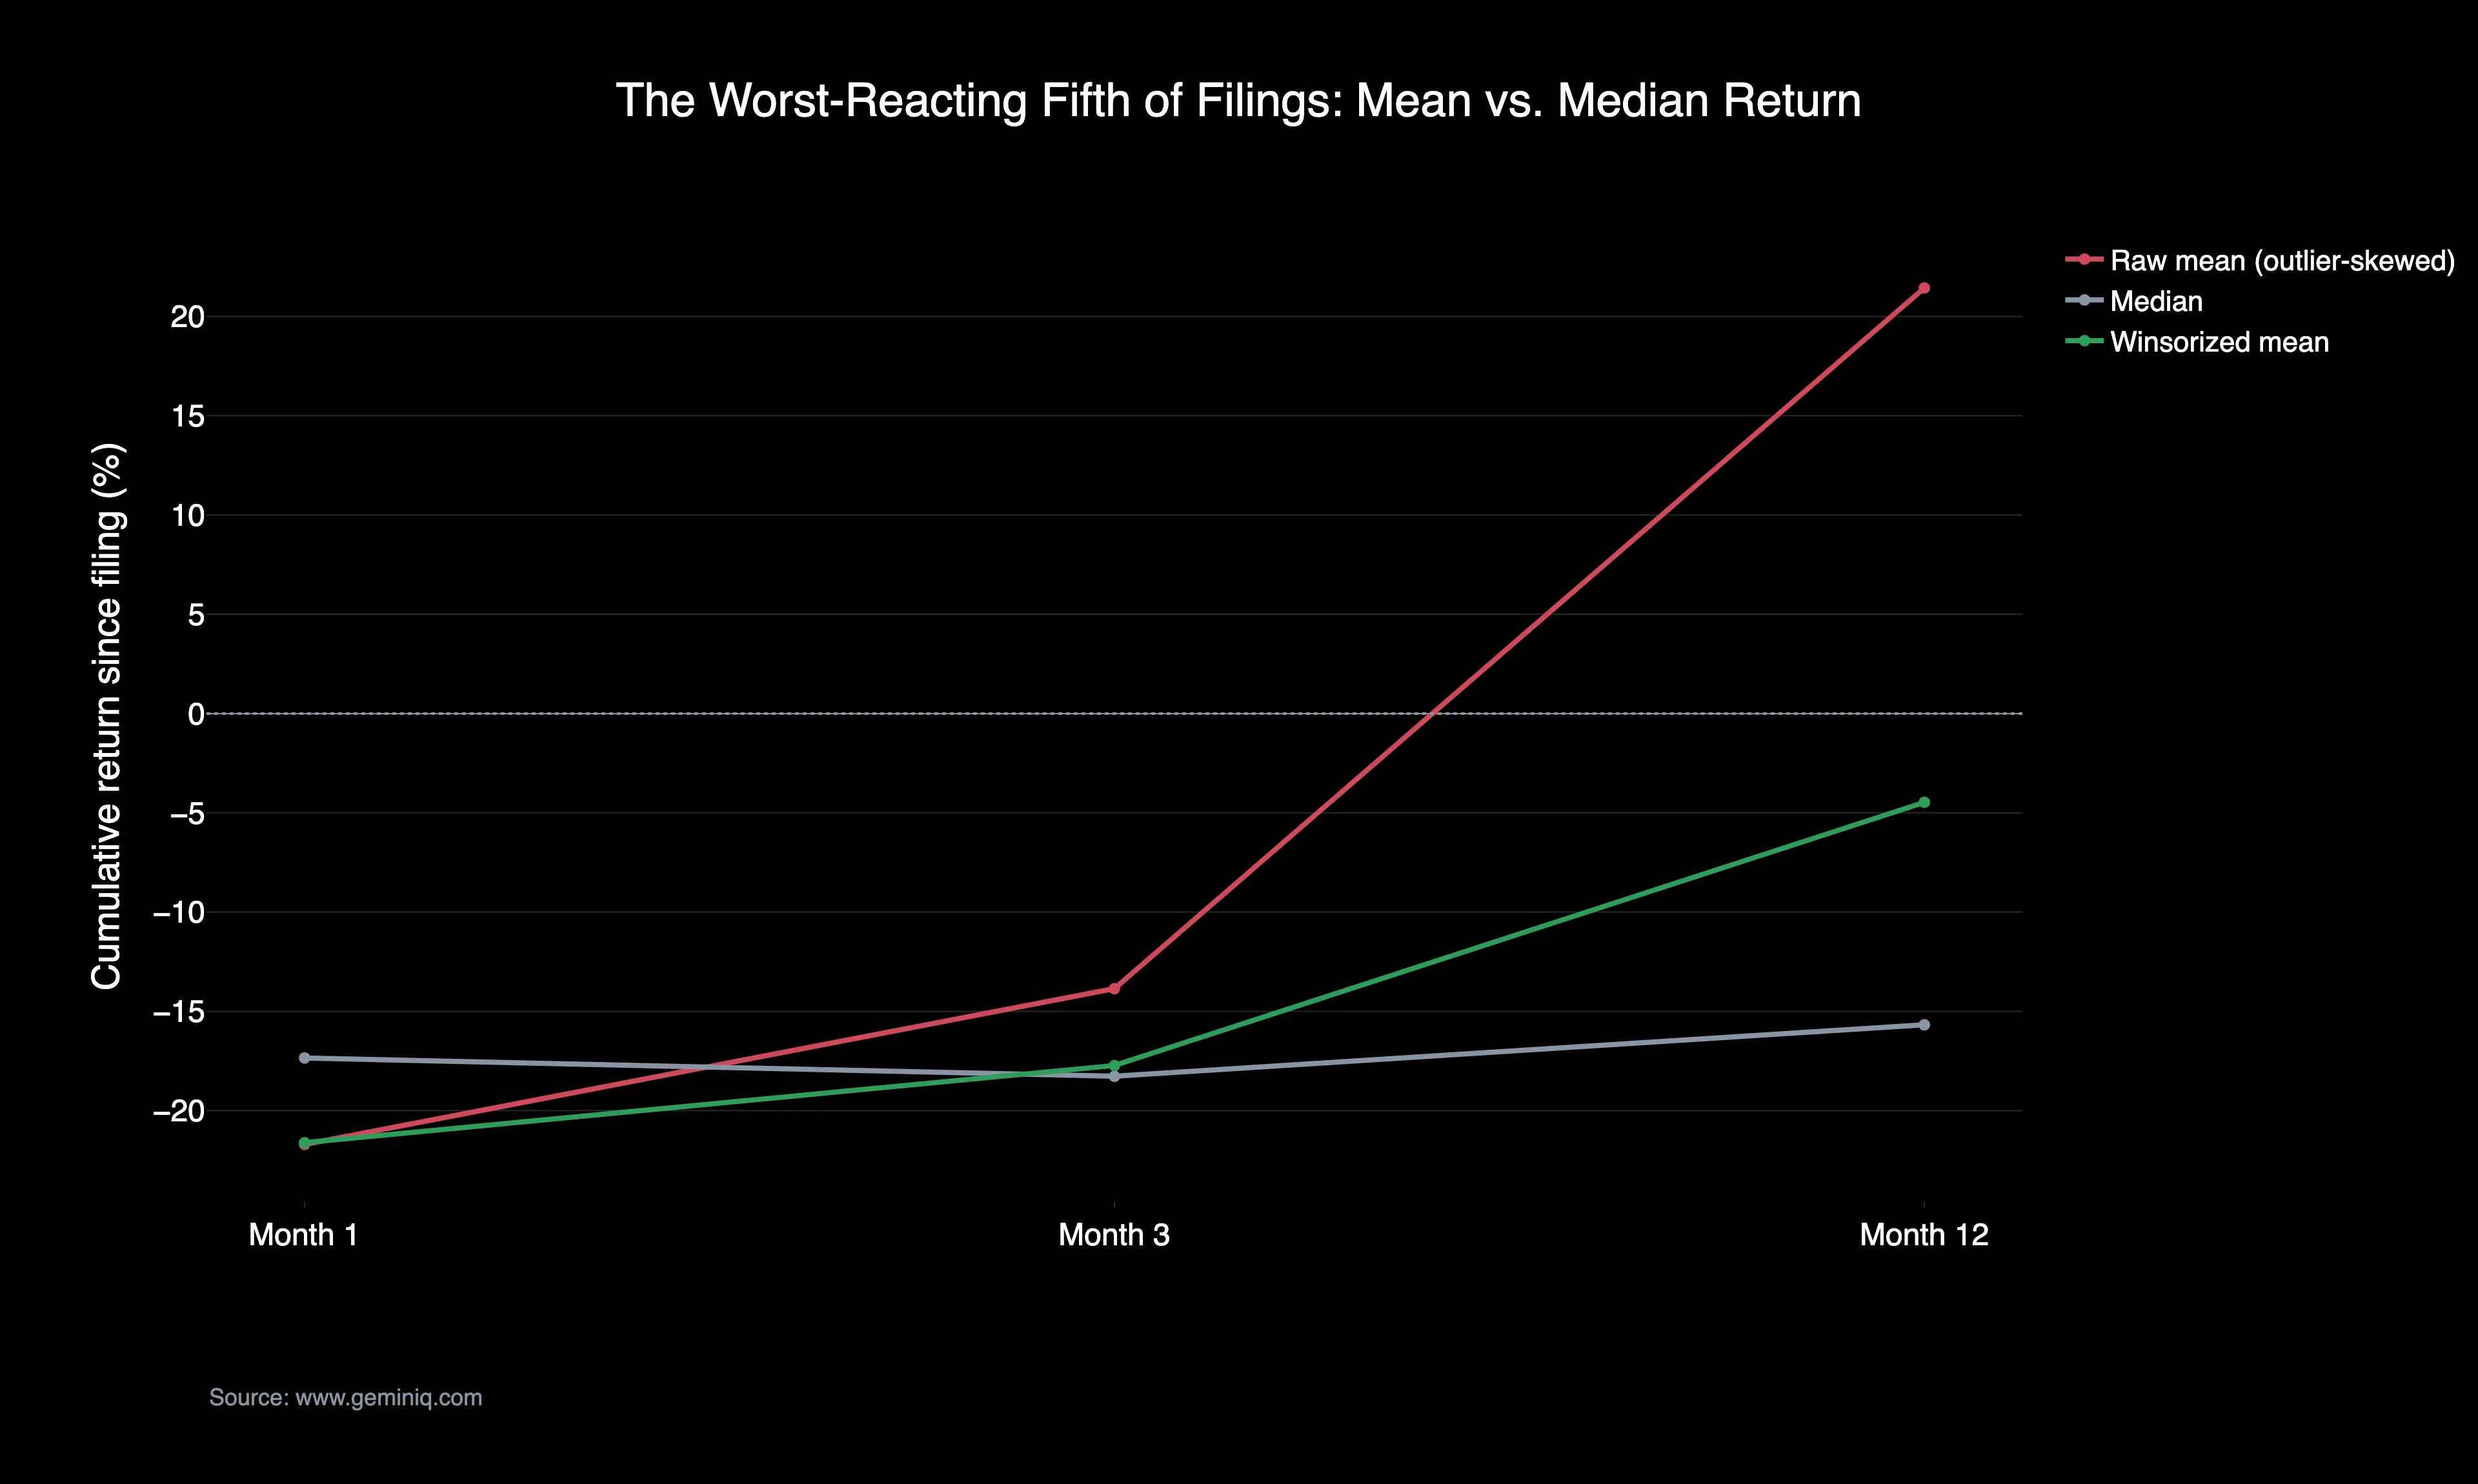
Context that belongs next to any of this: the worst-reacting fifth of all 10-K filings in this database — the exact bucket every name above was drawn from — was followed by a median twelve-month return of -15.68%, against a winsorized universe median of +3.00% and a winsorized universe mean of +11.31%. This is a historical association across the sample, not a forecast for any individual filing. The eleven names above are the extreme right tail of a distribution whose typical member did not recover at all — a finding covered in full in Stock Dropped After Earnings: What History Says Happens Next.
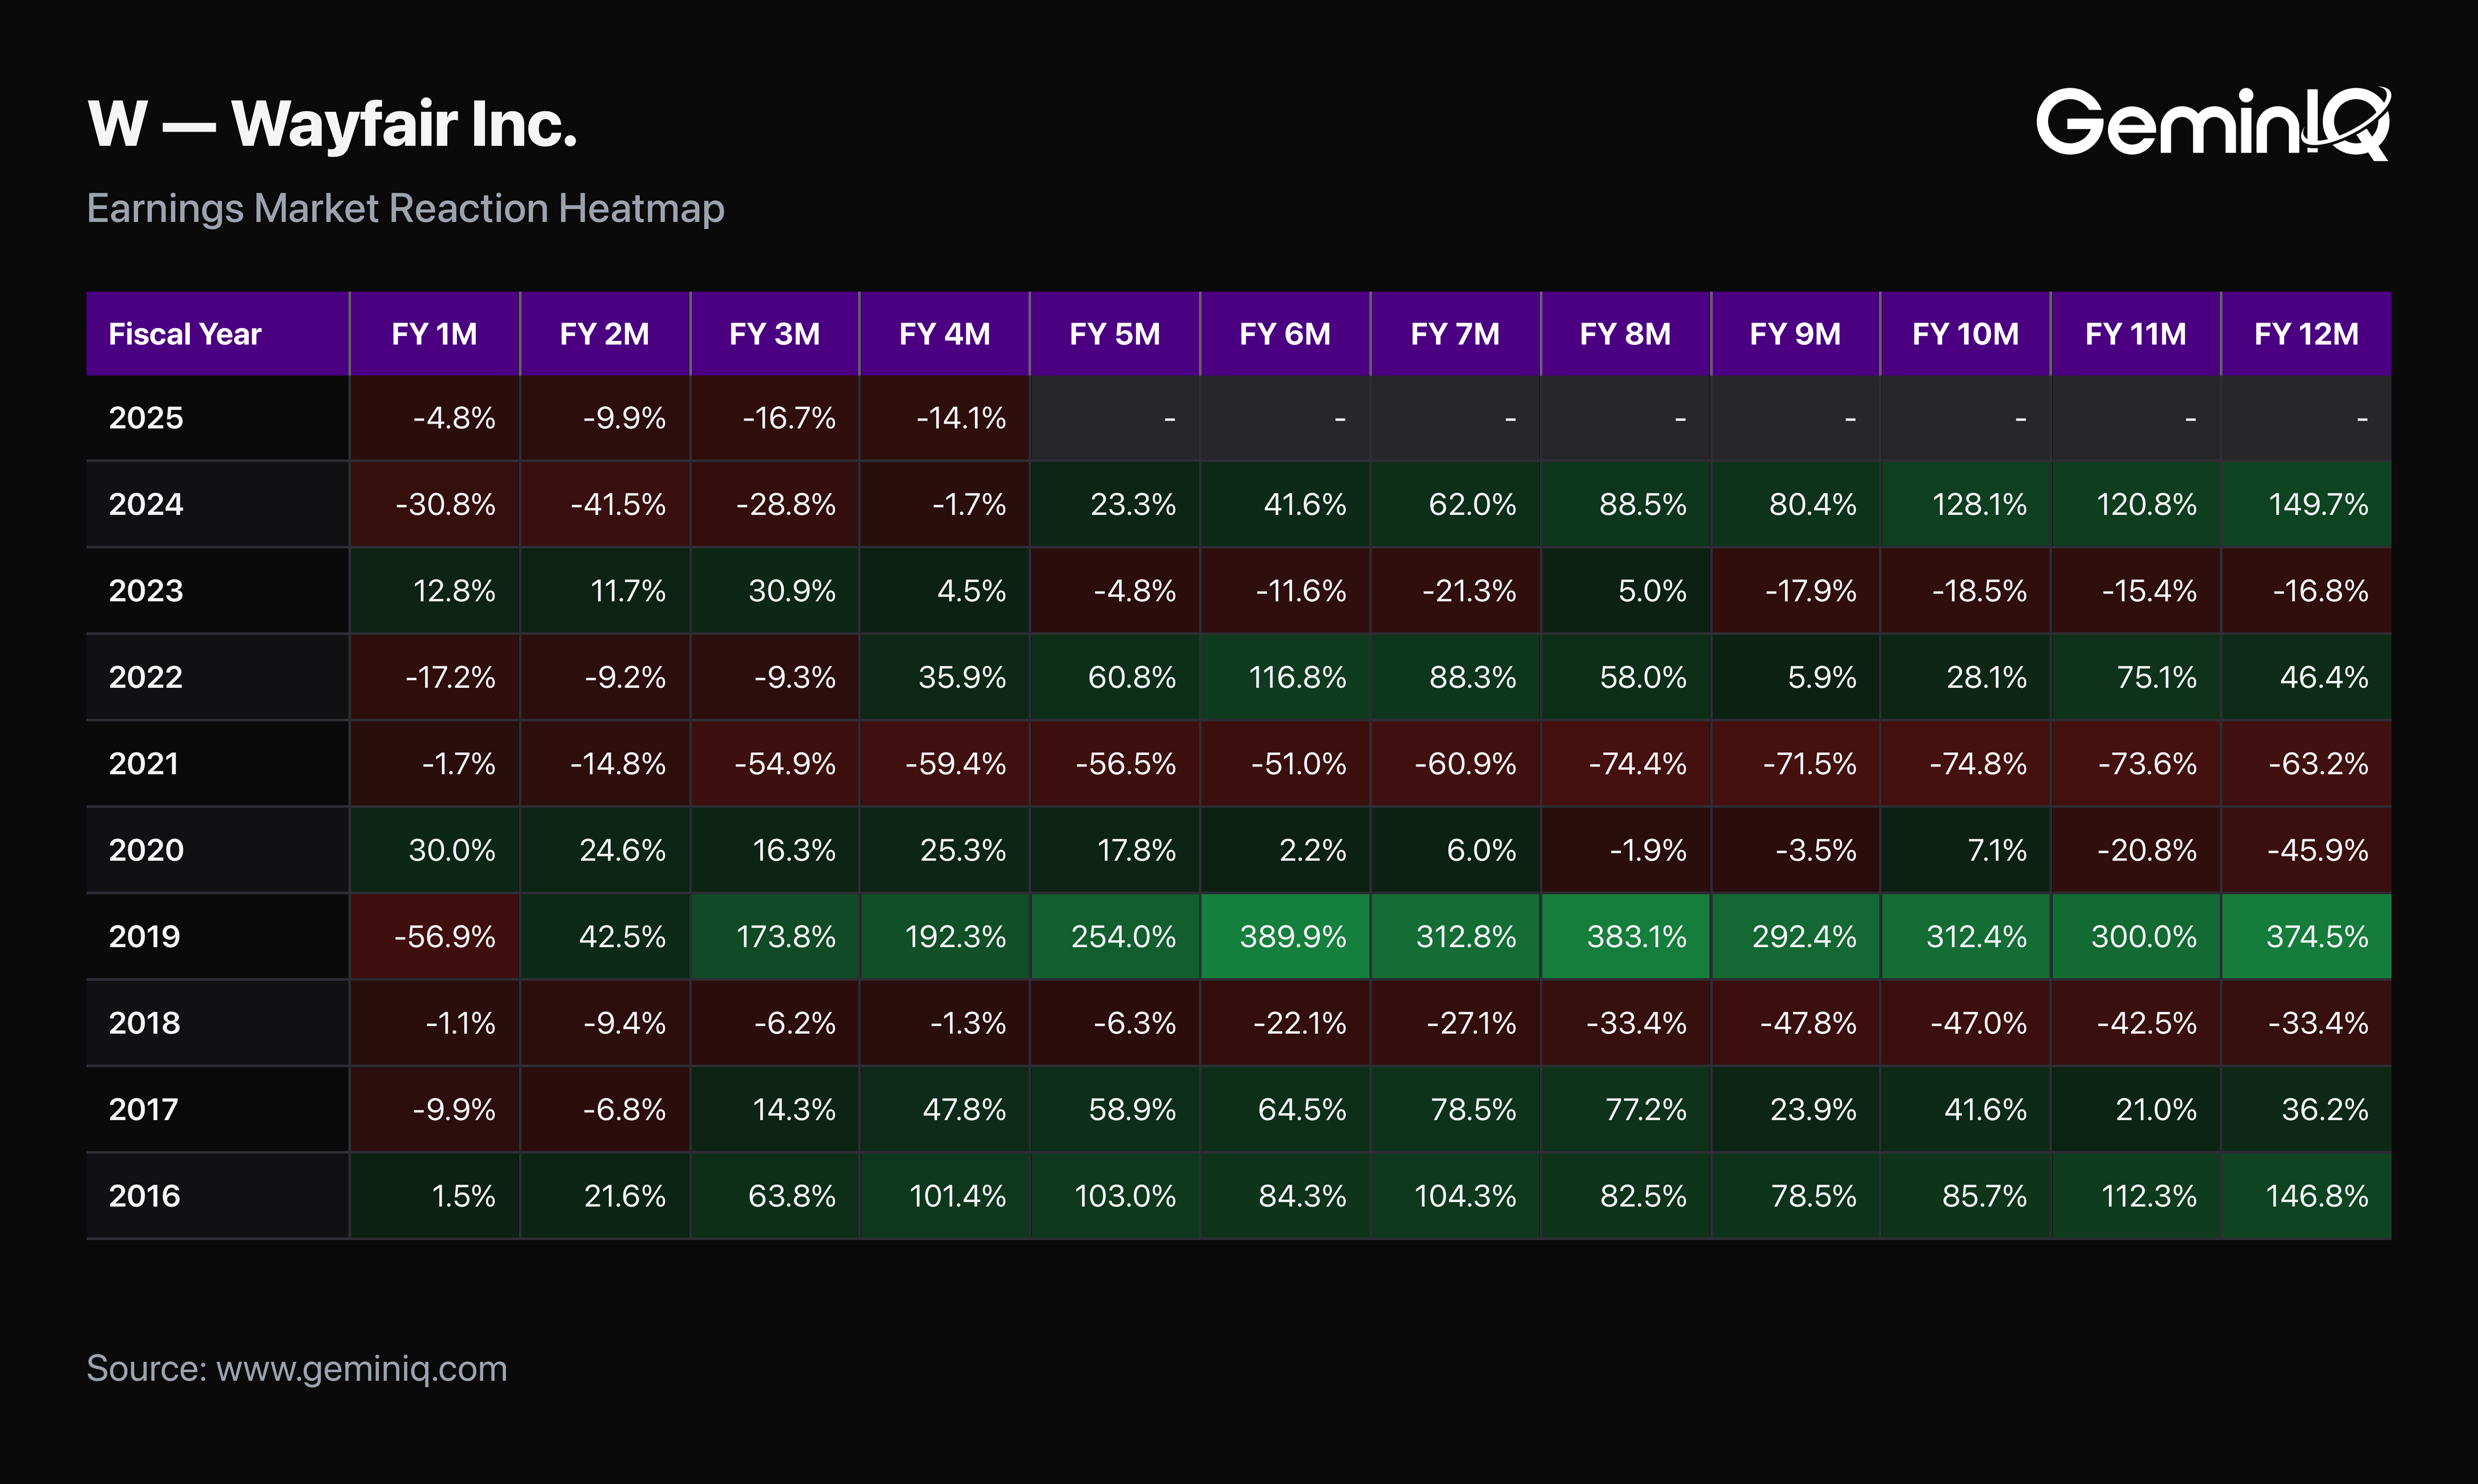
Wayfair: A Pandemic Rewrote the Filing
Wayfair's FY2019 10-K, filed February 28, 2020, reported $9.127 Billion in trailing revenue, up 34.6% year over year — a growth rate media coverage at the time treated as unremarkable for an e-commerce name still years from profitability. The net loss told a worse story: -$984.6 Million trailing twelve-month, worse than the prior year's -$504.1 Million, with diluted losses of $10.68 per share. Total debt had roughly doubled in a single year, from $738.9 Million to $1.456 Billion, pushing the company into a net-debt position of $873.4 Million for the first time in the dataset. On the numbers alone, this was a filing that should have kept falling.
It fell 56.9% in the first month — the steepest single-month drop of any filing in this study. Then COVID-19 turned e-commerce delivered-to-your-door furniture into one of the most in-demand categories in retail, and Wayfair's stock rose 374.5% over the next twelve months. Nothing in the 10-K itself explains that outcome. The filing described a company burning cash faster every year; the market's verdict came from an external event the filing could not have anticipated.
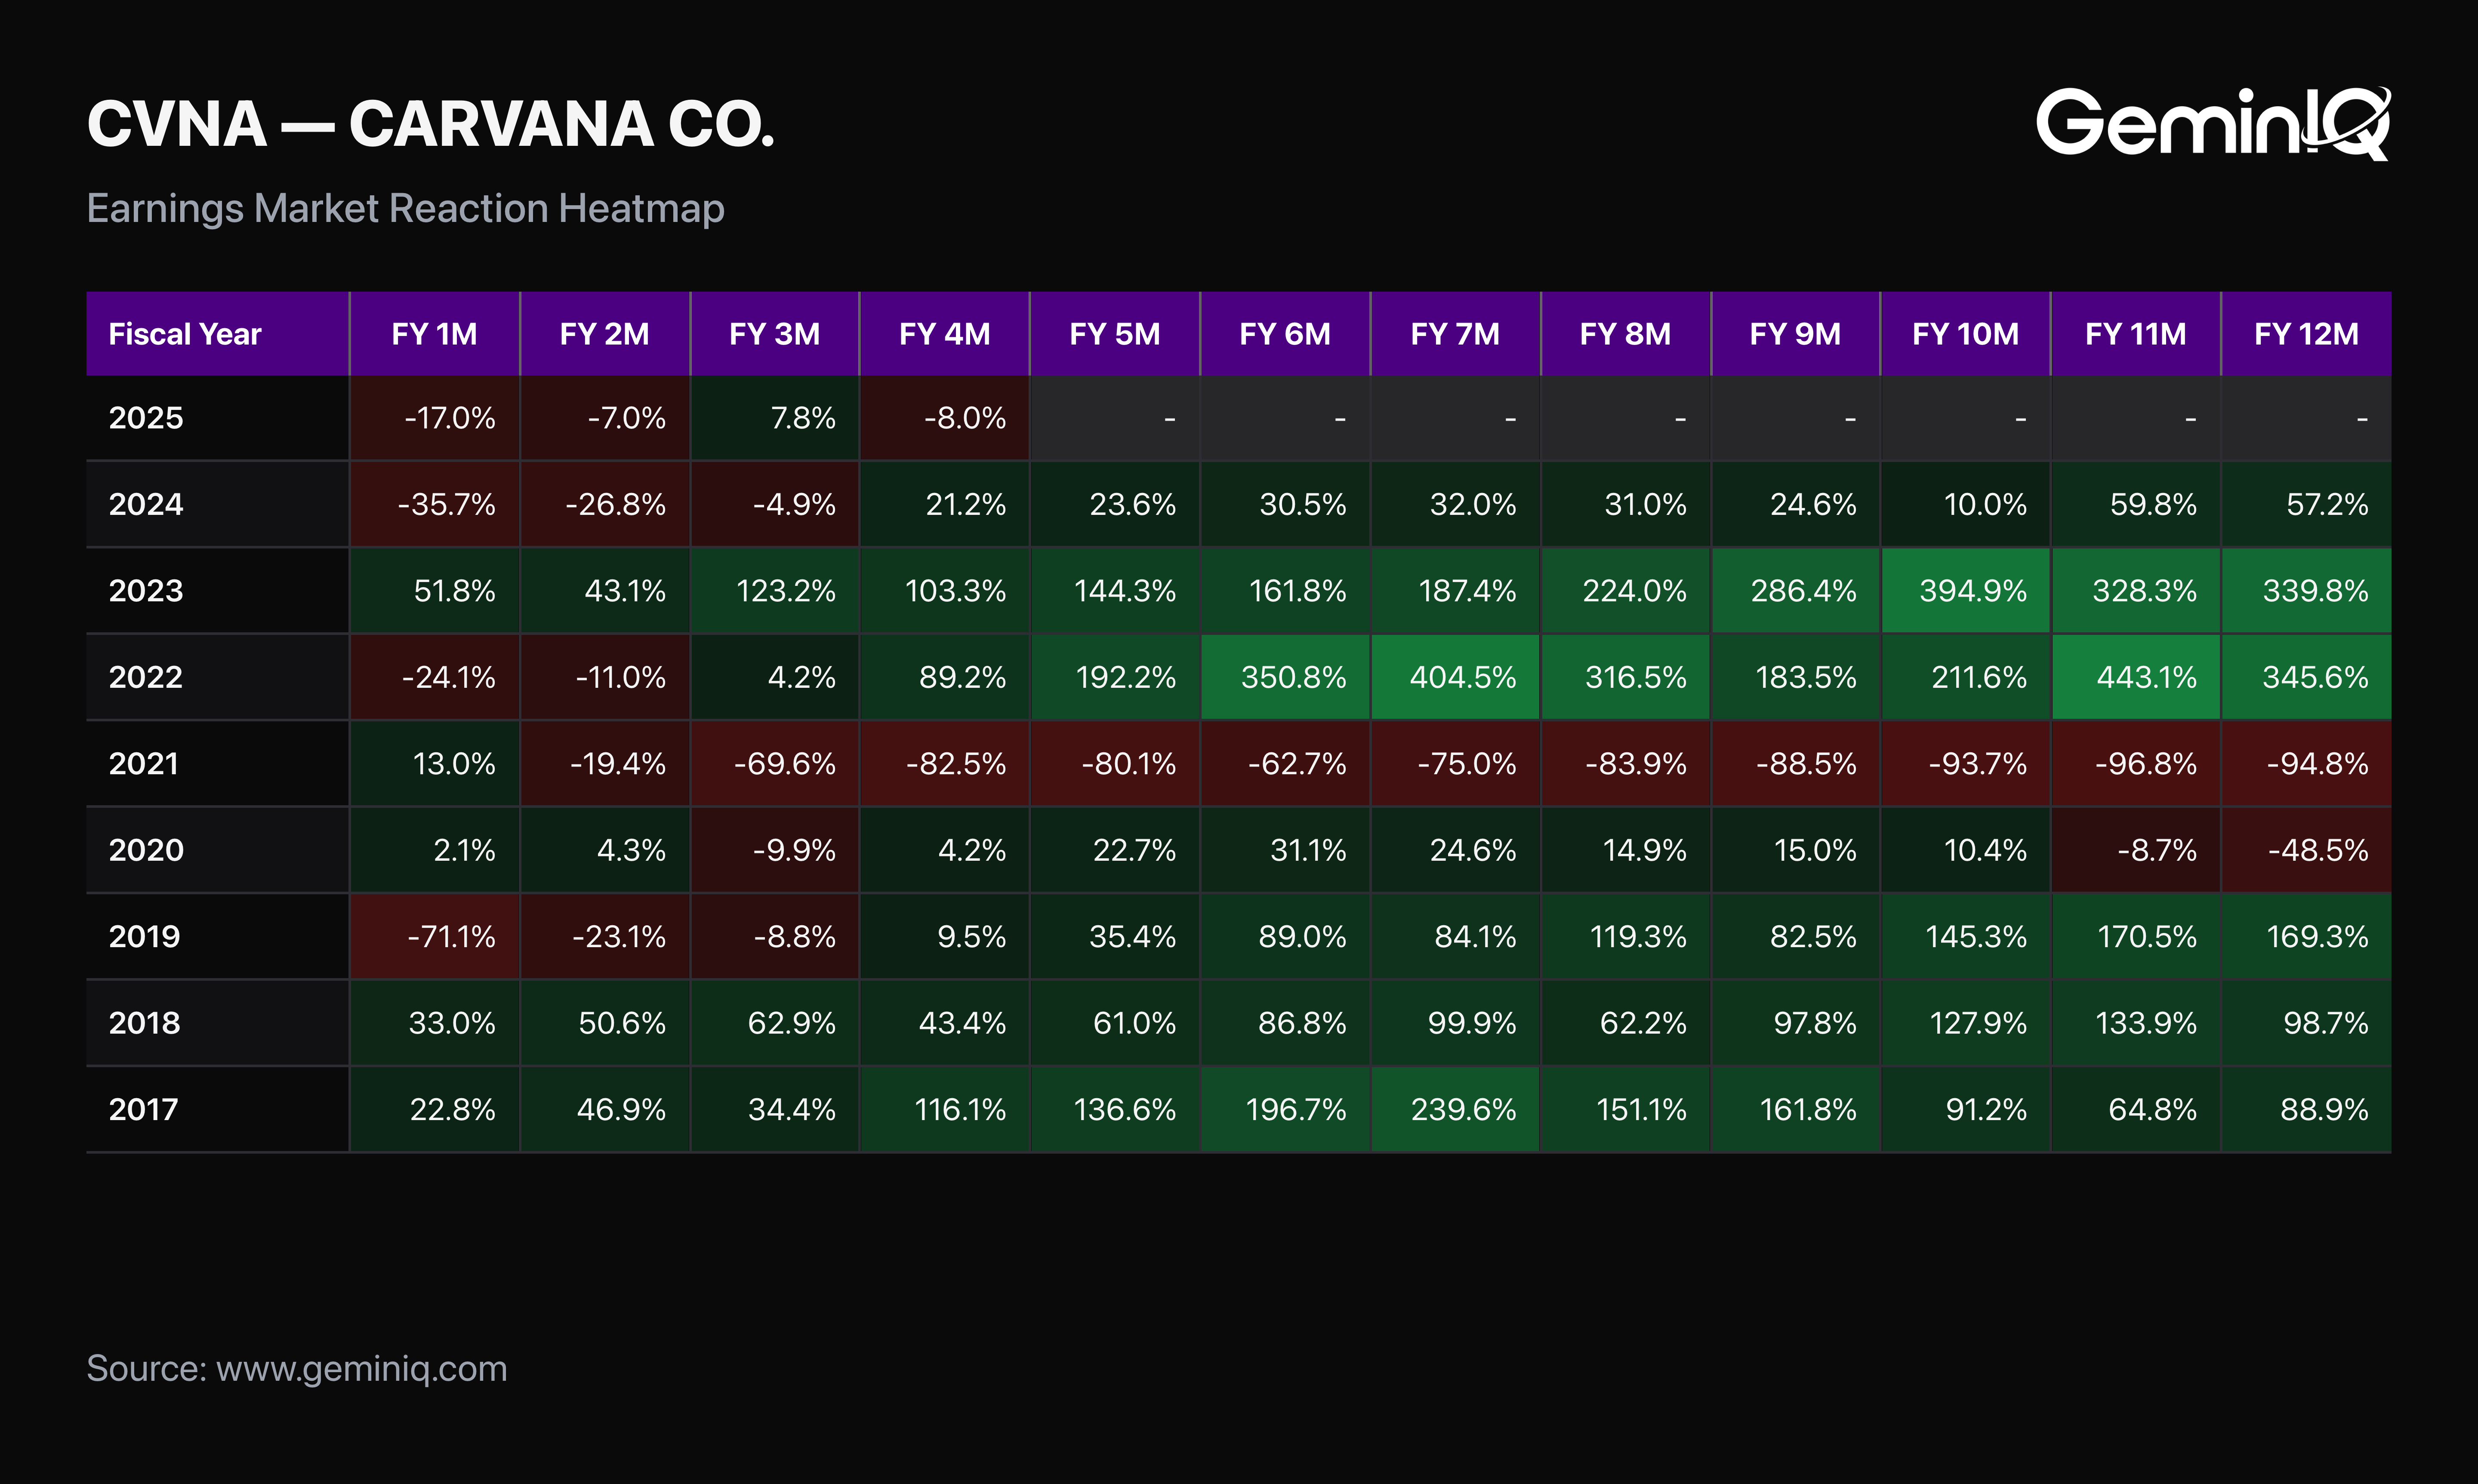
Carvana: $8.3 Billion in Debt and a 346% Comeback
Carvana's FY2022 10-K, filed February 23, 2023, is the cleanest debt-crisis story in the dataset. Revenue growth had decelerated from 123.9% year over year in Q3 2021 to just 6.2% by the panic quarter, and gross margin compressed from 15.1% to 9.2% over the same stretch — a business that had scaled aggressively on the assumption growth would keep funding itself. GeminIQ's pre-calculated Total Debt shows the balance sheet growing from $5.413 Billion to $8.309 Billion over the year leading into the filing, largely the financing behind the ADESA acquisition. Net Debt stood at $7.681 Billion against just $628 Million in cash, and the company posted a trailing net loss of -$1.587 Billion.
That combination — decelerating growth, compressing margins, and a debt load that had grown sharply at the worst possible moment — is exactly the setup a distressed-debt short thesis is built on, and the stock dropped 24.1% in the following month. What followed was one of the more written-about corporate turnarounds of the period: a debt exchange that cut leverage, a return to unit-economics discipline, and a stock that gained 345.6% over the next twelve months, the second-largest twelve-month reversal in this entire study.
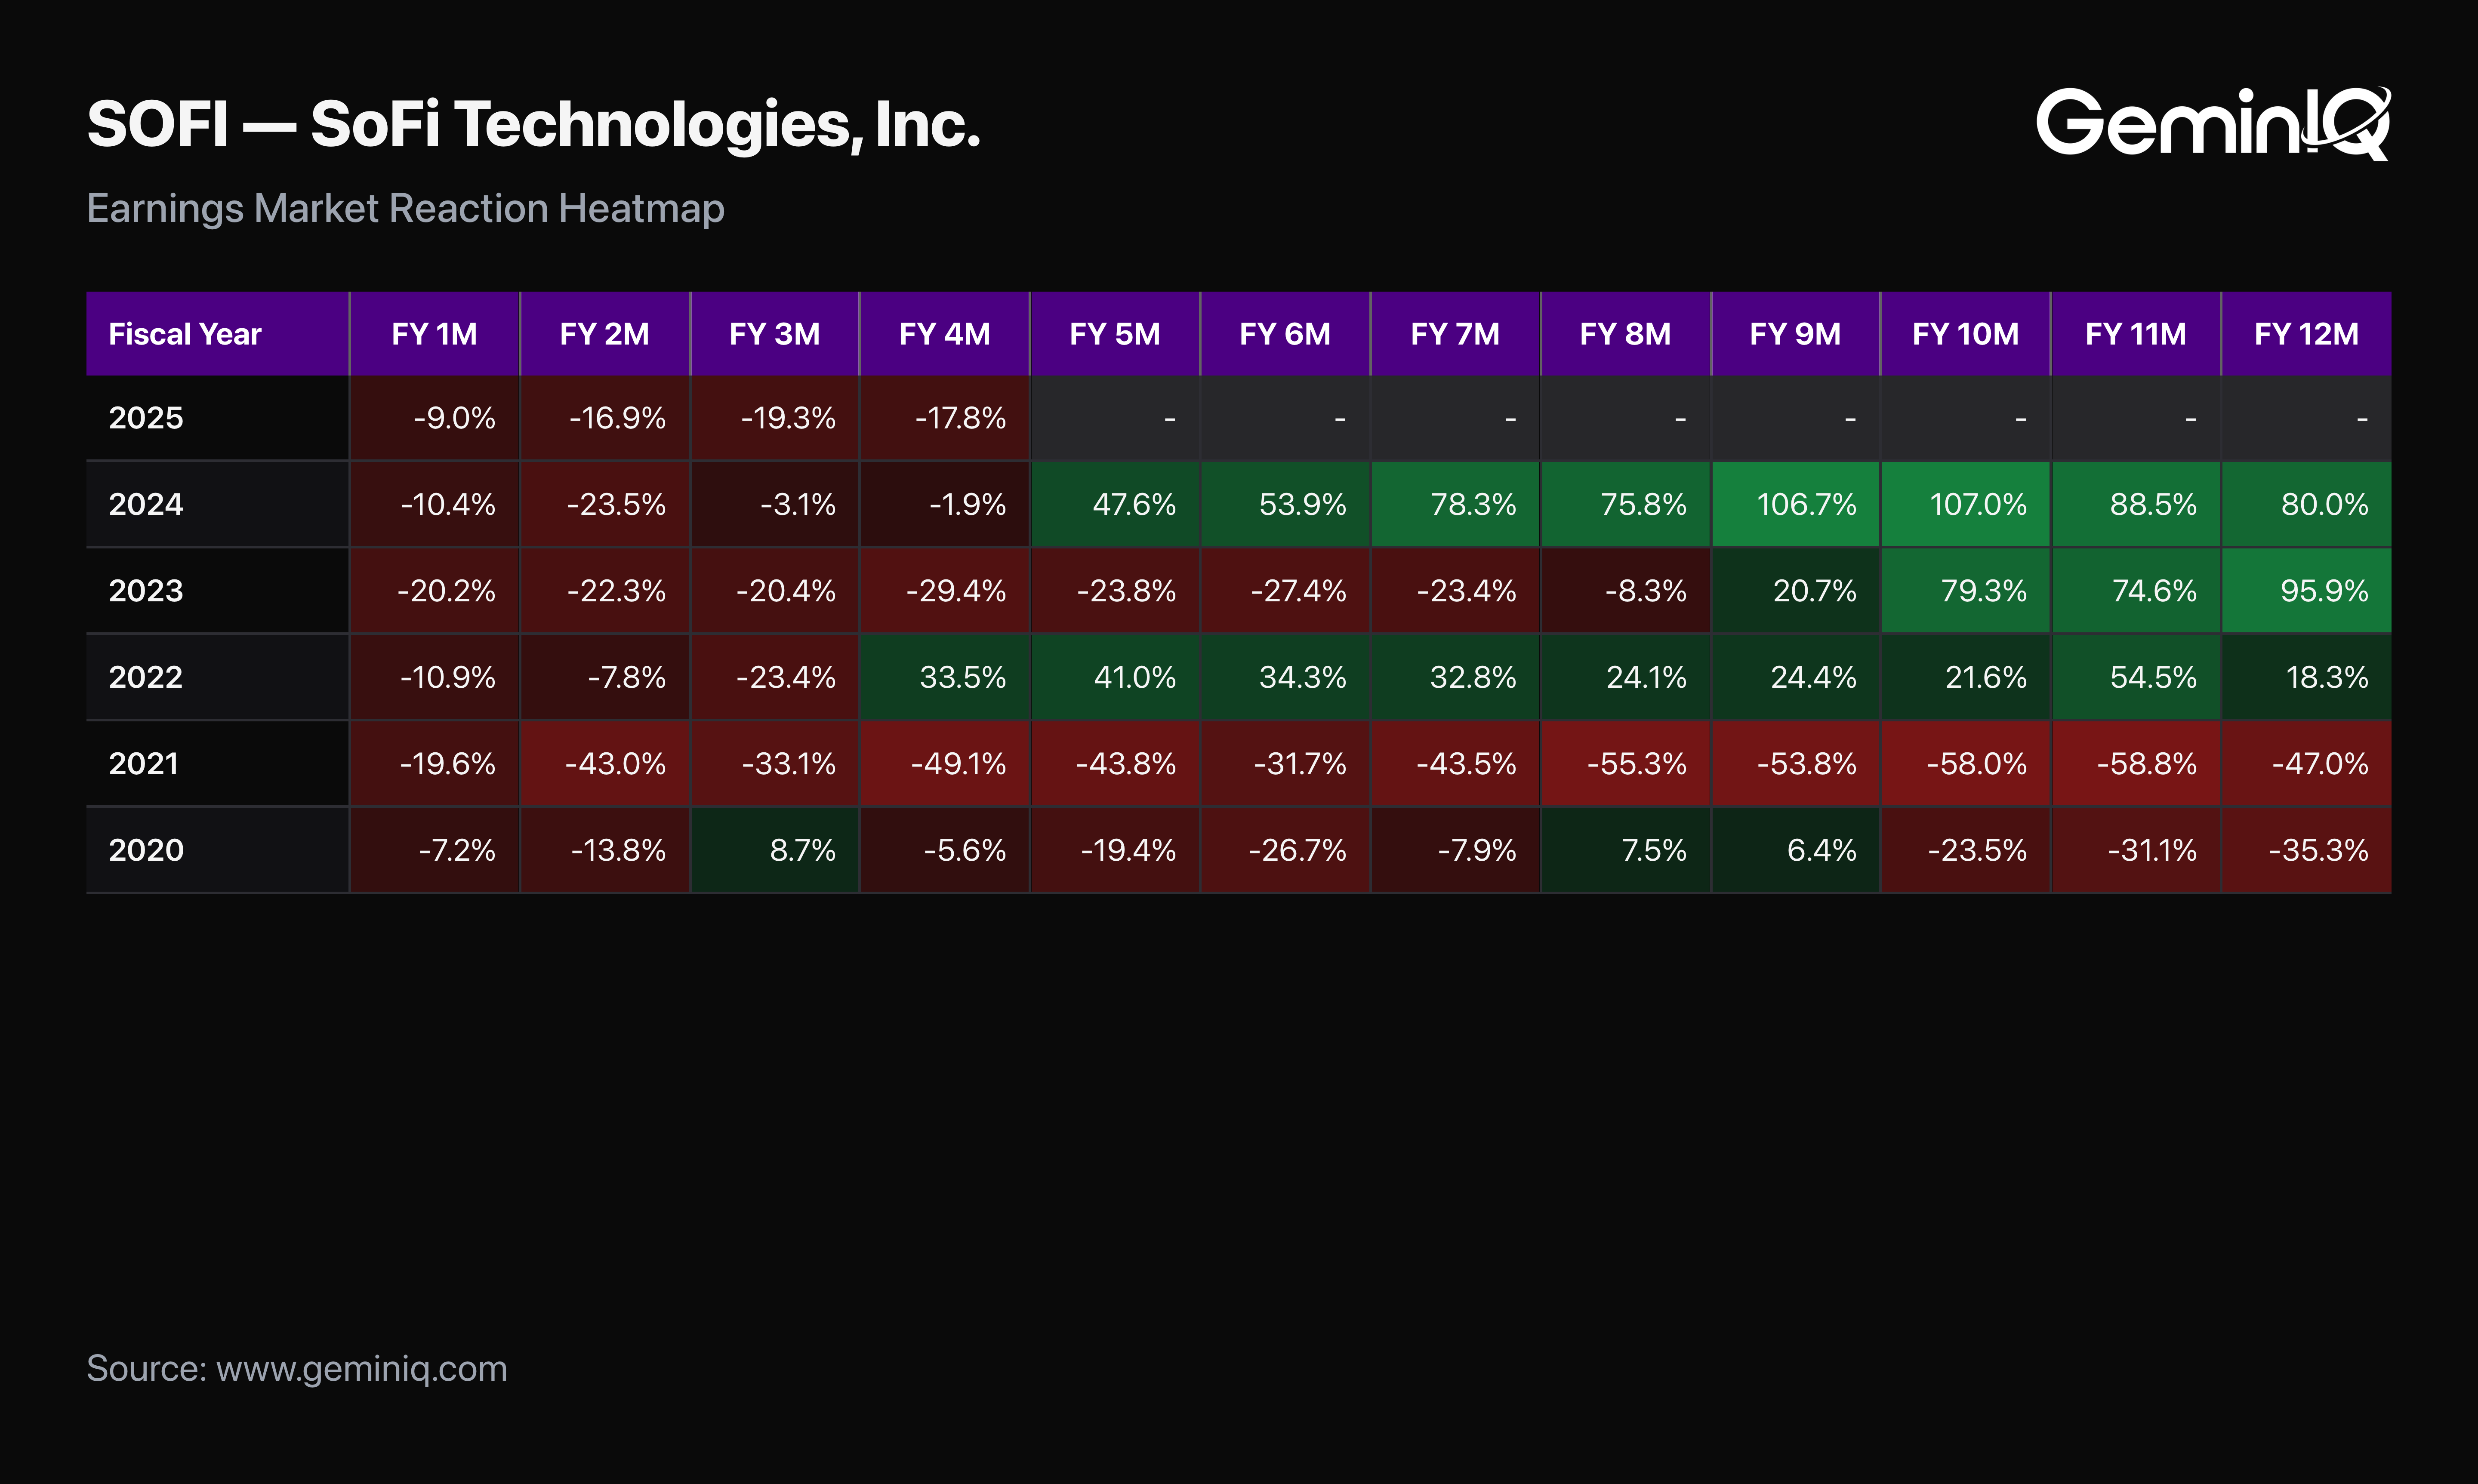
SoFi: The Quarter It Finally Turned a Profit
The number that made SoFi's FY2023 10-K worth a rally never made it into the trailing headline. Filed February 27, 2024, the filing still reported a trailing twelve-month net loss of -$300.7 Million on revenue growth of 34.9% year over year — solid, but not obviously different from prior quarters that hadn't triggered anything. Buried inside it: the fourth quarter itself posted $47.9 Million in net income, the company's first quarter of GAAP profitability since going public. The trailing figure still showed red because it carried three losing quarters with it.
The stock dropped 20.2% in the month after the filing regardless — a trailing-loss headline is a trailing-loss headline, whatever quarter produced it. Over the following twelve months, as the profitable quarter proved not to be a one-off, the stock gained 95.9%. This is closer to a normal "the filing undersold its own good news" story than a Carvana-style crisis reversal — a case where the trailing metric and the forward-looking signal briefly pointed in opposite directions.
GameStop: The Filing Didn't Move It
The filing explains the drop. It does not explain the recovery. GameStop's FY2024 10-K, filed March 26, 2024, reported trailing revenue of $5.273 Billion, down 11.0% year over year — a real, ongoing sales decline. The one bright spot was a swing to $6.7 Million in trailing net income, up from the prior year's -$313.1 Million loss, sitting on $938.9 Million in cash against just $28.5 Million in debt. That combination — shrinking sales, barely-positive earnings, an unusually clean balance sheet — dropped the stock 32.8% in the following month, a reasonable market reaction to a company still losing its core business even as it stopped bleeding cash.
The 70.5% twelve-month gain that followed has almost nothing to do with any of that. On May 12, 2024 — roughly six weeks after the filing — Keith Gill, the investor known as "Roaring Kitty" who had driven GameStop's 2021 short squeeze, returned to social media for the first time since 2021. Shares gained over 100% intraday on no company news whatsoever. This is the cleanest illustration in the entire study of why every finding here is stated as association, not prediction.
Upstart: Flat on Paper, Cut in Half in Practice
Upstart's FY2022 10-K, filed February 16, 2023, reported trailing revenue of $842.4 Million, down just 0.7% year over year — a headline that looks almost unremarkable next to the other filings on this list. The quarterly trend underneath it did not: revenue fell sequentially every quarter of the year, from $314.0 Million in Q1 to $258.3 Million, $157.2 Million, and finally $112.9 Million in Q4 — a top line cut by more than half in nine months as rising rates froze the loan-funding markets Upstart's AI-lending model depended on. Net income swung from $58.9 Million in Q4 2021 to a -$55.3 Million loss in Q4 2022, and GeminIQ's pre-calculated Stock-Based Compensation to Revenue shows dilution accelerating in the opposite direction of the business, from 8.6% of revenue a year earlier to 15.0% by the panic quarter.
The stock dropped 18.1% the following month and gained 68.8% over the next twelve, as rate expectations eased and the lending-freeze thesis that had driven the sell-off started to reverse. The full-year revenue figure alone would have missed the entire story in both directions — flat on paper, collapsing and then stabilizing underneath.
The Method
Every name above came from the same pipeline, run the same way. Each filing in this study is bucketed by its cumulative return in the month after its filed date, using GeminIQ's Earnings Market Reaction Heat Map joined to XBRL-tagged financial statements for the same period. Returns are cumulative from the filing date, never compounded across months, and the top and bottom 1% of the universe are winsorized before any base-rate comparison is drawn. The full methodology — including how the base rate is computed and why medians are reported alongside means — is covered in How We Build a Filing Data Study.
Check Your Holdings
None of the eleven reversals above were predictable from the filing that triggered the drop — Carvana's and Upstart's recoveries traced back to numbers inside the filing itself, Wayfair's and GameStop's did not. What can be checked, on any position that has just dropped sharply after a 10-Q or 10-K, is which category it falls into. Pull up the ticker's Earnings Market Reaction Heat Map to see the exact cumulative move at one, three, and twelve months, then open its Financial Statements for that same filing and check whether revenue growth actually decelerated or margins actually compressed, the way Carvana's did, versus a drop that shows up on the heat map with nothing corresponding to it in the numbers. Cross-reference Total Debt and Net Debt against the prior quarter — a leverage ratio doubling in two quarters is a different risk profile than one holding flat. That comparison does not forecast which way a given drop resolves. It tells you whether the panic and the filing were describing the same problem.
Wall Street's data. Main Street's price.
Institutional terminals charge thousands a year for as-filed accuracy. GeminIQ gives you the same thing for a fraction of the cost: financials built directly from raw SEC EDGAR filings, not third-party APIs, with full XBRL traceability back to the original 10-K or 10-Q. No normalized guesswork, just calculated metrics, charts, screeners, and watchlists built on numbers exactly as the company reported them. Start researching now at GeminIQ.com.
All figures are drawn from each company's as-filed 10-K and 10-Q filings, publicly available on SEC EDGAR. Post-filing market reaction is measured from each filing's filed date. Methodology: How We Build a Filing Data Study.
Disclaimer: The content in this blog is for educational and entertainment purposes only and does not constitute financial, legal, or tax advice. Investing involves risk, including the loss of principal. Past performance is not indicative of future results. The post-filing return patterns discussed in this article represent historical observations and do not constitute predictions of future stock price movements. The views expressed are my own and not intended as financial advice or a guarantee of future performance.