
Palantir 10-K Analysis (2026): The Dilution Story Reversed

By Chad Hartman
Published · Last updated
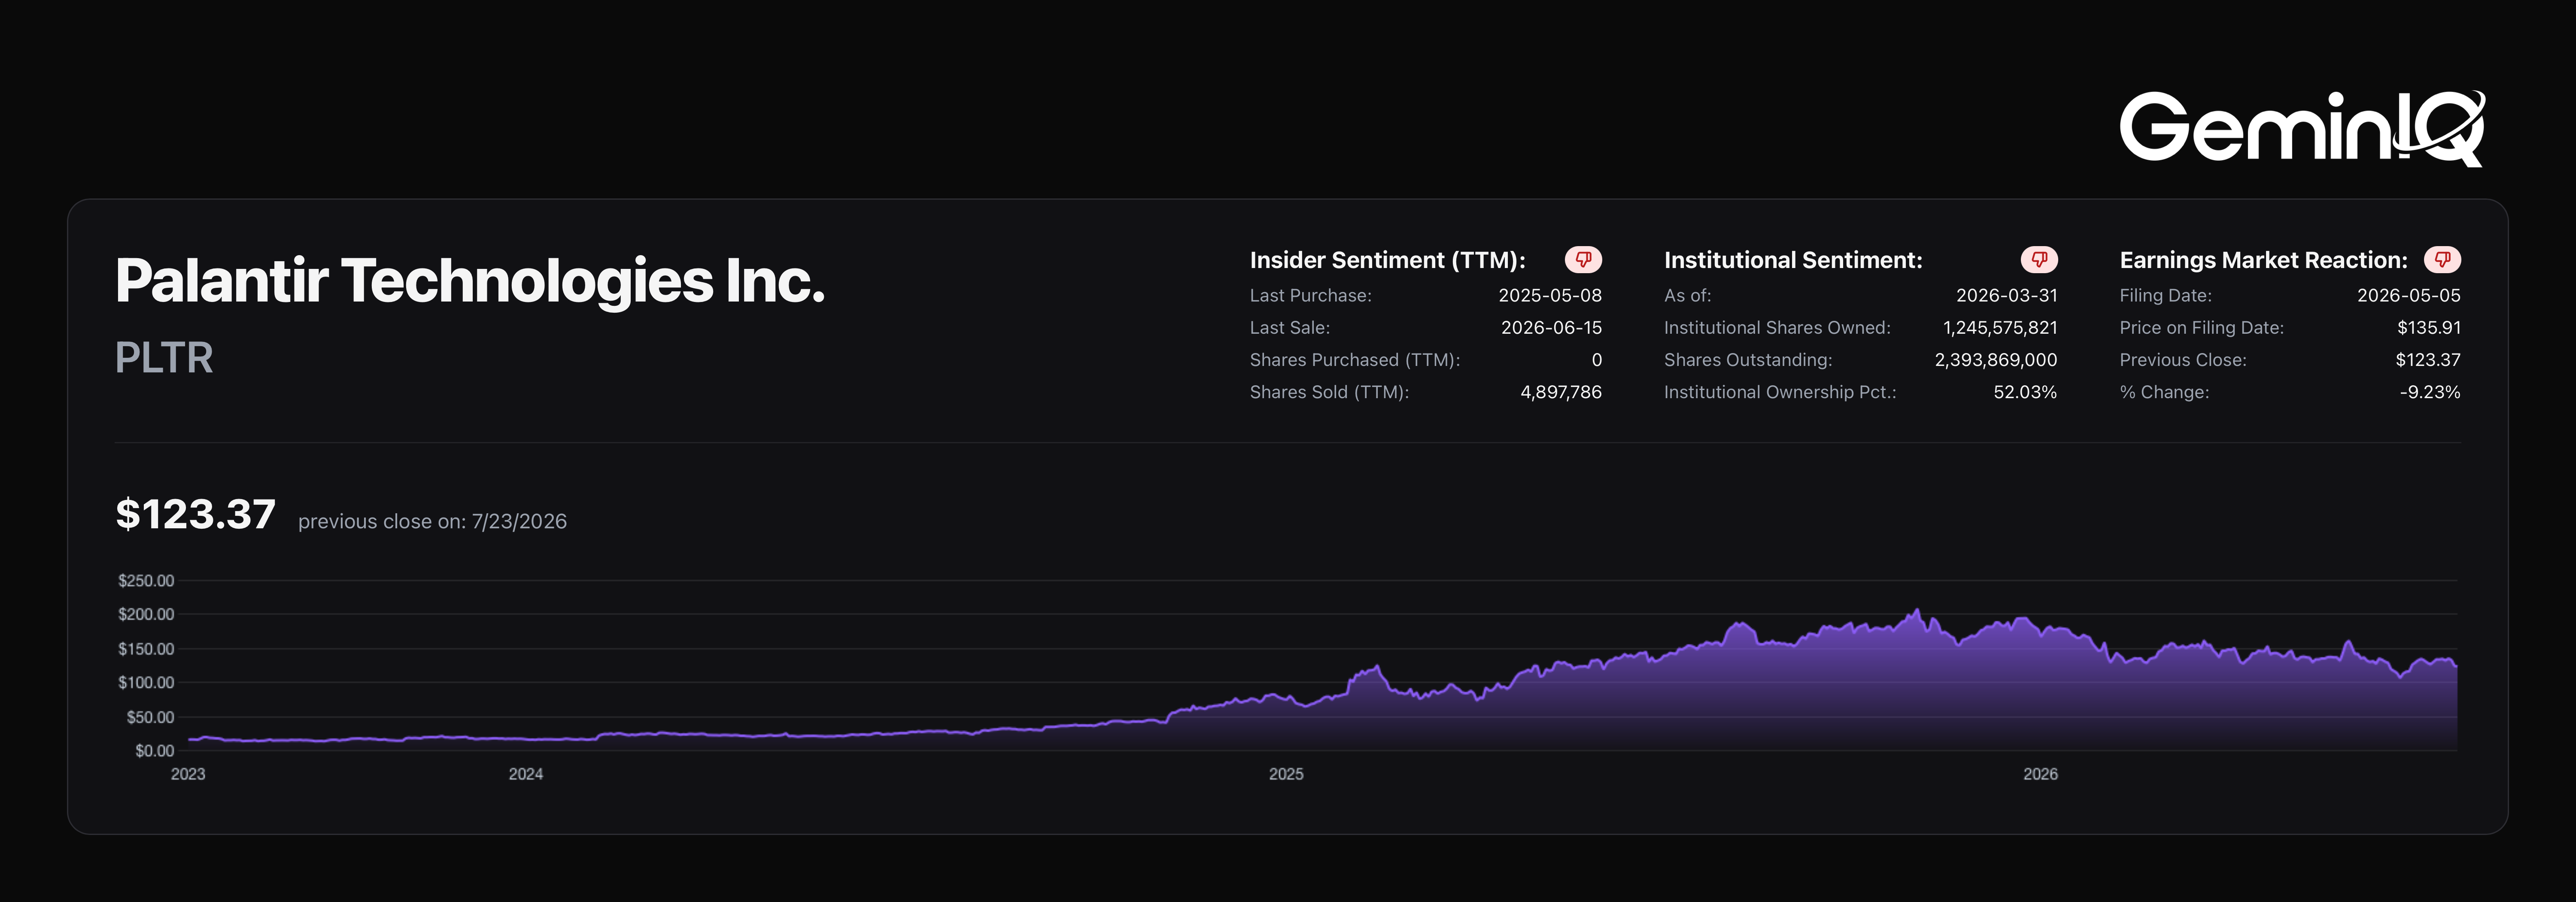
Palantir ($PLTR) filed its FY2025 10-K on February 17, 2026. Revenue grew 56.2% to $4.48 Billion and operating margin expanded from 10.8% to 31.6%, one of the sharpest single-year profitability inflections in large-cap software. The stock is reputationally a dilution machine, and for years that was fair. This filing reverses it: stock-based compensation as a share of revenue fell to 15.3% from 24.1%, its lowest ever. The operating leverage is real and improving. The valuation is the part that isn't debatable.
| Field | Value |
|---|---|
| Ticker | $PLTR |
| Filing | FY2025 10-K |
| Filed | February 17, 2026 |
| Period End | December 31, 2025 |
| Revenue Growth | +56.2% |
| Operating Margin (TTM) | 31.59% |
| Stock Comp to Revenue | 15.28% |
| Price to Sales (TTM) | 94.11 |
The Operating Leverage Is Real
Software businesses are supposed to show operating leverage as they scale. Most promise it. Palantir just posted a year where it actually happened at scale.
The Data: Palantir's Total Revenues grew 56.2%, from $2.87 Billion to $4.48 Billion. Operating Income (Income From Operations) grew far faster, from $310.4 Million to $1.41 Billion, an increase of 355.5%. GeminIQ's Operating Profit Margin expanded from 10.83% to 31.59%, nearly tripling. Net Income reached $1.63 Billion, up 251.6%.
The mechanism is operating expenses growing slower than revenue. Total Operating Expenses rose to $2.27 Billion from $1.99 Billion, an increase of just 14.2% against 56.2% revenue growth. Gross margin also expanded, with GeminIQ's Gross Profit Margin reaching 82.37%.
The GeminIQ Edge: Operating leverage is easy to claim and hard to prove. The proof is in the growth-rate gap: revenue up 56.2%, operating expenses up 14.2%. Reading both lines from the Financial Statements is what turns a margin percentage into a demonstrated fact.
The Dilution Reputation, Reversed
Palantir's stock-based compensation has been the central bear argument for years. This filing is the first strong evidence against it.
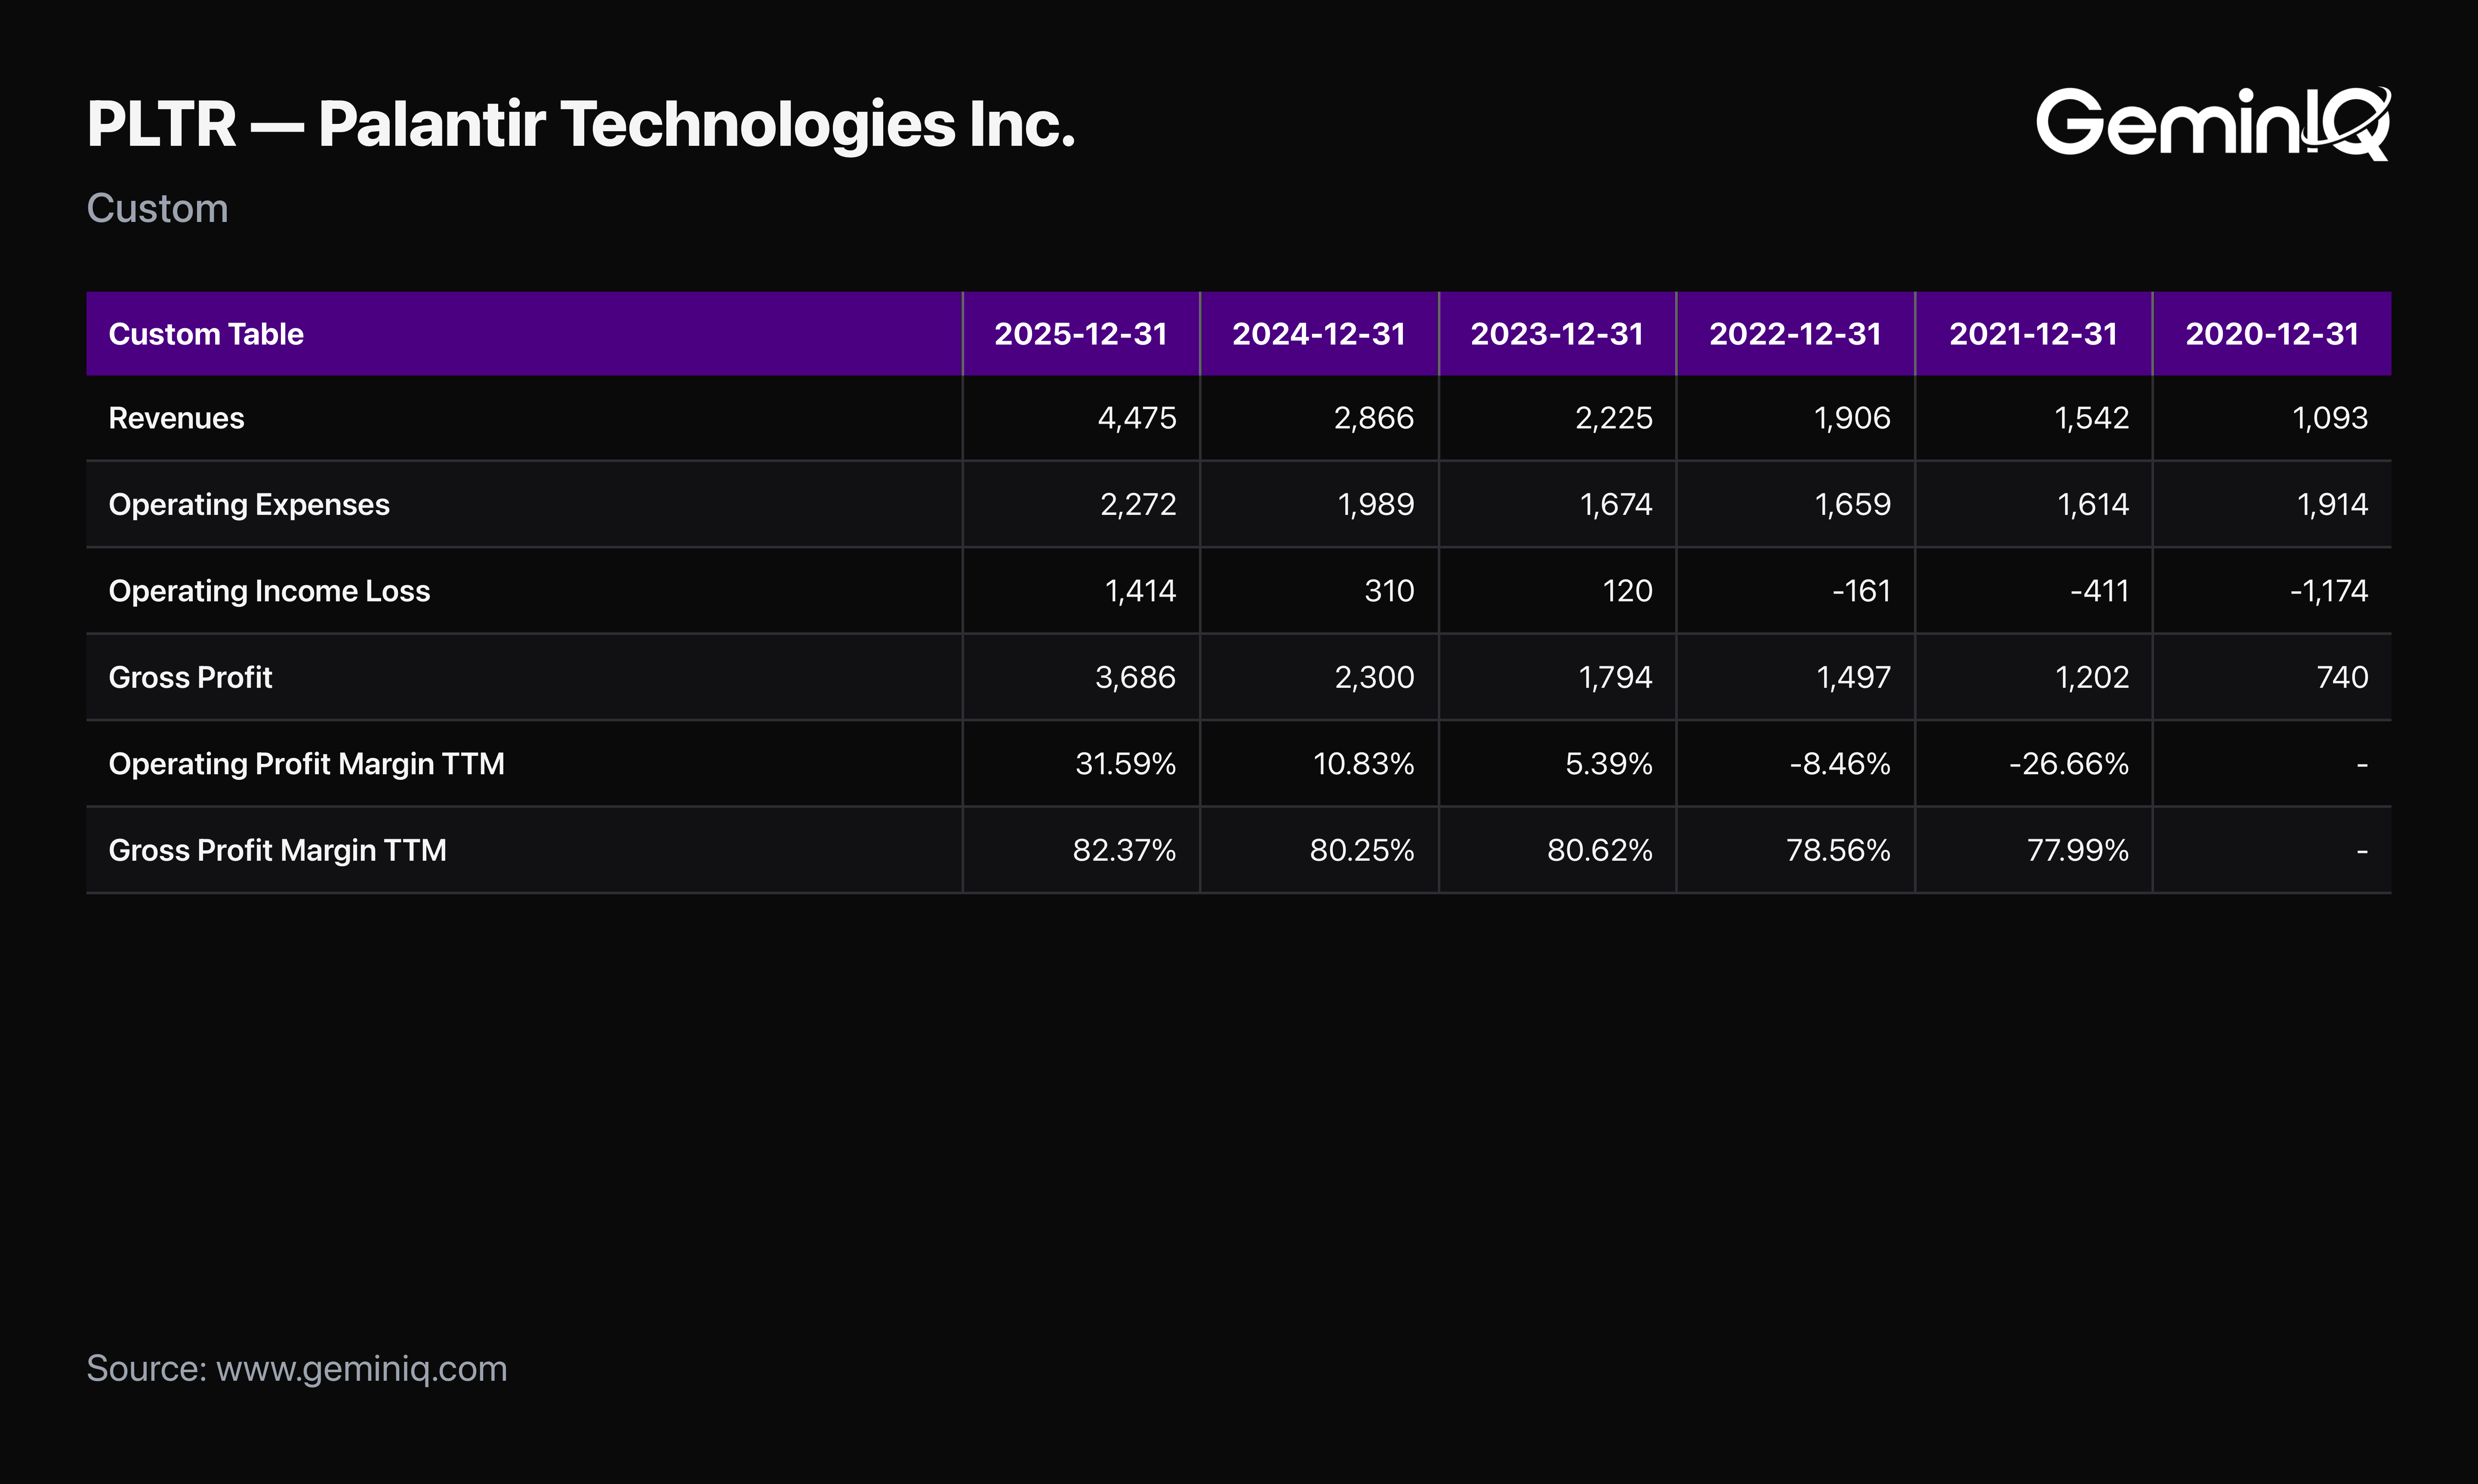
The Data: Palantir's Share Based Compensation was $684 Million in FY2025, actually down slightly from $691.6 Million the prior year, even as revenue grew 56.2%. GeminIQ's Stock Based Compensation to Revenue fell to 15.28% from 24.14%, and from 50.47% as recently as FY2021. Flat SBC dollars against sharply rising revenue is the definition of the dilution problem shrinking.
The share count confirms the improvement without fully clearing it. Weighted Average Number Of Shares Outstanding Basic rose to 2,369.6 Million from 2,250.2 Million, an increase of 5.3%, and diluted shares rose 4.7%. GeminIQ's Dilution Ratio sits at 1.08, meaning diluted shares still exceed basic by roughly 8%. Dilution has not stopped. It has decelerated hard.
The GeminIQ Edge: The bear case on Palantir was always that growth was being bought with shareholder dilution. A 15.28% SBC-to-revenue ratio, down from 50.47% four years ago, is the specific number that undercuts it. The stock is still being diluted at roughly 5% a year, so the argument is weaker, not dead.
Cash Generation Caught Up to the Story
Improving margins mean nothing if they don't convert to cash. Here they did, and by a lot.
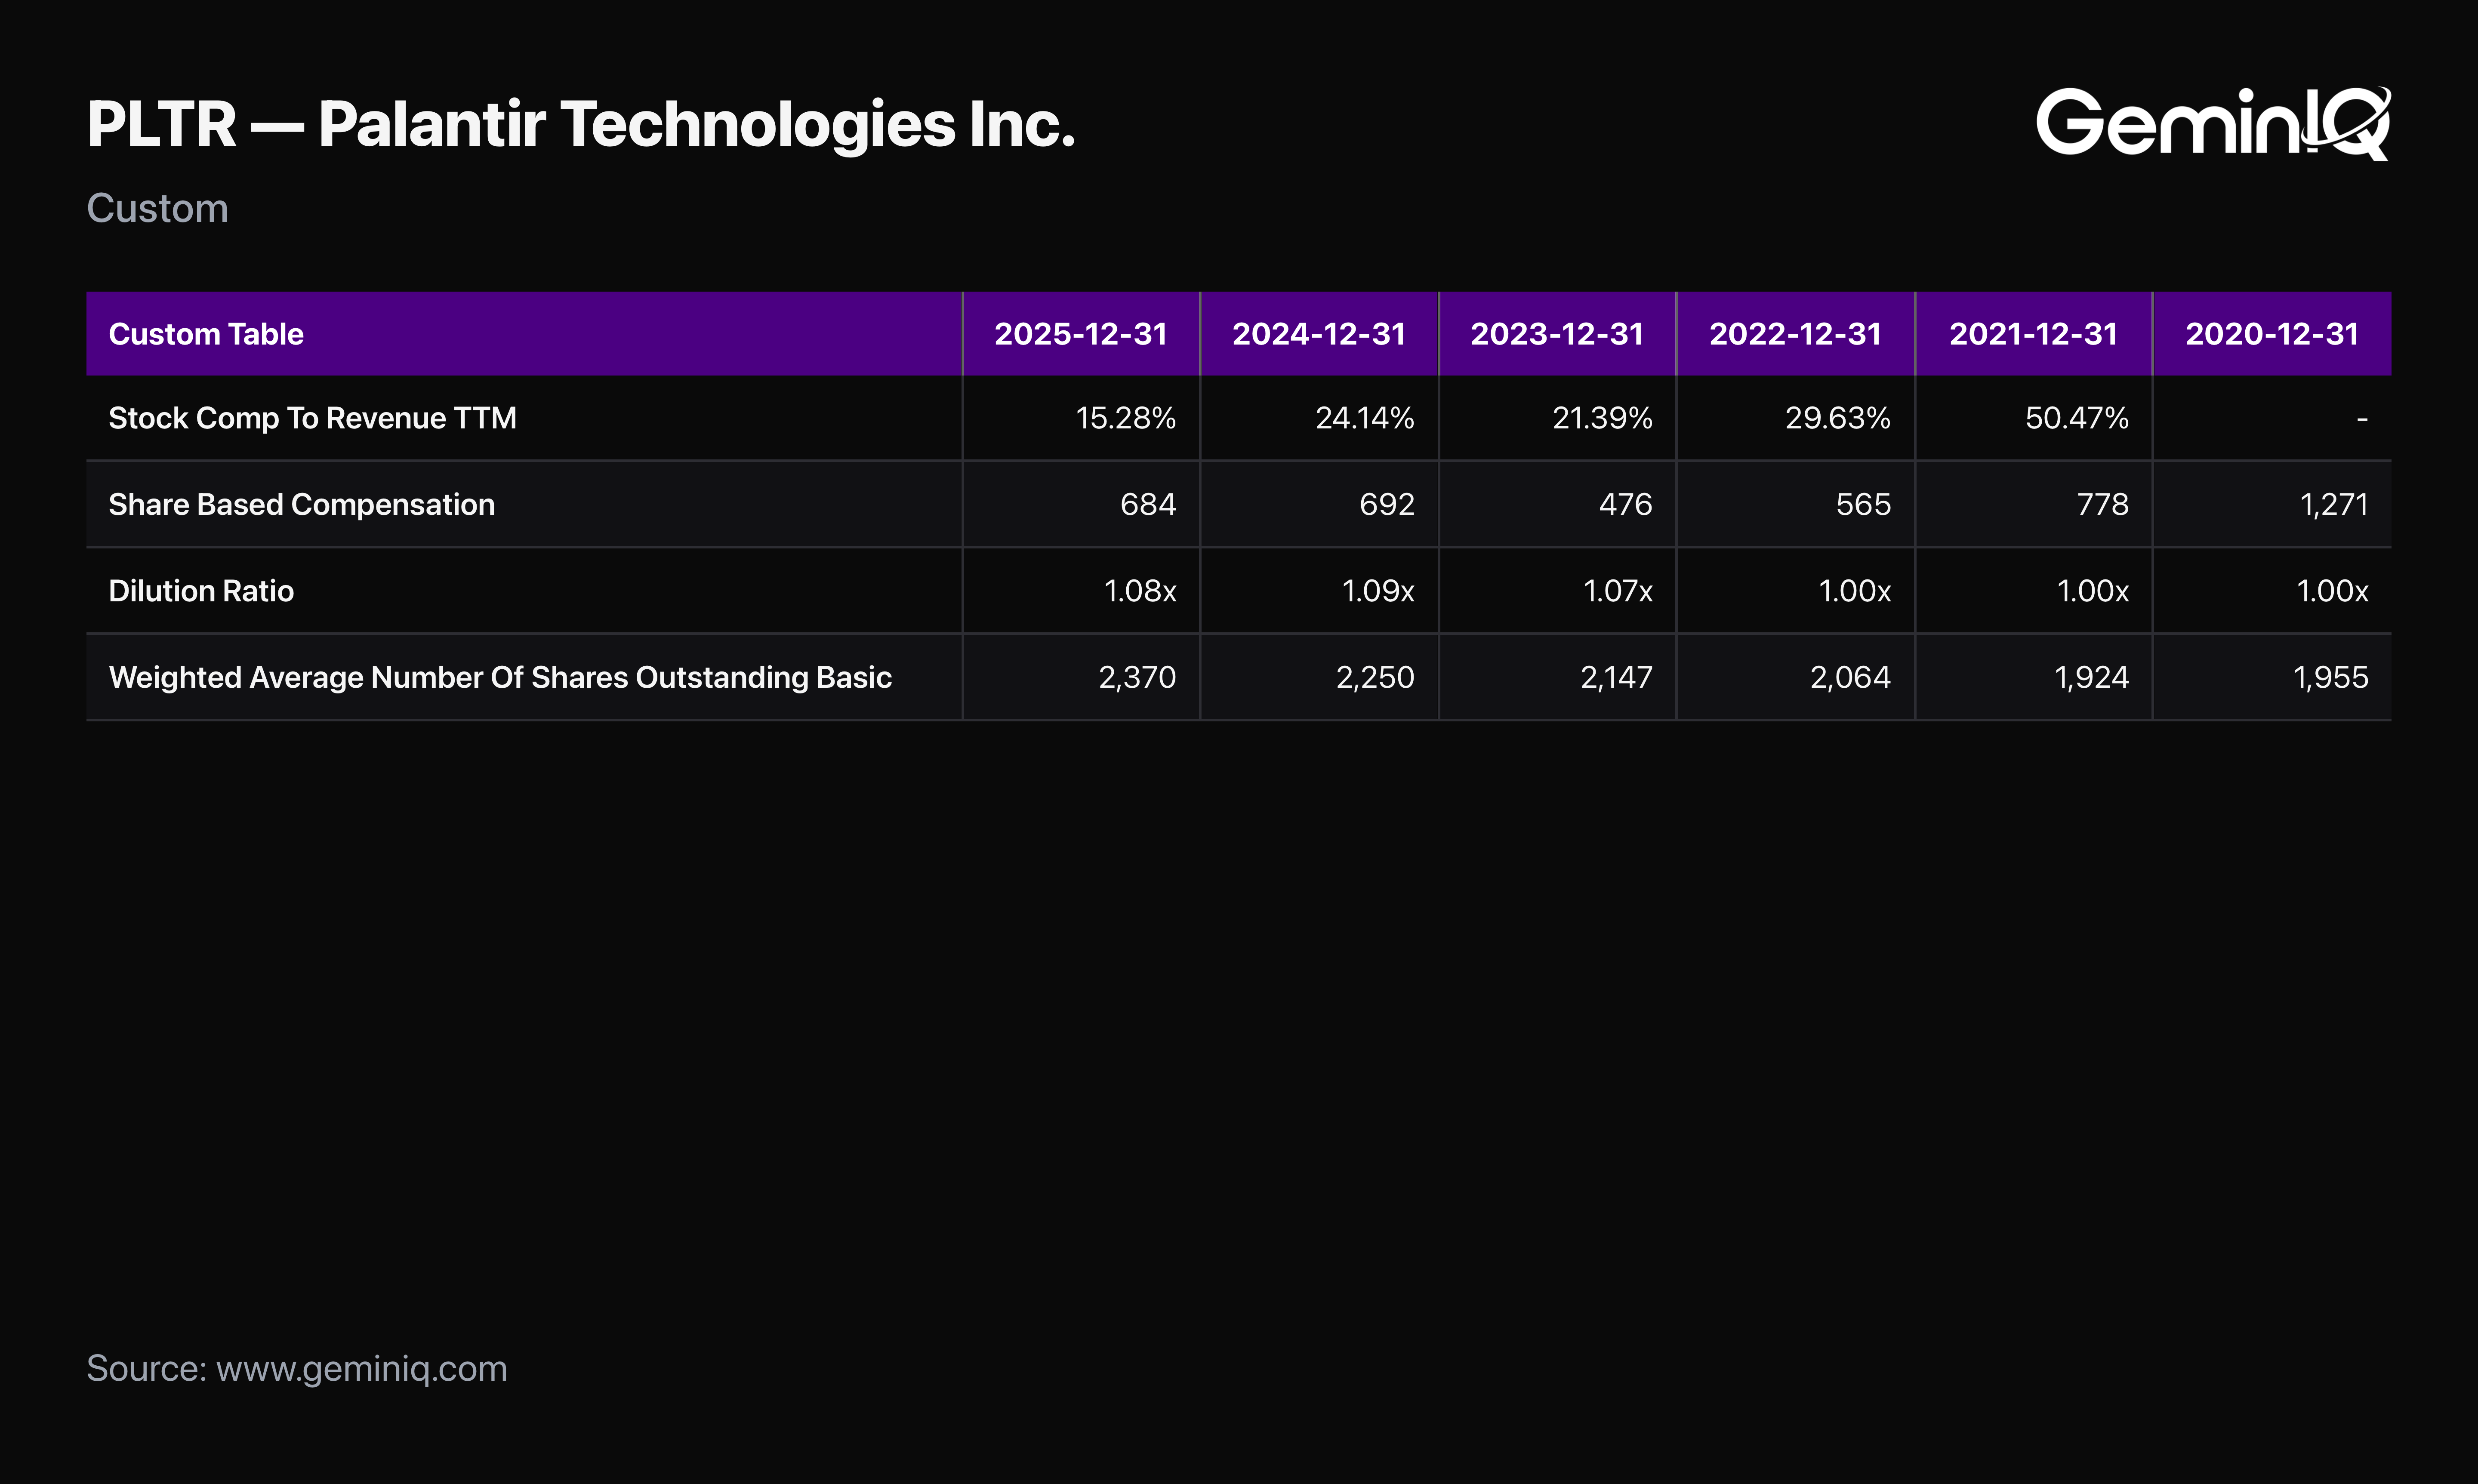
The Data: Palantir's GeminIQ Free Cash Flow reached $2.10 Billion in FY2025, up 84.1% from $1.14 Billion. On revenue of $4.48 Billion, that is a free cash flow margin of roughly 47%. Operating Cash Flow was $2.13 Billion. Combined with 56.2% revenue growth, Palantir's Rule of 40 score, revenue growth plus free cash flow margin, comes to roughly 103, more than double the 40 threshold the framework treats as the mark of a healthy growth-stage software business.
The balance sheet carries no debt. Cash stood at $1.45 Billion, and GeminIQ's Net Debt is -$1.45 Billion, a pure net cash position. Deferred Revenue grew to $409.0 Million from $259.6 Million, a 57.5% increase roughly in line with revenue.
The GeminIQ Edge: A Rule of 40 score above 100 is rare, and Palantir posted it while turning GAAP-profitable and decelerating dilution at the same time. On the operating fundamentals alone, this is close to a best-case software filing.
The Number That Isn't Debatable
Every operating metric argues for Palantir. One metric argues the other way, and it isn't close.
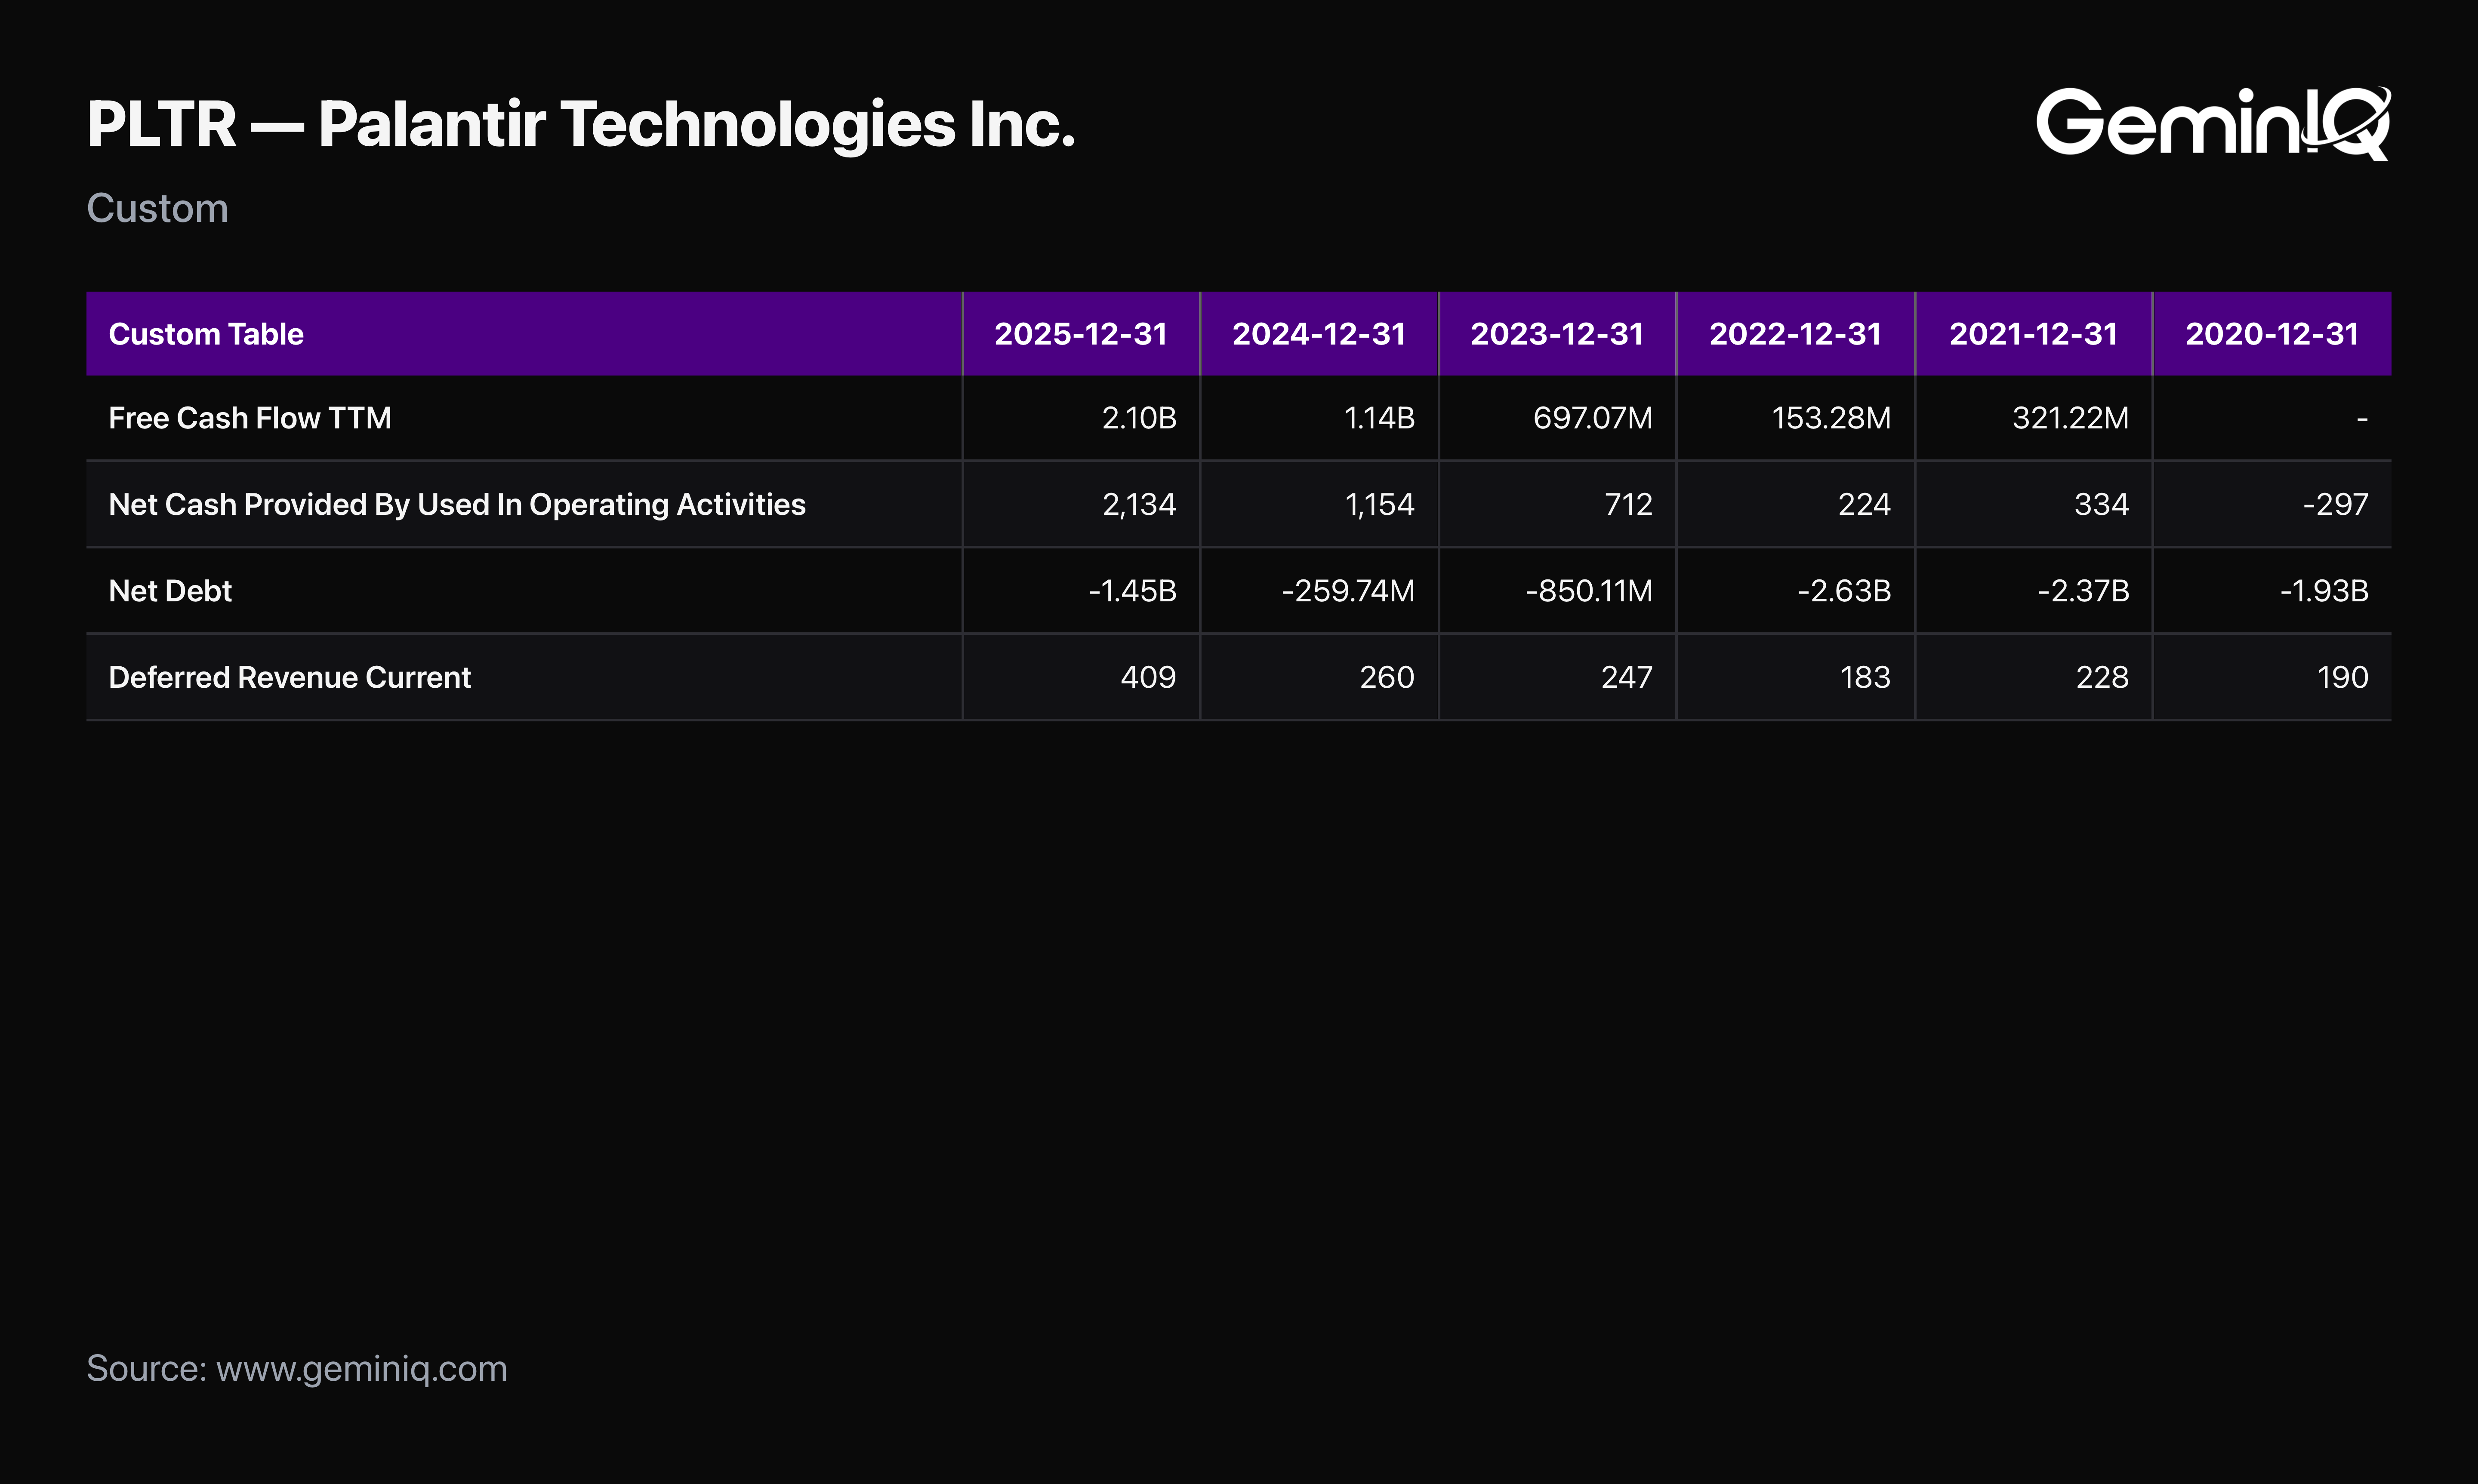
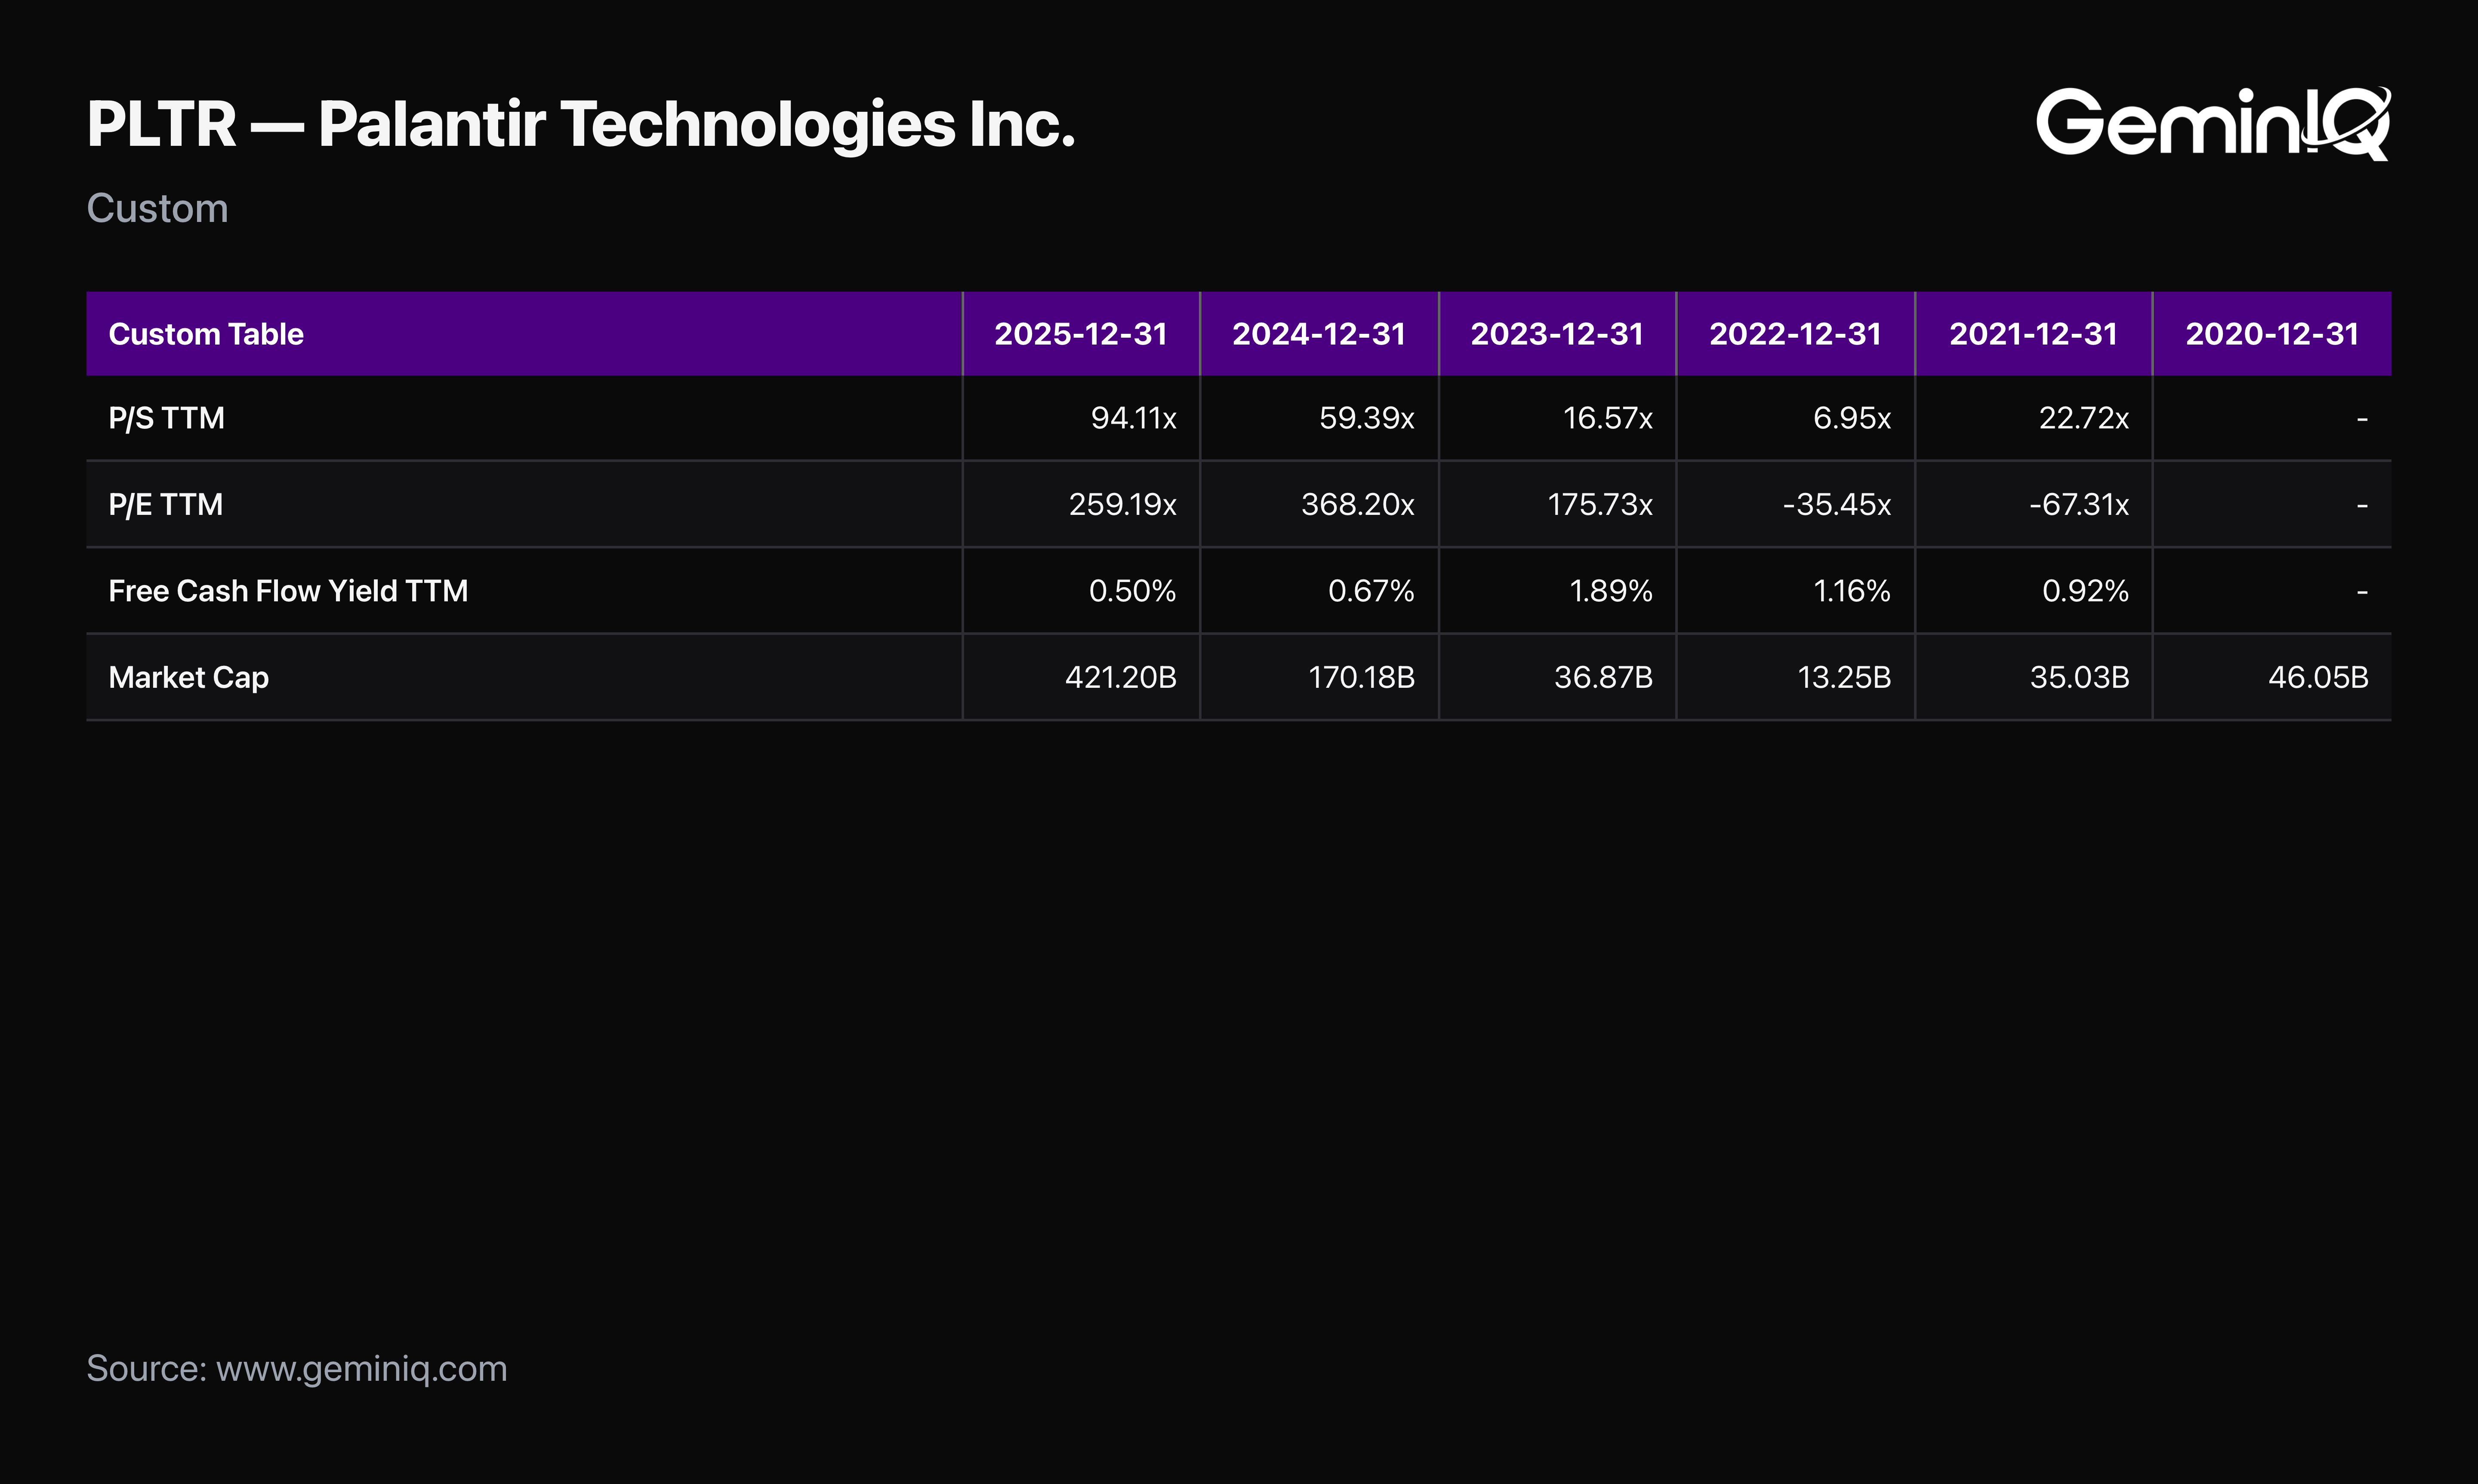
The Data: Palantir's market capitalization reached $421.2 Billion at fiscal year end. Against $4.48 Billion in revenue, that is a GeminIQ Price to Sales Ratio of 94.11. The trailing Price to Earnings Ratio is 259.2, and GeminIQ's Free Cash Flow Yield is 0.50%. For context, the price-to-sales ratio has expanded from 16.57 at the end of FY2023 to 94.11 now, even as revenue grew rapidly, because the share price grew faster.
The stock rose from $17.17 at the end of FY2023 to $177.75 at the end of FY2025, a gain of more than 935% across two years while revenue roughly doubled. The re-rating did the majority of the work.
The GeminIQ Edge: A price-to-sales ratio of 94 requires assumptions about future growth that no single filing can validate or refute. The operating improvements documented above are real and would justify a substantial premium. Whether they justify 94x sales is a question about the next several years of growth, not about this 10-K, and the filing is honest about which parts it can and cannot answer.
Smart Money and the Insider Record
What are the people actually running the company doing with their own money?
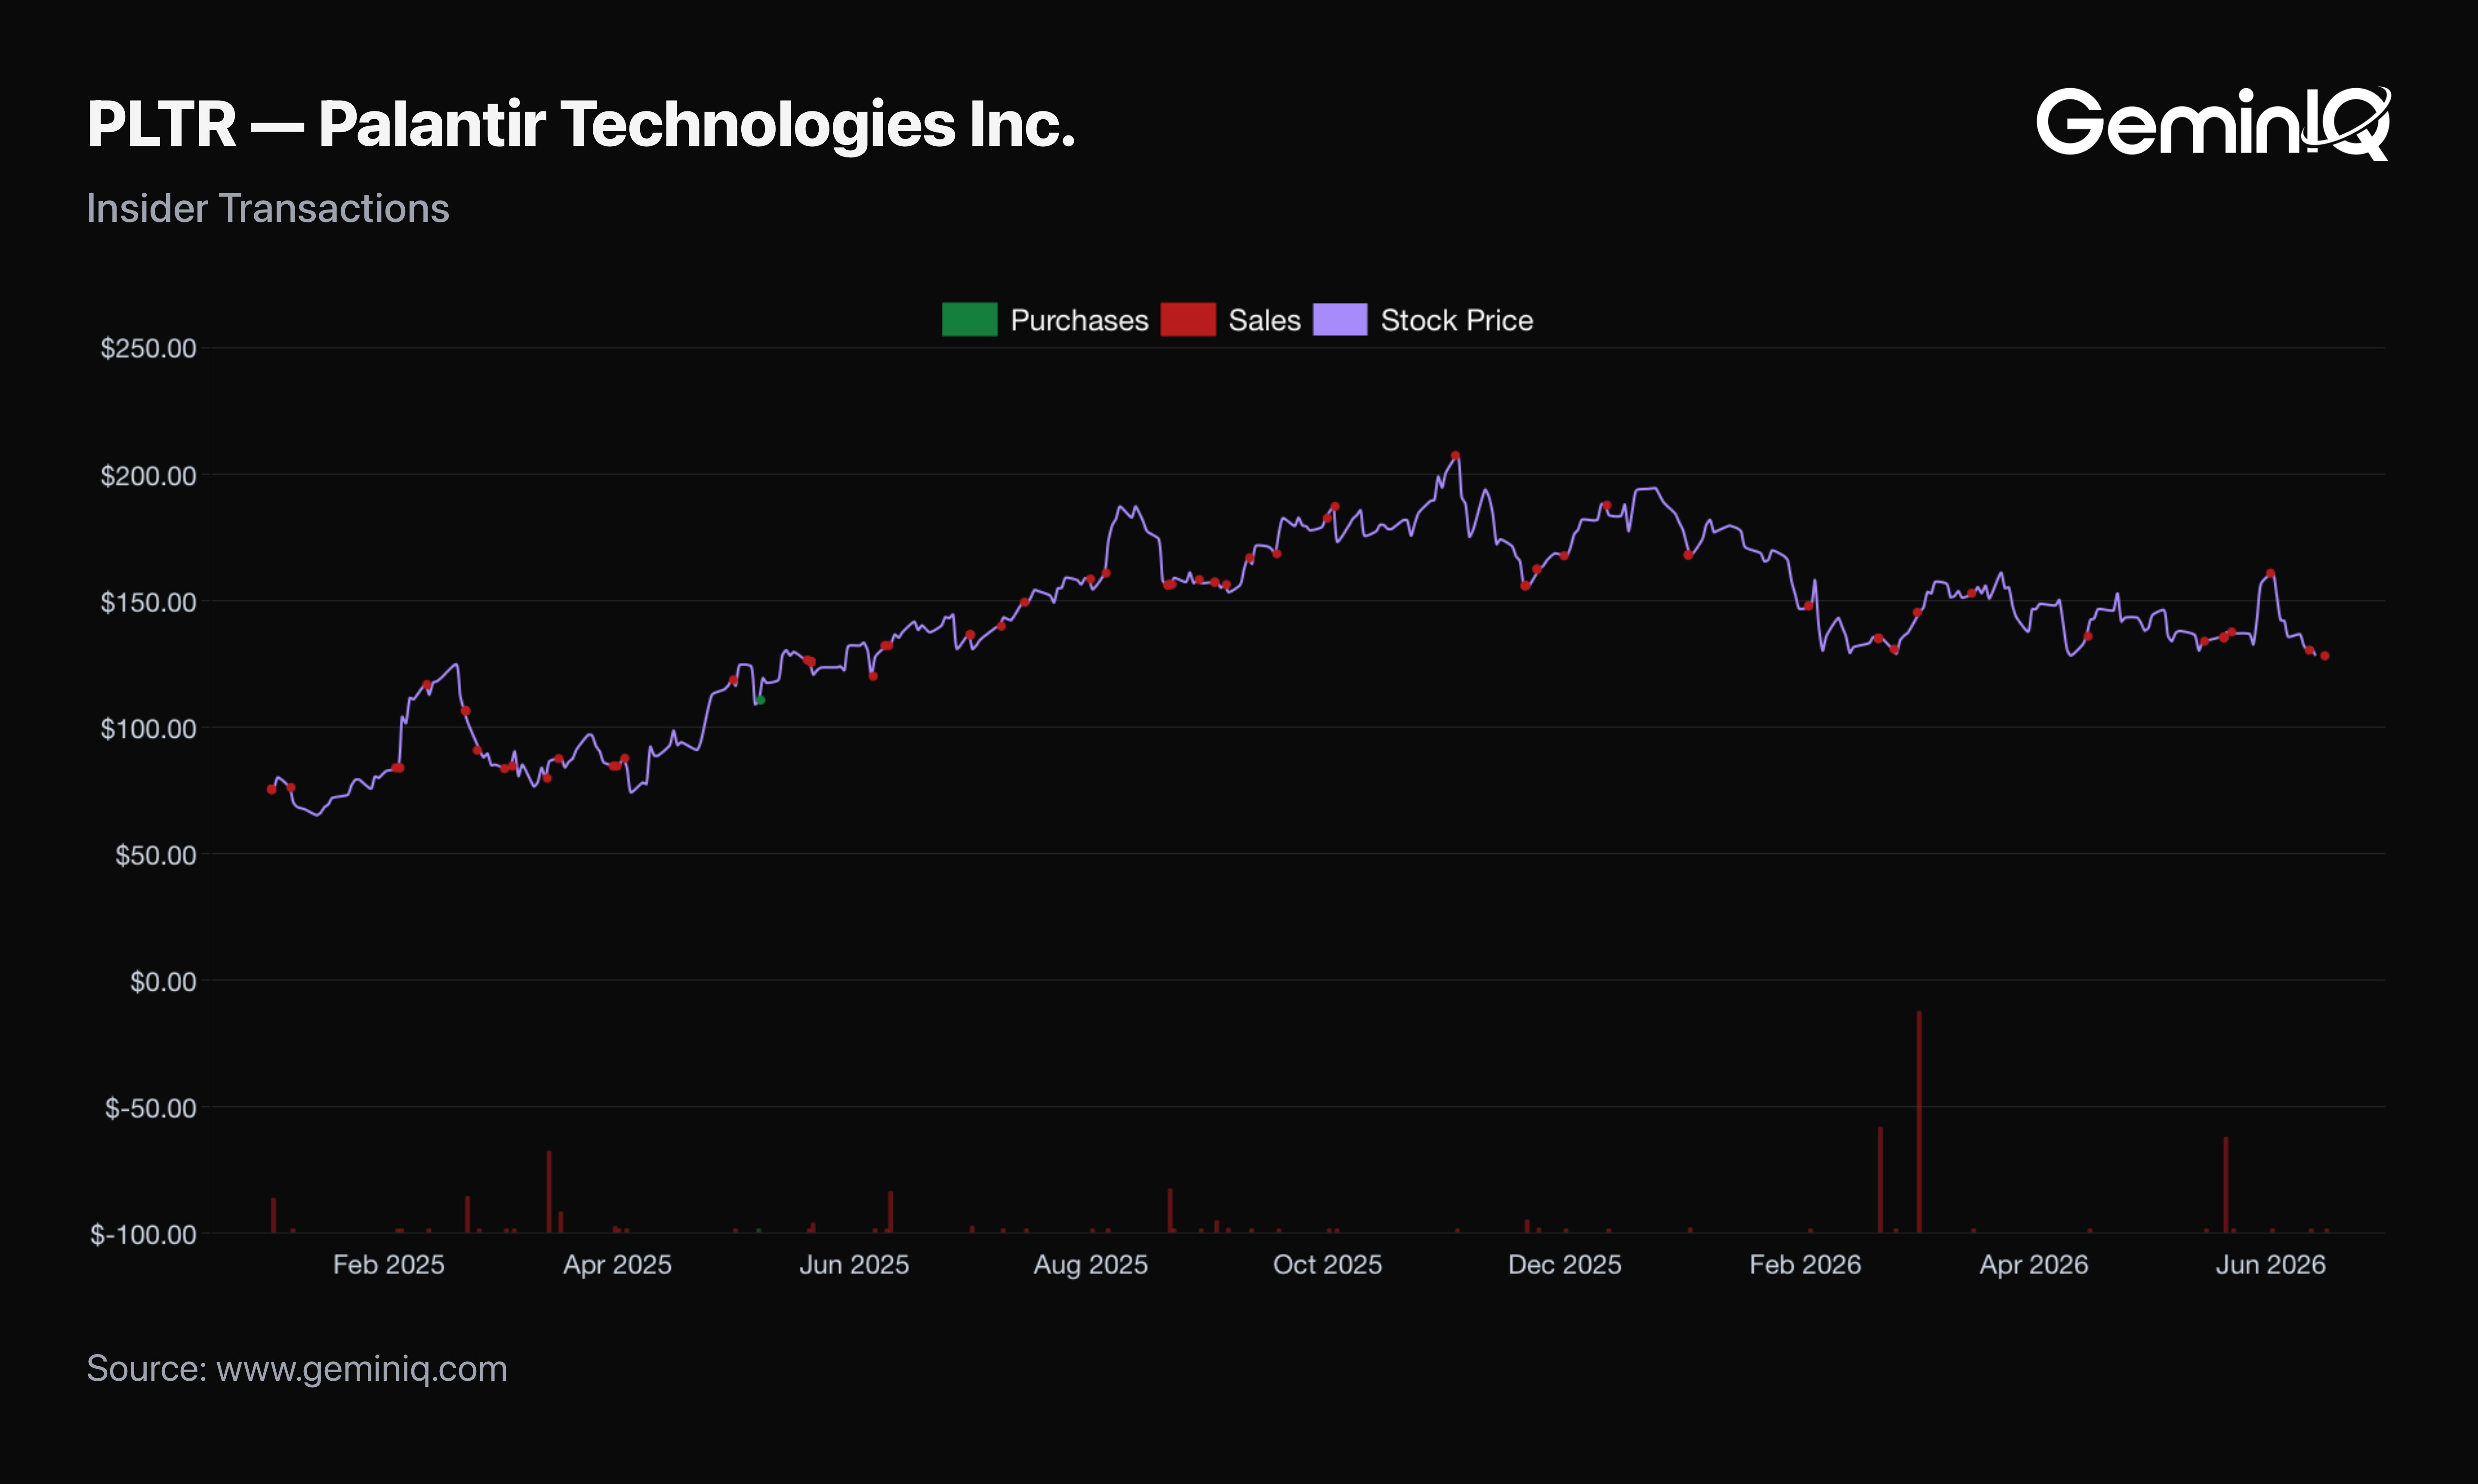
The Data: Since January 1, 2025, GeminIQ's Insider Transactions records 115 sale filings by Palantir insiders totaling $1.67 Billion, against a single purchase of $1.16 Million. The largest sale is 2,000,000 shares by a Director at $144.11 on March 2, 2026, for $288.22 Million. Three sales of 1,250,000 shares each, at $84.77, $82.41 and $81.29 in March 2025, came from a Director and Officer.
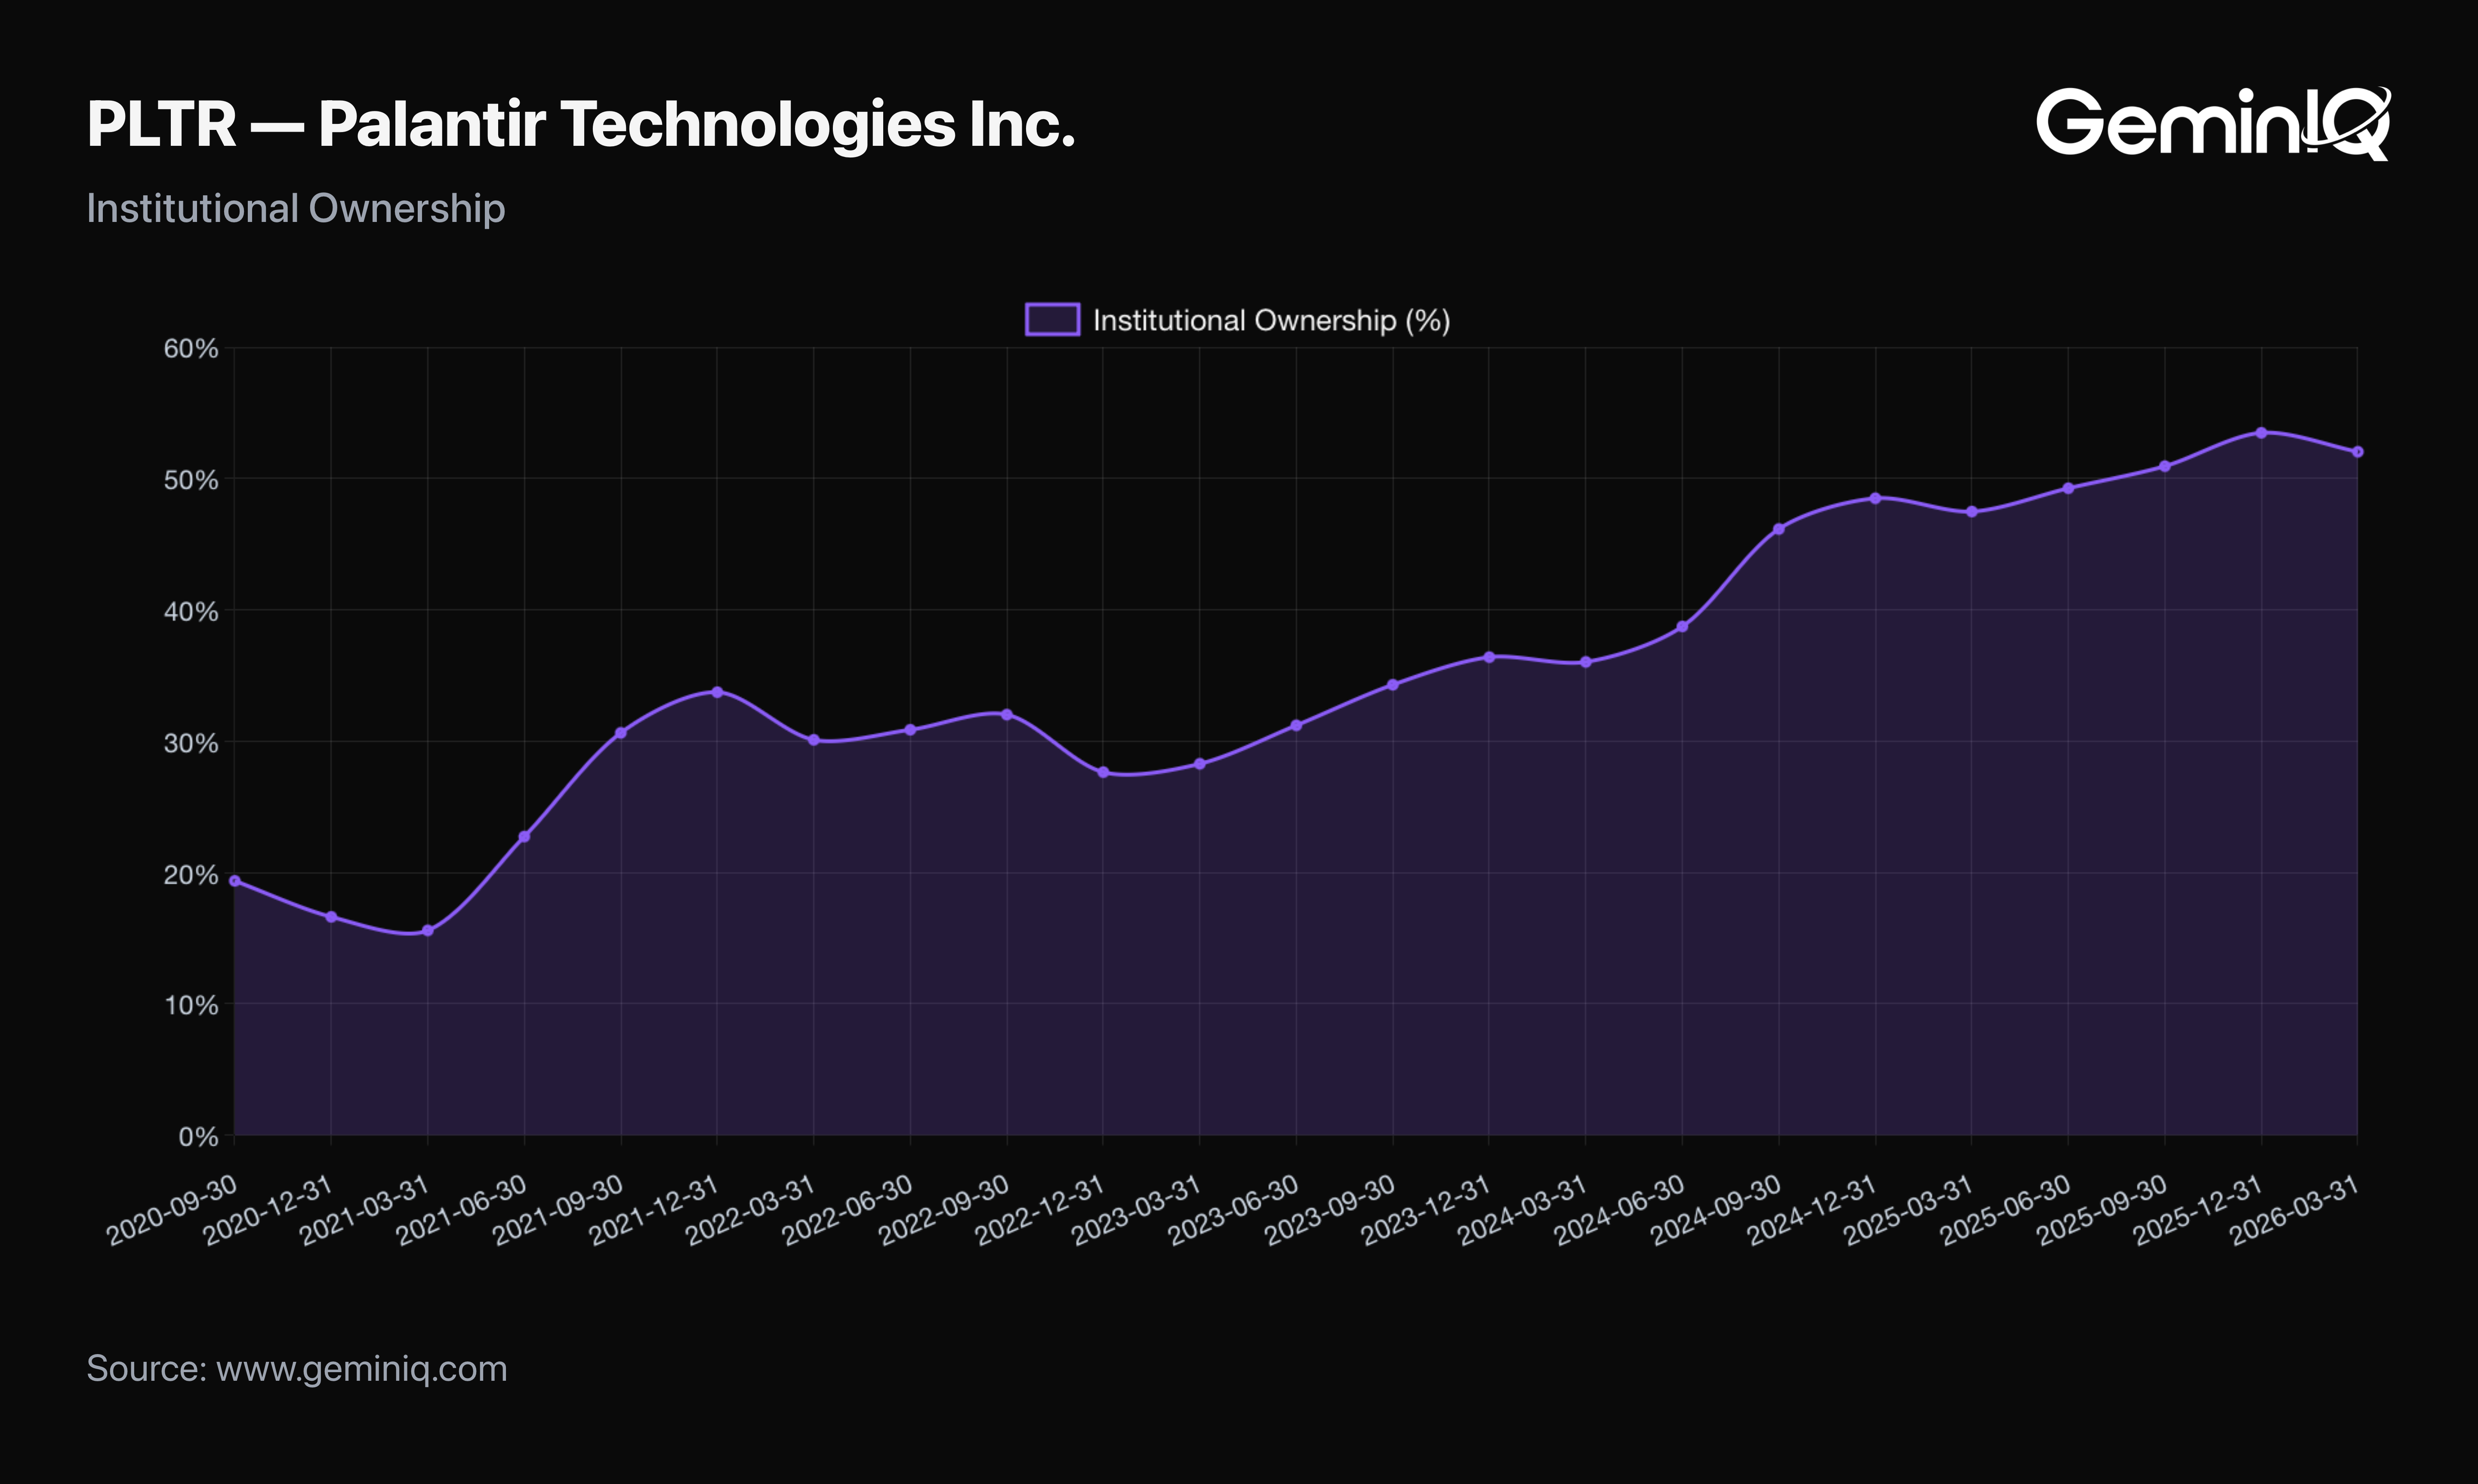
Institutional Ownership reached 53.48% of shares outstanding as of the quarter ending December 31, 2025, easing to 52.03% as of March 31, 2026. Both come from quarterly 13F filings and describe positioning as of those quarter-ends rather than current holdings.
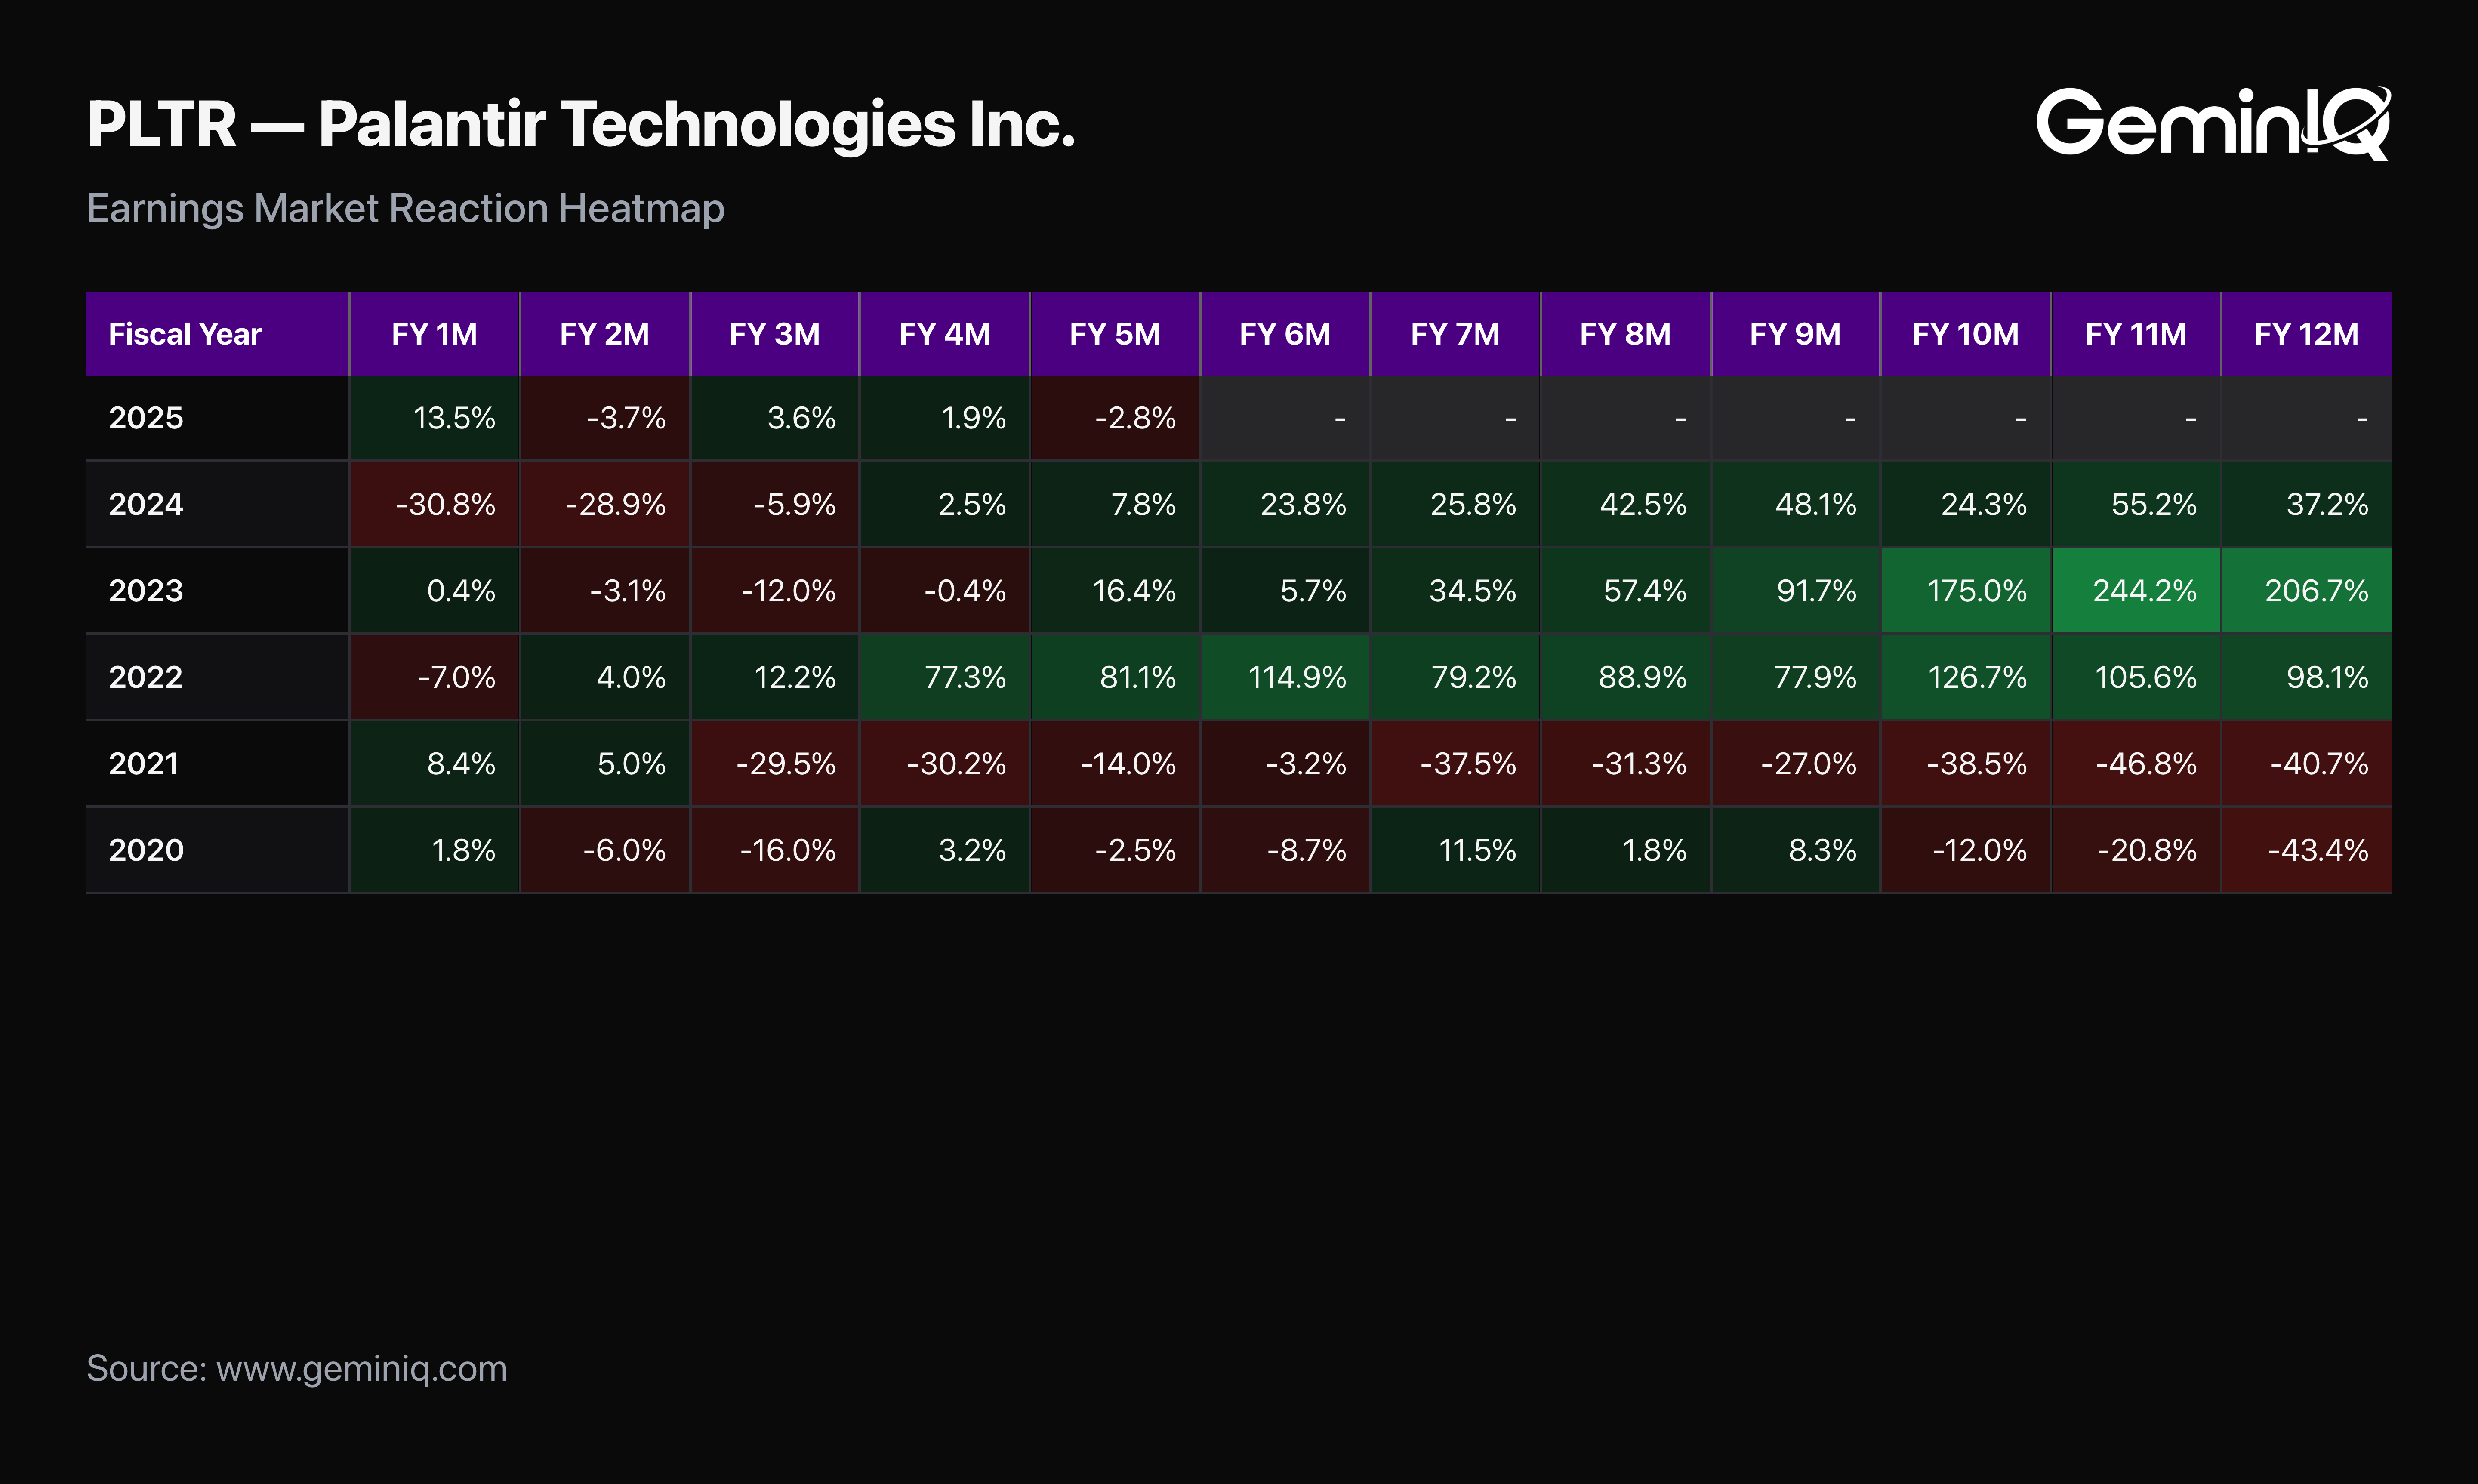
The GeminIQ Edge: Heavy insider selling at a stock up more than 900% in two years is expected and largely scheduled, and the near-total absence of buying reads as unremarkable in that context rather than as a specific signal. GeminIQ's Earnings Market Reaction Heatmap shows the stock up 13.48% one month after this 10-K was filed, then down 3.73% at two months and up 3.59% at three. The full twelve-month window has not yet elapsed.
Frequently Asked Questions
Is Palantir still diluting shareholders heavily?
Less than before. Stock-based compensation was flat at $684 Million while revenue grew 56.2%, so SBC as a share of revenue fell to 15.28% from 24.14%, and from 50.47% in FY2021. Basic shares still rose 5.3%, so dilution has decelerated sharply rather than stopped.
How profitable is Palantir now?
GAAP operating margin reached 31.59% in FY2025, up from 10.83%, on revenue of $4.48 Billion. Net income was $1.63 Billion and free cash flow was $2.10 Billion, a free cash flow margin near 47%.
What is Palantir's Rule of 40 score?
Roughly 103, combining 56.2% revenue growth with a free cash flow margin near 47%. That is more than double the 40 threshold the framework uses to identify healthy growth-stage software.
Why is Palantir's valuation controversial?
The price-to-sales ratio is 94.11 and the trailing price-to-earnings ratio is 259.2. The stock rose more than 935% in two years while revenue roughly doubled, so the multiple, not the growth, drove most of the gain.
How do I judge whether stock-based compensation is improving?
Track stock-based compensation as a percentage of revenue over several years rather than the dollar figure alone. Flat or falling SBC dollars against rising revenue means the dilution burden is shrinking, even if the raw compensation number looks large in isolation.
Palantir's most recent annual filing is a Form 10-K filed February 17, 2026, covering the fiscal year ended December 31, 2025 (FY2025).
Wall Street's data. Main Street's price.
Institutional terminals charge thousands a year for as-filed accuracy. GeminIQ gives you the same thing for a fraction of the cost: financials built directly from raw SEC EDGAR filings, not third-party APIs, with full XBRL traceability back to the original 10-K or 10-Q. No normalized guesswork, just calculated metrics, charts, screeners, and watchlists built on numbers exactly as the company reported them. Start researching now at GeminIQ.com.
All financial figures cited in this article reference Palantir Technologies Inc.'s FY2025 10-K (filed February 17, 2026, period ending December 31, 2025). All SEC filings are publicly available at SEC EDGAR.
Disclaimer: The content in this blog is for educational and entertainment purposes only and does not constitute financial, legal, or tax advice. Investing involves risk, including the loss of principal. The views expressed are my own and not intended as financial advice or a guarantee of future performance.