GARP Investing: Peter Lynch's PEG Ratio Strategy Explained
By Chad Hartman
Published June 20, 2026 · Last updated June 20, 2026
Peter Lynch ran the Magellan Fund at Fidelity from 1977 to 1990, generating approximately 29% average annual returns over that period. He did not do it by buying the cheapest stocks in the market or by chasing the fastest-growing ones. He did it by finding growth companies that were not priced for perfection — businesses expanding earnings at double-digit rates while trading at P/E multiples that did not reflect that trajectory. He called this Growth at a Reasonable Price, and the heuristic he built around it — the PEG ratio — remains the most widely cited growth-adjusted valuation tool in equity analysis. The framework is sound. The problem is the inputs. Most investors running GARP screens today are not running them on the data Lynch was using. They are running them on adjusted, normalized earnings that financial aggregators process before the figures ever reach a screening tool — and that processing changes which companies show up as GARP candidates. This guide covers how GARP investing works, where the PEG ratio breaks, and how to run the screen correctly on clean, as-filed SEC data.
Table of Contents
- What Is GARP Investing?
- The PEG Ratio: GARP's Central Tool
- GARP vs. Pure Growth vs. Pure Value
- Why Most GARP Screens Return the Wrong Results
- How to Run the GARP Screen in GeminIQ
- Reading Your Results: What to Verify Beyond the Filters
- Frequently Asked Questions
What Is GARP Investing?
Growth at a Reasonable Price is an investment philosophy that rejects the binary choice between pure growth and pure value. Lynch's argument was practical: the best companies to own are ones growing earnings consistently at high rates, but only if you are not paying an irrational premium for that growth. A company growing at 25% per year is a great business — but if investors have already priced in five years of that growth, the stock will disappoint even as the business thrives. GARP investors look for companies where the market has not yet fully recognized the growth trajectory, meaning the P/E multiple remains moderate relative to the earnings growth rate.
Lynch developed this thinking during his tenure at Magellan, and his results were extraordinary. Over 13 years, he turned an $18 million fund into a $14 billion one. The strategy was not mechanical — Lynch was a fundamentally qualitative investor who read thousands of annual reports and visited companies directly — but the PEG ratio was his numerical shorthand for filtering the investment universe down to businesses worth investigating. Any company where the growth rate substantially exceeded the P/E multiple was worth a closer look. Any company where the multiple was more than double the growth rate was, in his view, priced for perfection.
GARP is not an academic framework with a formal derivation. Greenblatt's Magic Formula has a specific ranking methodology and a documented backtest. Graham's net-net strategy has a precise NCAV formula. GARP is a heuristic — a rule of thumb that captures a reasonable intuition about how to balance growth and valuation. Its empirical record outside of Lynch's specific period is mixed, which matters. But the underlying logic — that you should receive something in return for the premium you pay for a growth company — is difficult to argue against. Strategies that fail tend to do so by ignoring either the quality of the growth or the reasonableness of the price paid for it.
The PEG Ratio: GARP's Central Tool
The PEG ratio divides the P/E Ratio by the EPS Growth Rate. Its purpose is to normalize valuation for the growth rate — making it possible to compare a company growing at 30% with one growing at 8% on a consistent basis.
Formula: PEG Ratio = P/E Ratio ÷ EPS Growth Rate (%)
Lynch's benchmarks were direct: a PEG below 1.0 indicated a company growing faster than its P/E multiple implied, which he considered an attractive entry point. A PEG above 2.0 indicated a company where the growth premium had become excessive. The intuition is simple: if a company grows earnings at 20% annually, a P/E of 20x is "reasonable" — you are paying one dollar of multiple for each percentage point of growth. A P/E of 40x for the same company is not.
Consider two companies to see why this matters in practice. Company A earns $2.00 per share, trades at $30 (P/E of 15x), and is growing earnings at 15% annually. PEG = 15 ÷ 15 = 1.0 — Lynch's fair value. Company B earns $1.00 per share, trades at $50 (P/E of 50x), and is growing earnings at 20% annually. PEG = 50 ÷ 20 = 2.5 — Lynch's danger zone. On pure growth rate, Company B wins. On P/E, Company B is far more expensive. The PEG normalizes both inputs and reveals that despite Company B's faster growth, investors are paying a substantially higher premium per unit of that growth.
The PEG ratio has three known limitations worth internalizing before applying it. First, it treats the relationship between P/E and growth as linear when compounding is nonlinear — a company compounding at 30% is not simply three times as valuable per unit of multiple as one compounding at 10% over a long horizon. Second, different implementations use different growth rate periods — trailing one-year, trailing three-year, forward consensus estimates — and that choice moves the PEG ratio substantially for individual companies. Third, and most importantly, PEG does not measure the quality or sustainability of growth. A company growing EPS at 20% through aggressive share buybacks at a stagnant business is treated identically to one growing earnings organically at 20% on rising revenue. Those are not the same investment, and the PEG ratio cannot distinguish between them. None of these limitations invalidate PEG as a screening tool. They mean it must be used as a starting point — a filter that reduces the universe — rather than a final verdict on cheapness.
GARP vs. Pure Growth vs. Pure Value
Even with those limitations, the PEG ratio does something pure growth and pure value investing both refuse to do: it forces a trade-off between price and growth instead of ignoring one of them entirely. Pure growth investing starts from the premise that the best businesses are worth owning regardless of price — that if you identify a company growing earnings at 40% annually for a decade, the returns will be exceptional no matter what multiple you paid at entry. This is correct in hindsight for the biggest secular winners. It is catastrophically wrong at peaks. When consensus already expects five years of 40% growth and discounts it into the current price, the stock becomes a hostage to growth expectations rather than growth itself. Any deceleration — even to a still-impressive 25% — produces significant multiple compression. Pure growth investors suffered this destruction during the 2000 technology bust and again during the 2021–2022 growth drawdown.
Pure value investing starts from the premise that cheap is cheap — that a company trading at 6x earnings is safer than one at 30x regardless of what those earnings are doing. The empirical support for this view is substantial over very long time horizons: the Fama-French value factor is one of the most documented return premiums in academic finance. But value investing requires patience measured in years, tolerance for multi-year underperformance that most investors do not maintain, and a willingness to systematically miss secular growth businesses that appear expensive throughout their entire compounding phase. A pure value investor applying Graham's criteria in 2012 would not have owned Apple at any point during its extraordinary subsequent run — the multiple was never cheap enough to qualify.
GARP accepts lower upside than pure growth in exchange for a valuation cushion, and accepts lower apparent cheapness than pure value in exchange for actual earnings growth. The strategy does not identify the next Amazon at 10x P/E or the next deep value turnaround at 0.5x book. What it identifies is a class of businesses growing earnings at double-digit rates that are not yet priced for perfection — companies where the multiple has room to expand as growth continues and where the downside from multiple compression is bounded by the P/E ceiling.
The evidence for GARP specifically is harder to evaluate than for pure value or pure growth, because there is no single authoritative backtest of the framework the way there is for the Fama-French factors or for Greenblatt's Magic Formula. Lynch's own record at Magellan is the primary empirical data point. It was extraordinary. But it was a single fund over a specific 13-year period, managed by a skilled stock picker who was not running a mechanical screen — GARP was his analytical instinct made explicit, not a strategy that could be passively replicated. What can be said is this: the underlying logic holds. Paying a moderate multiple for genuine, sustained earnings growth is a more defensible position than either extreme.
Why Most GARP Screens Return the Wrong Results
GARP screens are more sensitive to data quality than almost any other systematic strategy, because the central input — the earnings growth rate — is precisely where aggregator platforms diverge most from the SEC filing data.
The core issue is how "earnings" gets defined. Lynch was working with reported GAAP earnings. The EPS Growth rates he calculated came from as-filed income statements. Most aggregator platforms today use "adjusted" or "non-GAAP" EPS as the numerator — figures that strip out restructuring charges, stock-based compensation, impairment charges, and other items management would prefer analysts to set aside. Platforms rarely disclose this adjustment process, and no two aggregators apply it the same way. Two different aggregators applying their own normalization procedures to the same company's filing can produce materially different adjusted EPS figures — and therefore materially different growth rates for the same company. The GARP screen you run on an aggregator is a different screen than one running on as-filed data. The companies that appear at the top of each list are not the same companies.
This gap matters for GARP in three specific ways. First, base effects on EPS growth. A company that took a large restructuring charge in the prior year will show artificially elevated EPS Growth 1Y in the current year when measured off a depressed base — not because the business has actually accelerated, but because the prior-period figure was distorted by a one-time event. Aggregators applying adjusted EPS eliminate this base effect, smoothing the growth rate toward something that looks more like the underlying business trajectory. GeminIQ's EPS Growth is computed from as-filed GAAP EPS, which preserves the base. That is not a bug — it is the feature. Checking the absolute EPS figure over multiple periods, not just the one-year growth rate, is how you distinguish a genuine compounder from a base-effect mirage.
Second, buyback-driven EPS growth. A company shrinking its share count through aggressive buybacks can show double-digit EPS Growth with flat or even slightly declining Net Income Growth. The EPS figure rises as fewer shares divide the same earnings pool. This is real in an accounting sense, but it is a fundamentally different kind of growth than a company expanding revenue and margins. The Net Revenue TTM Growth 1Y filter in GeminIQ's GARP screen addresses this directly: requiring revenue growth above 5% ensures the top line is actually expanding, not just the per-share math. A standard screener running on normalized data may apply this filter too, but against a revenue figure that has itself been reclassified or smoothed. GeminIQ's Revenue Growth uses as-filed revenue from the SEC filing — the unprocessed number.
Third, revenue recognition reclassifications. Companies that adopted ASC 606 — the updated revenue recognition standard — in 2018 and 2019 often showed apparent revenue growth or decline in the transition year that reflected an accounting reclassification rather than a genuine change in business volume. Platforms that normalized revenue templates to smooth the transition show continuity in the revenue series where the as-filed data shows a step change. GeminIQ's data follows the as-filed figures, which means the transition period is visible and traceable — exactly the kind of data hygiene that matters when revenue growth is functioning as a quality filter on an earnings-driven screen.
Standard financial media applies these adjustments so routinely that most investors do not know they exist. The inputs to the PEG ratio look clean. They are not.
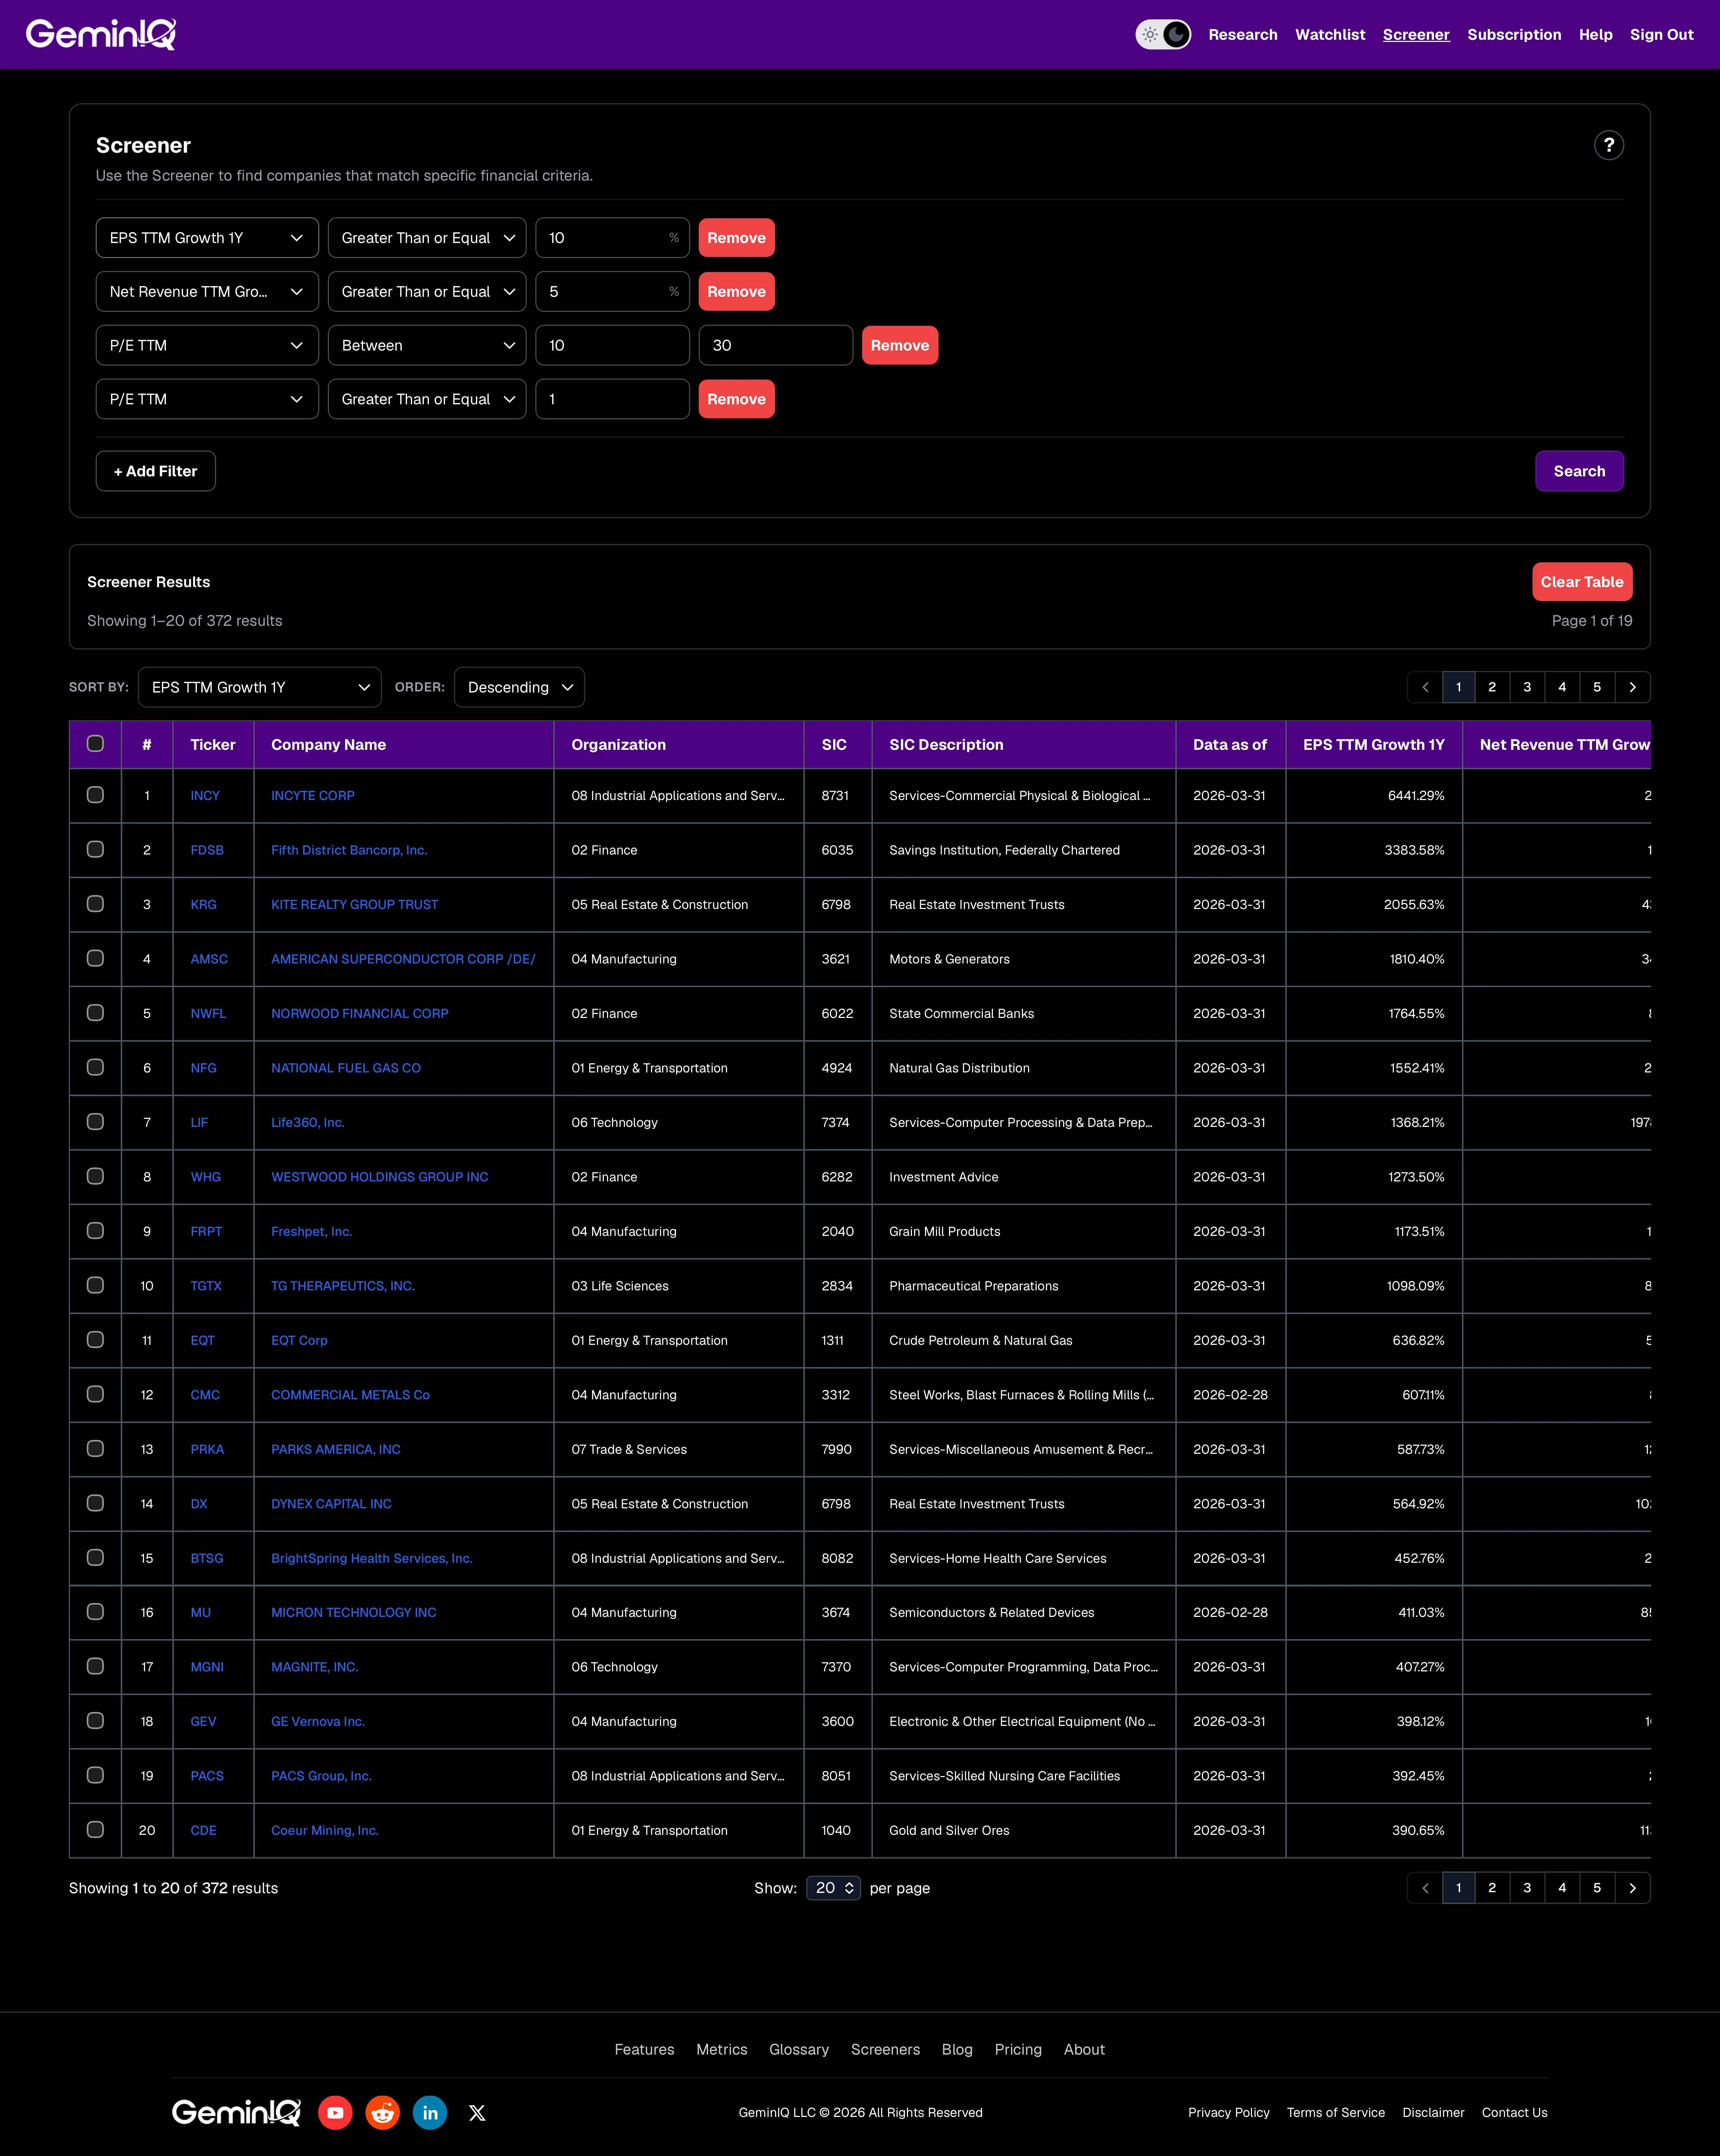
How to Run the GARP Screen in GeminIQ
GeminIQ's pre-configured GARP Screener runs all four filters simultaneously on data extracted directly from XBRL-tagged SEC EDGAR filings. Open the screener and confirm the following filters are active:
| Filter | Operator | Value |
|---|---|---|
| EPS TTM Growth 1Y | ≥ | 10% |
| Net Revenue TTM Growth 1Y | ≥ | 5% |
| P/E TTM | between | 10 and 30 |
| P/E TTM | ≥ | 1 |
The 10% EPS growth floor reflects Lynch's minimum threshold — he was not interested in businesses growing at 3% regardless of how moderate their P/E appeared. The 5% revenue growth floor is the buyback check: it screens out companies where the entire EPS growth story is coming from share count reduction rather than business expansion. The P/E range of 10x to 30x captures Lynch's "reasonable price" zone — a floor at 10x screens out businesses in structural distress where the low multiple reflects genuine impairment, and a ceiling at 30x enforces valuation discipline against businesses where years of future growth are already priced in. Set the Sort By to EPS TTM Growth 1Y, direction Descending, so the fastest-growing companies within the GARP valuation band appear first.
For investors focused on longer-duration compounders — companies sustaining growth across multiple years rather than a single strong period — add one additional filter:
| Filter | Operator | Value |
|---|---|---|
| EPS TTM Growth 3Y | ≥ | 8% |
This requires the trailing three-year earnings growth rate to also be positive and meaningful. A company posting 20% EPS growth in the most recent year but −5% over three years is recovering from a bad period, not sustaining a compounding trajectory. The three-year filter distinguishes between them.
GeminIQ Tip: The PEG ratio is not a native screener field, but it takes seconds to calculate manually from the results. Take the P/E TTM figure and divide it by EPS TTM Growth 1Y for each company in the Custom Tables view. A P/E of 20x with 20% growth = PEG of 1.0. A P/E of 25x with 12% growth = PEG of 2.1 — outside Lynch's preferred zone. This manual calculation identifies which screener results are genuinely within Lynch's PEG target range and which are sitting at the edges.
Reading Your Results: What to Verify Beyond the Filters
The screener returns a filtered universe. What it cannot do is evaluate whether the growth is real, durable, and of the quality Lynch was looking for. That evaluation requires pulling each company's data and asking several specific questions.
The first question is whether revenue and earnings growth are moving in the same direction. A company posting 15% EPS growth with 6% revenue growth is expanding margins — which is a positive sign, but finite. Margin expansion cannot continue indefinitely. A company posting 15% EPS growth with 18% revenue growth is expanding the business itself, which is a more durable foundation. GeminIQ's Financial Statements view shows both trends across multiple filing periods simultaneously.
The second question concerns the absolute EPS trajectory, not just the one-year growth rate. A company that earned $0.20 per share three years ago, $0.50 two years ago, and $1.00 last year is a different story than one that earned $4.00, fell to $0.30 after a large impairment, then recovered to $0.50. Both could show high one-year EPS growth rates. They are not the same investment. GeminIQ's Calculated Metrics panel shows EPS Growth across one-year, three-year, and five-year periods simultaneously, making the trajectory visible without building a spreadsheet.
The third question is the share count trend. Pull GeminIQ's Financial Statements and check Basic Shares Outstanding across the last eight quarters. If the share count is declining by 5–10% annually, a meaningful portion of the EPS growth is coming from buybacks rather than operational expansion. That is not automatically disqualifying — Lynch owned companies doing buybacks — but it changes the character of the growth story and should affect how you weight the EPS growth figure in your manual PEG calculation.
The fourth question is whether the current growth rate is sustainable. The P/E ceiling at 30x limits the damage if growth decelerates, but it does not eliminate it. A company at 28x P/E growing at 15% has a PEG of 1.87 — acceptable. If growth decelerates to 8%, the PEG recalculates to 3.5 and the multiple will compress significantly. Understanding whether the drivers of growth are cyclical, structural, or tied to a single product cycle is the qualitative judgment no screen can make. Lynch's differentiation was his ability to evaluate growth durability, not just identify companies with current growth. The GeminIQ screen gets you to the right starting list. The work of verifying quality happens in the Financial Statements view, one company at a time.
Frequently Asked Questions
What is a good PEG ratio?
Peter Lynch considered a PEG below 1.0 attractive — the company is growing earnings faster than its P/E multiple implies. A PEG between 1.0 and 2.0 is generally considered fair value for a growth company. Lynch treated a PEG above 2.0 as a signal that the stock is priced for perfection, meaning continued high execution is required to justify the current valuation at any growth rate that appears. These thresholds are heuristics, not hard rules — they should be evaluated alongside the quality and sustainability of the growth and the strength of the underlying balance sheet.
Is GARP investing still viable today?
The GARP framework is viable, but the size of the investable universe narrows and widens with market conditions. In periods when growth stocks broadly command elevated multiples, finding companies that clear both the 10% growth floor and the 30x P/E ceiling simultaneously becomes harder. The screener result count reflects this directly. In periods of broader multiple compression — as happened in 2022 — the GARP universe expands as growth companies reprice toward more moderate valuations. The framework does not stop working; the available candidates change. When the screener returns a small universe, that is itself a signal about market pricing, not a failure of the methodology.
What is the difference between GARP and the Magic Formula?
Both strategies combine a growth or quality element with a valuation element, but they use different metrics and different logic. GARP uses the P/E ratio as the valuation input and earnings growth rate as the quality input, combined via the PEG ratio. Greenblatt's Magic Formula uses EV/EBIT as the valuation input and Return on Invested Capital as the quality input, combined via composite ranking rather than division. GARP is focused on growth trajectory; the Magic Formula is focused on capital efficiency at a cheap price. They surface materially different companies. A business with high ROIC and low EV/EBIT will appear in the Magic Formula results; if it has slow earnings growth, it will not appear in GARP results. Understanding what each screen selects for is how you use them effectively together.
Does GeminIQ calculate the PEG ratio directly?
GeminIQ does not include a native PEG ratio filter in the screener, because the PEG is most useful as a calculation performed on the filtered output rather than as a filter itself. The GARP screen's P/E and EPS growth filters implicitly constrain the PEG range: a company clearing the 10% growth floor with a 30x P/E ceiling has a maximum possible PEG of 3.0, and a company growing at 25% with a P/E of 15x has a PEG of 0.6. The manual calculation — P/E TTM ÷ EPS TTM Growth 1Y — takes seconds in GeminIQ's Custom Tables view. What takes longer, and matters more, is making sure the P/E and growth figures feeding that calculation came from the filing rather than from someone else's adjustments.
Related Reading
- Magic Formula Investing Explained — Greenblatt's strategy uses Return on Invested Capital and EV/EBIT earnings yield rather than PEG-based growth, offering a complementary systematic approach for identifying quality businesses at cheap prices.
- Buffett Stock Criteria: Quality Business at a Fair Price — Buffett's framework, like GARP, cares about growth sustainability and capital efficiency, but applies a qualitative overlay that Lynch's quantitative PEG ratio does not capture.
- Free Cash Flow Yield Explained — FCF yield pairs naturally with GARP because it tests whether earnings growth is producing actual cash generation. A GARP candidate with high EPS growth but deteriorating FCF yield deserves additional scrutiny.
- Piotroski F-Score: The Value Trap Filter — the nine-point financial health checklist is a useful overlay on any screener output, including GARP results, to eliminate companies passing quantitative filters despite deteriorating fundamentals.
- EV/EBITDA vs. P/E: Which Multiple to Use — P/E is GARP's primary valuation tool, but understanding its limitations — and when EV/EBIT or FCF yield provides a cleaner picture — makes the full GARP analysis more reliable.
- Value Investing Glossary — plain-English definitions of every metric referenced in this post, including PEG ratio, P/E, earnings growth, and ROIC.
Research Faster. Invest Smarter.
Most financial websites rely on third-party aggregators that simplify or process data before you ever see it. We built GeminIQ because we believe you deserve a better fundamental analysis tool—one that goes beyond basic price charts and processed numbers. We extract our data directly from SEC 10-K and 10-Q filings to ensure that when you look at a balance sheet or a cash flow statement, you are seeing the numbers exactly how the company reported them. Our goal is to give you the tools to verify the narrative for yourself using clean, traceable data. Start researching now at GeminIQ.com.
Disclaimer: The content in this blog is for educational and entertainment purposes only and does not constitute financial, legal, or tax advice. Investing involves risk, including the loss of principal. The views expressed are my own and not intended as financial advice or a guarantee of future performance.