
Deep Value vs. Quality Investing: Which Wins and When

By Chad Hartman
Published · Last updated
The investment industry frames deep value and quality investing as competing philosophies — as if choosing one means rejecting the other permanently. The academic record does not support that framing. Both approaches have documented, positive excess returns over long periods. Both have also produced multi-year stretches of significant underperformance. What separates investors who use these strategies effectively from those who don't is not which camp they belong to — it is whether they understand what conditions activate each strategy's edge. Deep value outperforms when interest rates are high or rising, valuation spreads between cheap and expensive stocks are wide, and cyclical businesses trade at trough earnings multiples. Quality outperforms when rates are low or falling, economic growth is scarce, and investors pay a premium for earnings visibility and durable compounding. The investor who reads these conditions correctly and reaches for the right screen has a systematic edge over one who commits permanently to either side. GeminIQ's Deep Value Screener and Quality Compounder Screener surface fundamentally different universes of companies — and knowing when to use each one is the analytical question this post answers.
Table of Contents
- The Logic Behind Deep Value Investing
- The Logic Behind Quality Investing
- The Four Market Regimes That Determine the Winner
- What Aggregator Data Gets Wrong in Each Screen
- How to Run Both Screens in GeminIQ
- Reading the Results: Beyond the Filter Numbers
- Frequently Asked Questions
- Related Reading
The Logic Behind Deep Value Investing
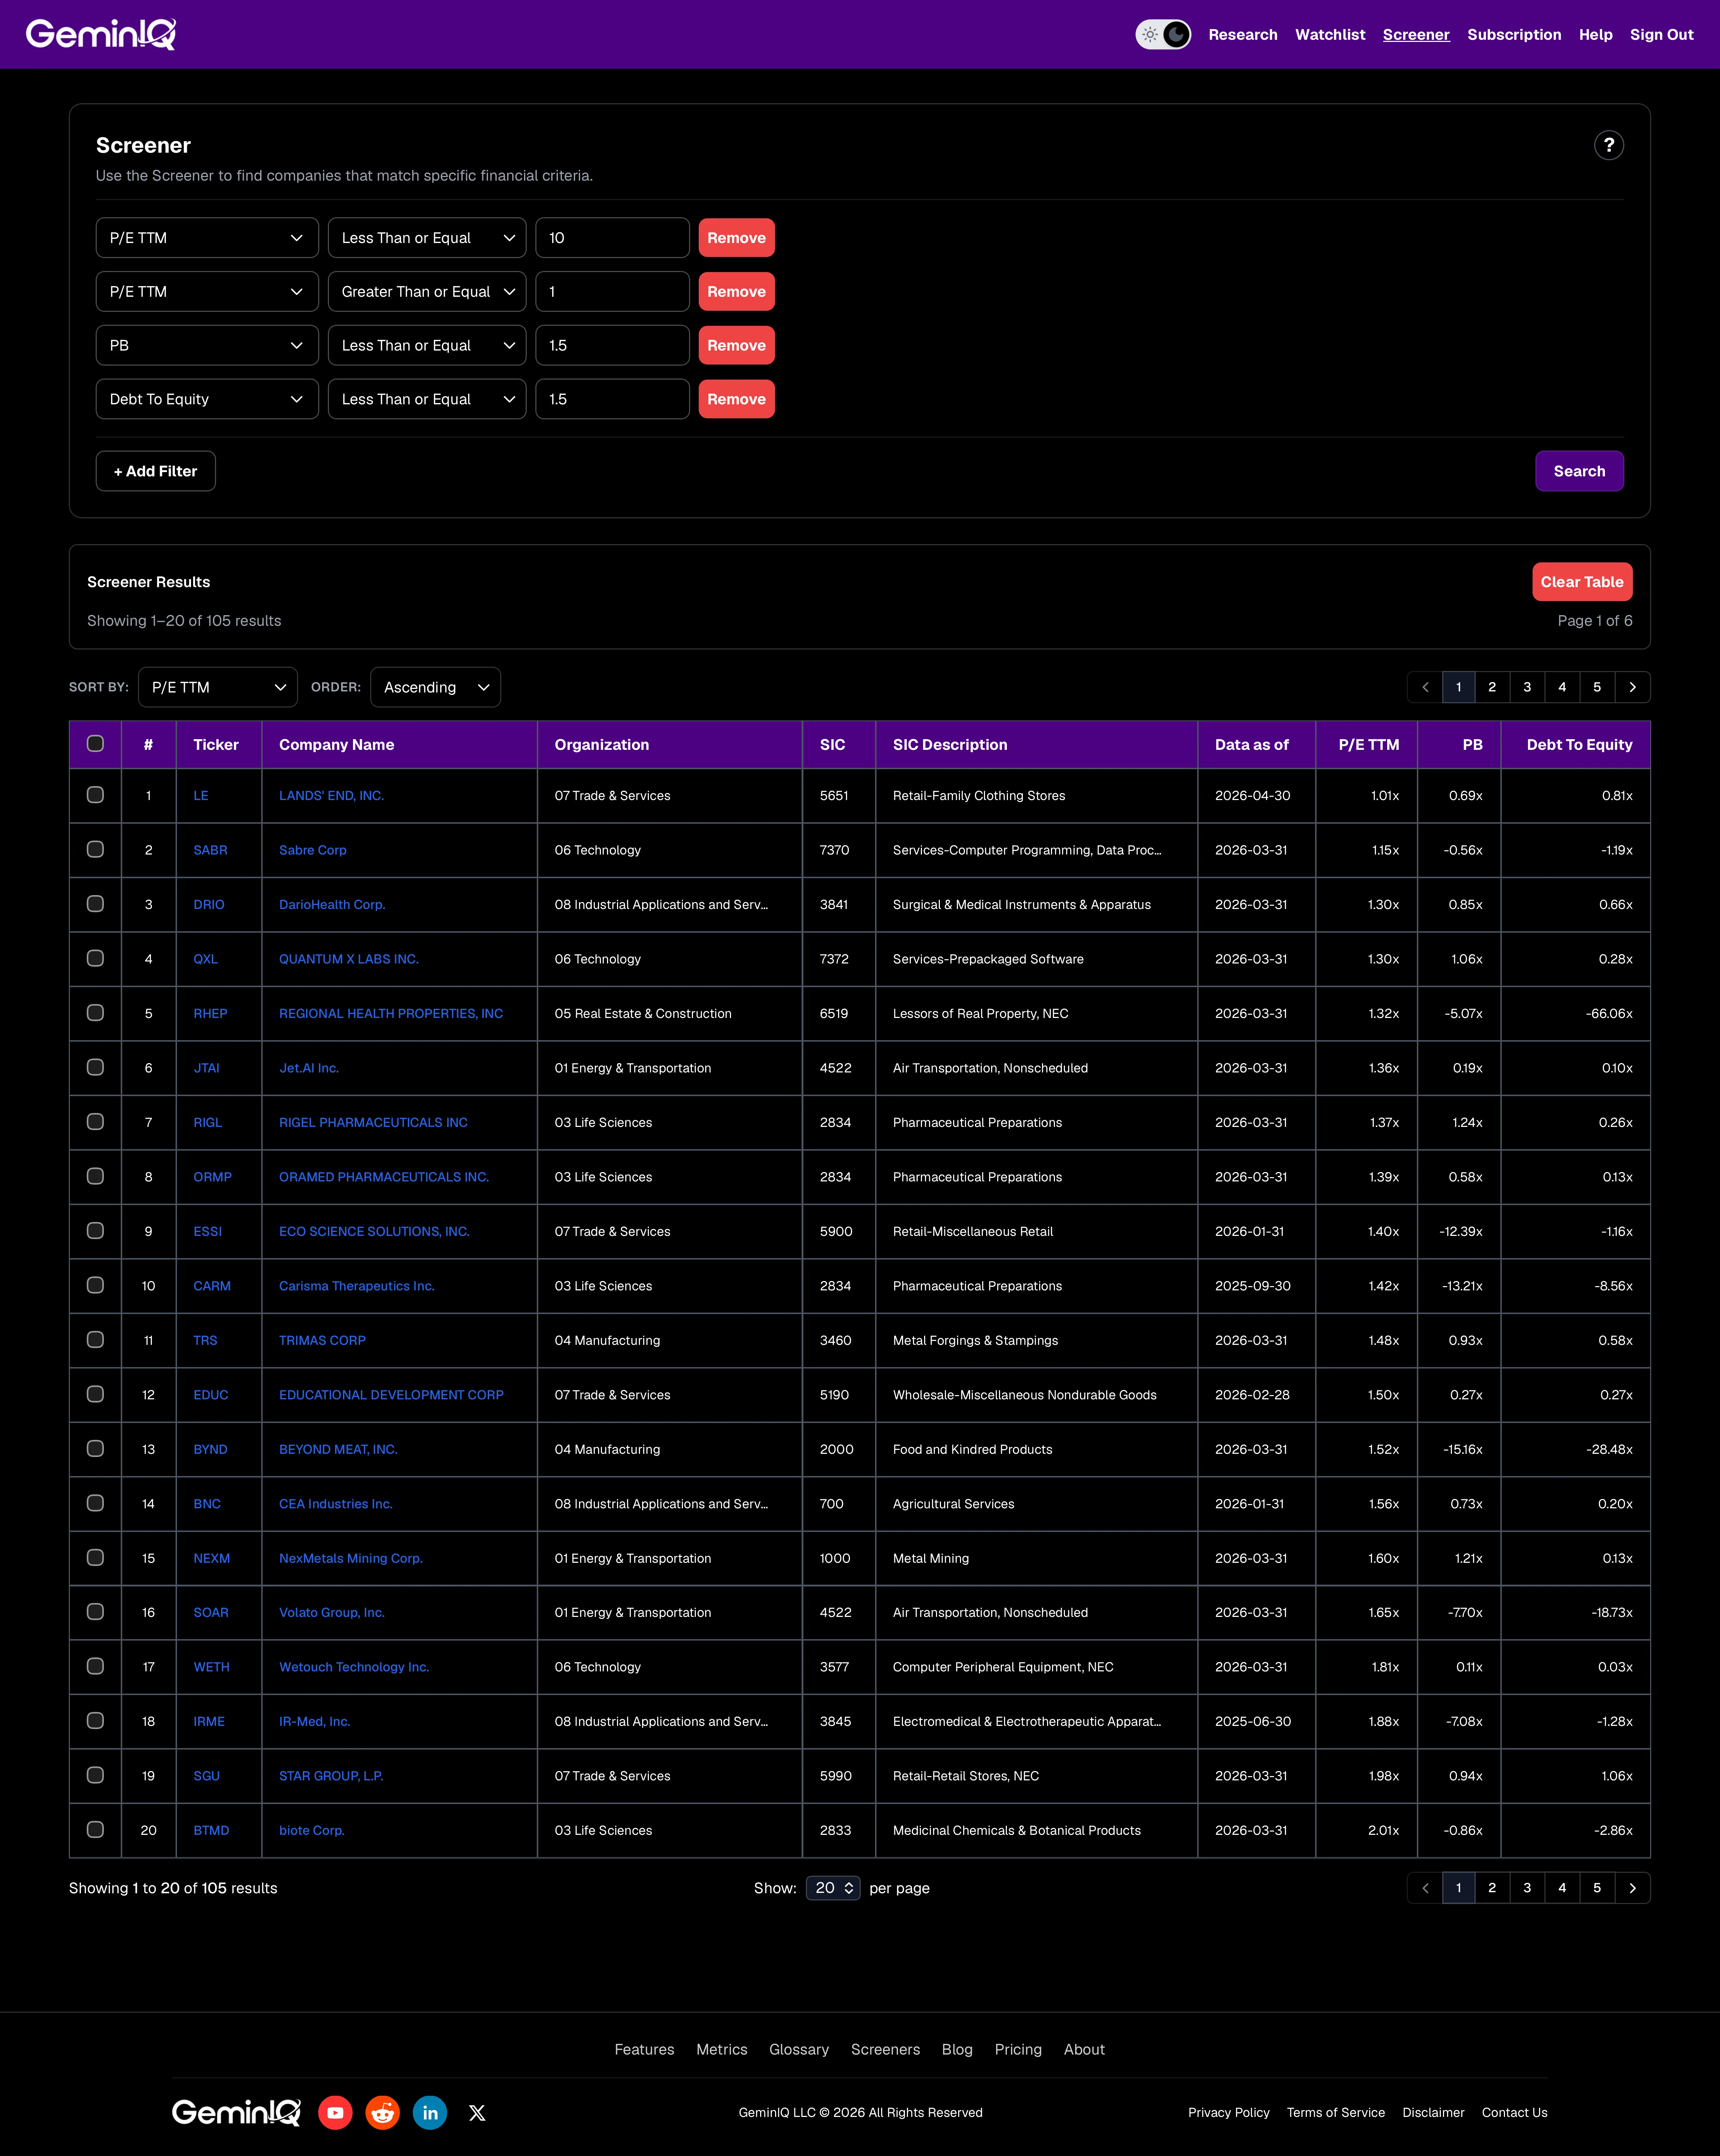
Deep value investing measures the gap between what the market is willing to pay for a business today and what that business actually earns or owns. Benjamin Graham's foundational proposition was that this gap is exploitable: when the market prices a security below its intrinsic value, a disciplined investor who buys at a sufficient discount — the margin of safety — earns above-average returns as price eventually converges toward value. The simplest implementation targets two metrics: Price-to-Earnings Ratio and Price-to-Book Ratio. GeminIQ's Deep Value Screener operationalizes this with four filters: P/E at or below 10, P/B at or below 1.5, Debt-to-Equity Ratio at or below 1.5, and a P/E floor of 1 to exclude loss-making businesses that appear cheap only because their earnings are negative.
The academic evidence for deep value is substantial and long-running. Fama and French's 1992 and 1993 research documented what became the value factor — the systematic tendency of low P/B stocks to outperform high P/B stocks over long periods, observed across nearly a century of US data and replicated across international markets. The value premium has averaged roughly 4–5% per year over the long term, though this figure conceals enormous variance across decades. The value factor was notably weak from approximately 2007 through 2021, underperforming growth strategies by wide margins for fourteen consecutive years — the longest such drought in the historical record.
The structural explanations for that underperformance are real: declining interest rates made terminal value more important in business valuation, rewarding growth over cheapness; the rise of platform-economy businesses with few tangible assets made price-to-book a less meaningful signal; and the intangibles-heavy composition of the modern economy eroded the relevance of asset-based valuation frameworks. None of these explanations mean deep value is permanently broken. They mean its edge concentrates in specific conditions — and those conditions do return.
Deep value candidates surface naturally in cyclical industries: energy, basic materials, traditional manufacturing, and regional banking, where earnings fluctuate dramatically with commodity prices and economic cycles. A company trading at 7× trailing earnings may be there because its earnings are at a temporary cyclical trough that will reverse — or because its core business model is in structural decline. Distinguishing between these two cases is the core analytical task, and it requires the trend data that raw SEC filings make available. For a systematic overlay that adds nine fundamental quality tests to a basic value screen, the Piotroski F-Score framework is the most widely used tool for separating genuine deep value candidates from value traps.
The Logic Behind Quality Investing
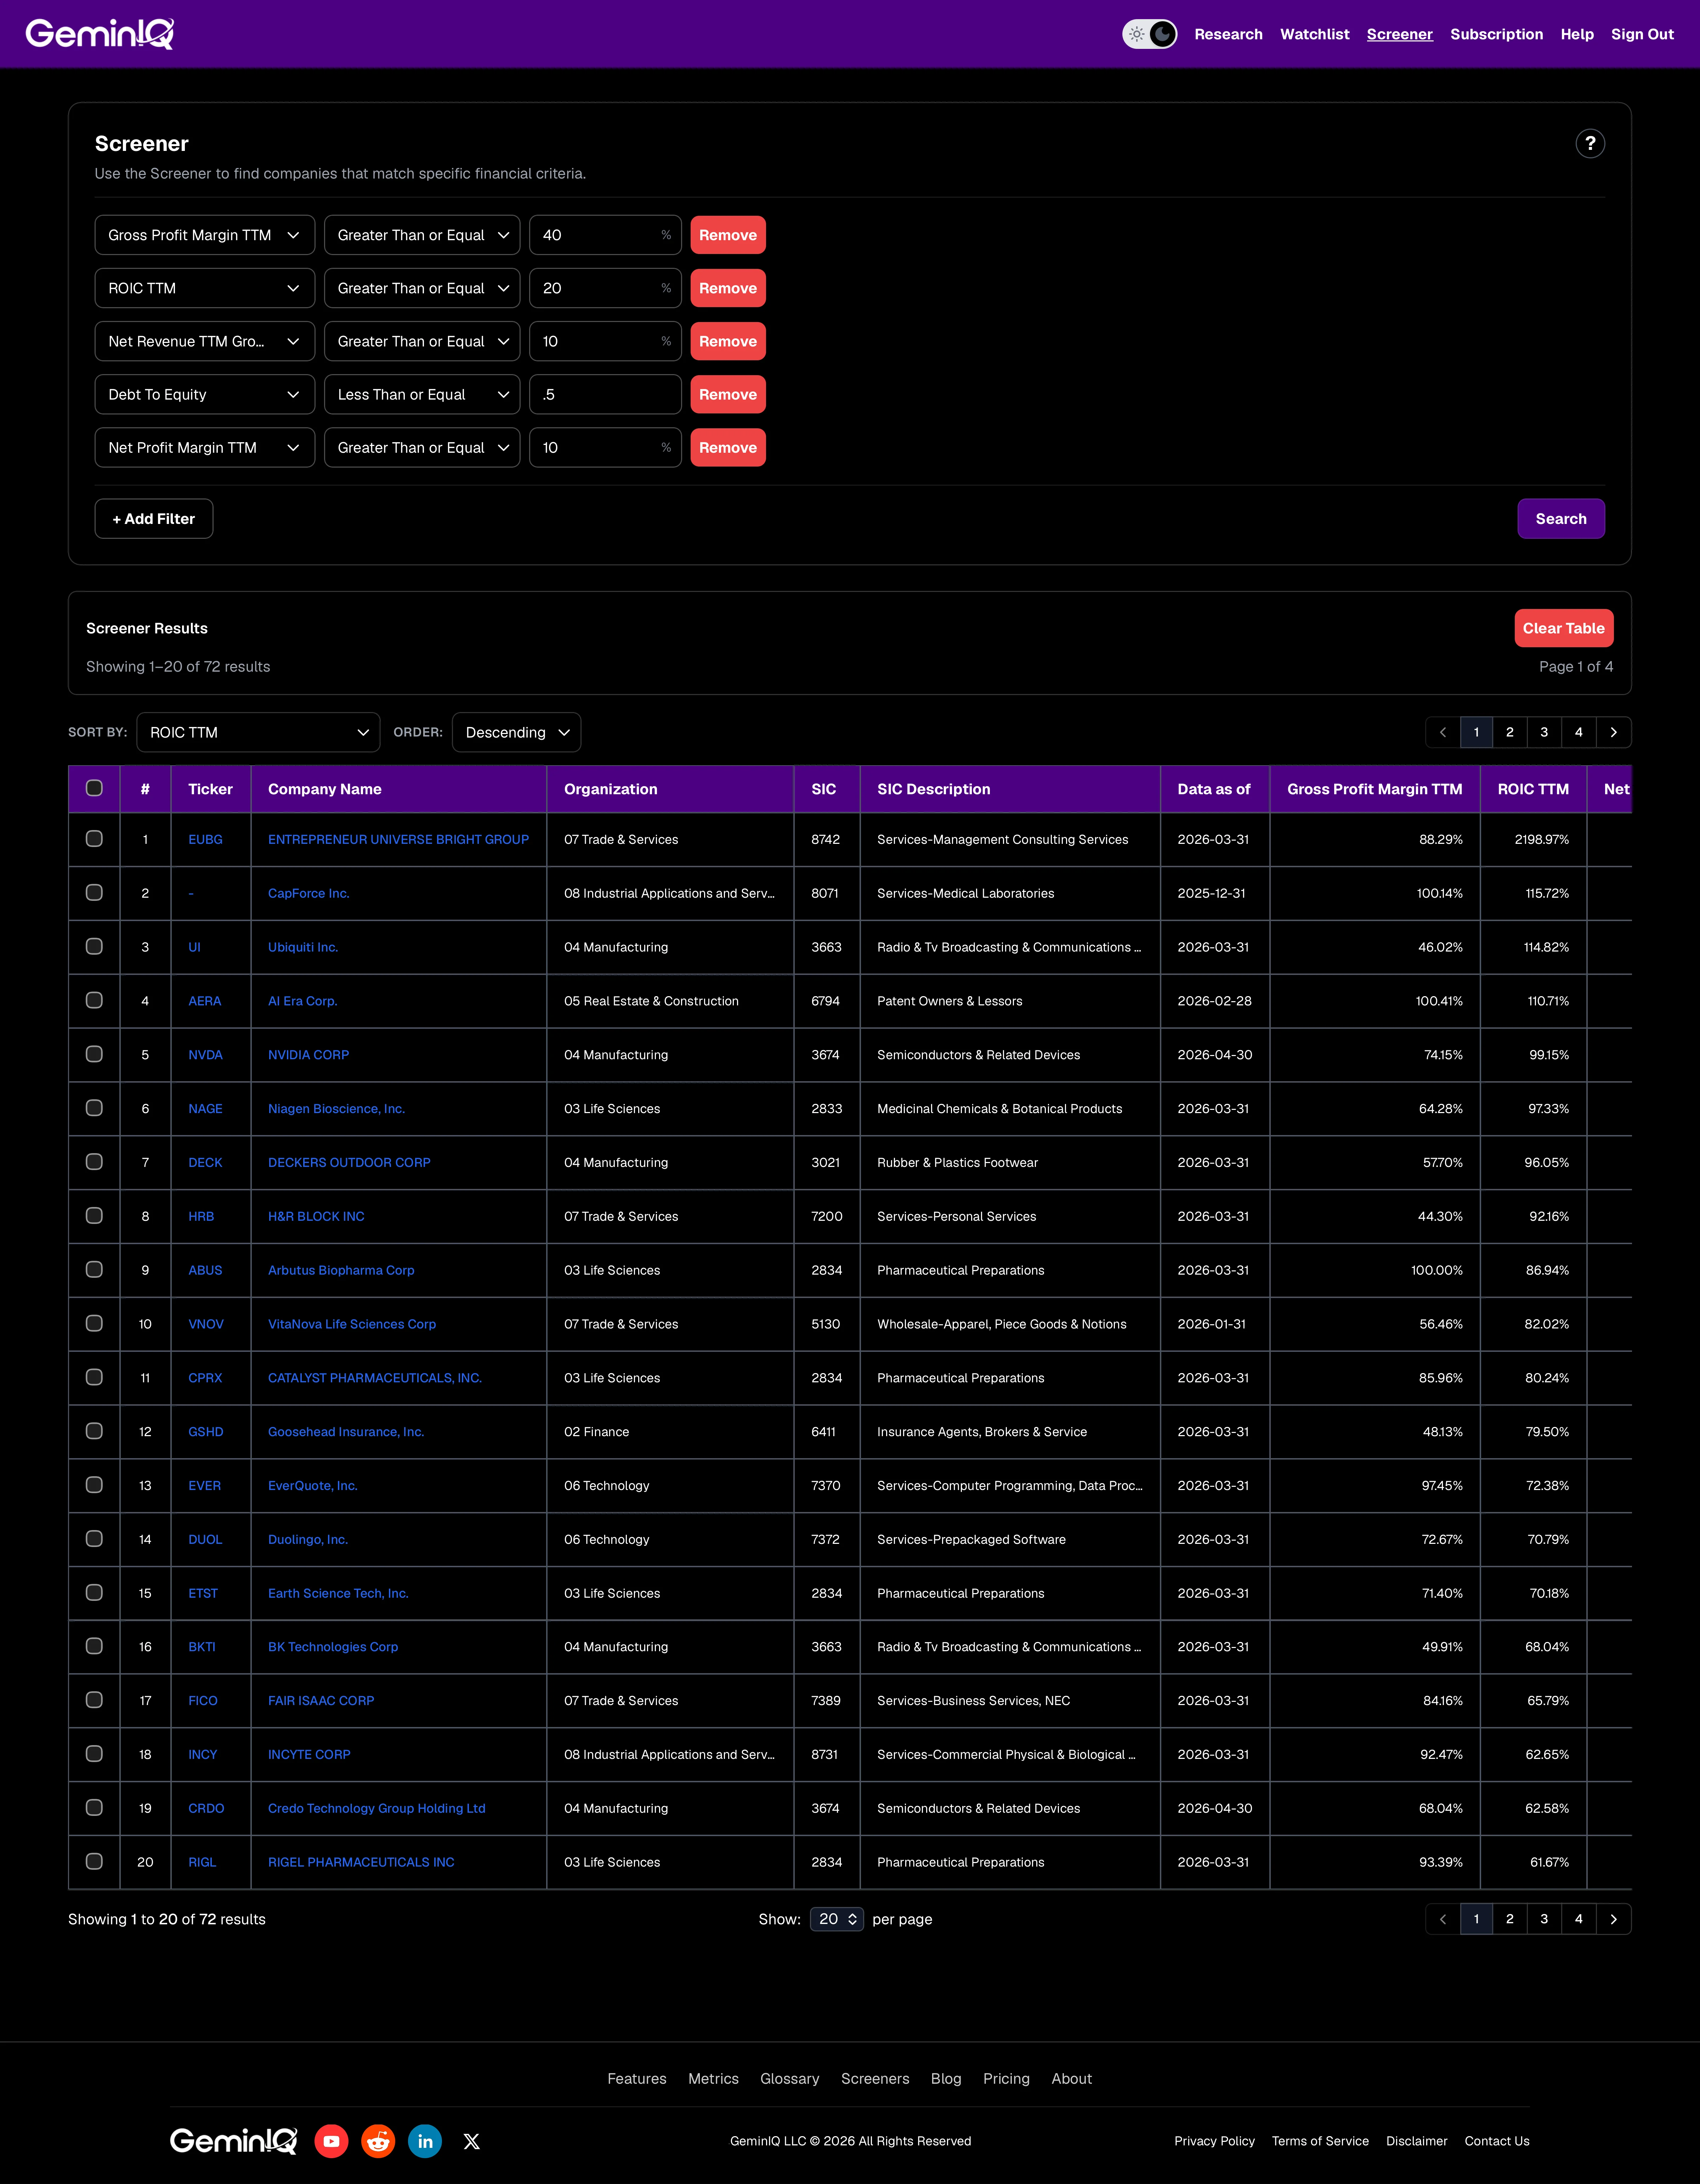
Quality investing targets a different dimension of return entirely. Rather than buying businesses at a discount to what they are worth today, it buys businesses that will be worth dramatically more in the future — because they earn high returns on the capital they deploy and can reinvest those earnings at similarly high rates for extended periods. GeminIQ's Quality Compounder Screener defines this category through five filters: Gross Profit Margin at or above 40%, Return on Invested Capital at or above 20%, Revenue Growth (3-year) at or above 10%, Debt-to-Equity at or below 0.5, and Net Profit Margin at or above 10%.
The academic evidence for the quality factor is more recent than the value literature but equally robust. AQR's work on the Quality Minus Junk (QMJ) factor demonstrated that stocks with high profitability, stable growth, low financial risk, and high payout ratios systematically outperform low-quality stocks — a premium that held across 24 international markets through nearly three decades of data. The quality premium has averaged roughly 4–6% per year, with notably lower volatility than the value premium, because quality businesses tend to have more defensible earnings through contractions.
The compounding math is what makes quality investing structurally different from simple growth investing. A business earning 20% ROIC and reinvesting 80% of its earnings at that same rate grows its earnings base at 16% annually. Over fifteen years, that compounds the earnings capacity of the business by roughly 9×. The variable that separates a genuine compounder from a temporarily exceptional business is not the current ROIC — it is how long the business can sustain that return as competition responds. A business maintaining 20% ROIC for fifteen years creates far more value than one earning 35% ROIC for three years before competitors erode the margin. For a deeper treatment of the compounding math and how ROIC stability distinguishes genuine compounders from mean-reverting businesses, see Quality Compounder Investing: Philosophy, Criteria, and Screener.
Quality compounders almost never appear in deep value screens. The market recognizes exceptional economics and prices them accordingly. A genuine quality compounder typically trades at P/E multiples of 20×, 30×, or higher — which means it fails every deep value filter by a wide margin. This is not a screening error; it is the market correctly pricing the expectation of long-duration compounding. The analytical challenge for quality investors is not finding businesses that are cheap on current metrics but distinguishing businesses where the premium is justified by durable competitive advantage from ones where the premium reflects an advantage that has already peaked.
The Four Market Regimes That Determine the Winner
The performance divergence between deep value and quality investing tracks identifiable macroeconomic conditions with enough regularity to be analytically useful. Four regimes account for most of the observed variation.
Rising Rates and Inflation: When Deep Value Leads
Higher interest rates compress the present value of distant cash flows — and quality compounders' business cases are built almost entirely on cash flows far in the future. A business worth 30× earnings when the risk-free rate is 1% may justify only 15× earnings when the risk-free rate is 5%. The math is direct: higher discount rates shrink terminal value, and terminal value is where most of a quality compounder's investment case lives. Deep value candidates are far less sensitive to this compression because their investment case rests on near-term earnings power, not a projection fifteen years forward.
The 2022–2023 rate cycle produced the clearest recent demonstration. The Federal Reserve raised rates from near-zero to over 5% in fourteen months. Technology-heavy quality businesses that had traded at extreme multiples compressed sharply as the discount rate repriced their terminal value. Energy, commodity, and industrial companies — the natural habitat of deep value screens — outperformed significantly as inflation lifted their near-term earnings.
Falling Rates and Low Growth: When Quality Leads
The inverse holds. When rates fall, terminal value becomes more valuable in present-value terms, which benefits long-duration earnings streams directly. When economic growth is scarce, investors pay a premium for businesses that grow reliably regardless of the macro environment — and quality compounders with structural revenue growth and high margins are the most defensible source of that growth. The 2010–2021 period combined both tailwinds simultaneously: rates fell toward zero, broad economic growth was modest, and businesses with structural recurring revenue became worth more with every rate cut. The result was fourteen years of quality outperforming value — not because deep value was broken, but because the rate environment made the quality premium rational.
Post-Recession Recovery: When Deep Value Catches Up
Early economic recoveries produce sharp mean-reversion in the most beaten-down cyclical stocks — the natural occupants of deep value screens. Energy producers, industrials, and regional financials that compressed to low multiples during a recession recover fastest in the early expansion phase, because their earnings rebound is most dramatic from trough levels. The 2009–2011 recovery and the 2020–2021 pandemic-exit recovery both produced outsized returns for deep value candidates in their first twelve months. Quality businesses compounded through both recoveries without interruption. They did not, however, produce the same magnitude of near-term price appreciation, because they hadn't suffered the same magnitude of prior compression.
Late-Cycle and High Uncertainty: When Quality Holds
Late in an expansion, when recession risk rises and earnings visibility deteriorates, investors rotate toward defensibility. Quality compounders — high margins, recurring revenue, zero or minimal net debt, and demonstrated consistency across cycles — outperform because the earnings stream investors are paying for is less likely to disappoint. The late-cycle quality premium reflects a simple risk preference: investors will pay more for an earnings dollar they are confident they will actually receive. Deep value candidates face the opposite dynamic — their trough-earnings argument requires a recovery that a slowing economy is increasingly unlikely to deliver on schedule. Neither screen is superior in the abstract. Market regime determines which one is the right tool to hold.
What Aggregator Data Gets Wrong in Each Screen
Both screens are acutely sensitive to how the underlying metrics are calculated — and this is where normalized, aggregator-adjusted data introduces systematic error in opposite directions.
For deep value screens, the critical distortion is earnings normalization. The Price-to-Earnings Ratio is only as useful as the earnings figure beneath it. Most financial data platforms substitute "adjusted" earnings for GAAP net income, stripping out restructuring charges, impairment charges, acquisition costs, and litigation settlements as "non-recurring." A company with a P/E of 8× on as-filed GAAP net income might show 16× on the adjusted figure once recurring "one-time" charges are removed. GeminIQ calculates P/E from the net income figure as-filed with the SEC — the legally reported number, and the basis on which the foundational academic value research was originally conducted. When the deep value screener surfaces a company at 7× earnings, that multiple reflects what the company actually reported, not what management chose to emphasize in the earnings release.
For quality screens, the critical distortion is ROIC calculation methodology. Third-party platforms frequently compute Return on Invested Capital using a statutory 21% tax rate rather than the company's actual effective tax rate, strip goodwill from invested capital to inflate apparent returns, and exclude stock-based compensation from NOPAT to overstate after-tax operating profit. Each choice makes ROIC appear higher than it is. A quality compounder that screens at 25% ROIC on GeminIQ earned that return on the actual invested capital base at the actual tax burden the company bore in the filing period. On an aggregator platform using normalized inputs, the same company might show 32% ROIC — a figure with no basis in the document filed with the SEC.
The practical consequence runs in both directions. A deep value screen built on adjusted earnings surfaces companies that look cheaper than they are, inflating the apparent opportunity. A quality screen built on normalized ROIC surfaces companies that look better than they are, understating the durability risk. Both errors produce conclusions built on numbers the company never actually reported. GeminIQ uses as-filed figures because that is what the academic research was built on, and it is the only version of the data that is legally traceable to the source document.
How to Run Both Screens in GeminIQ
GeminIQ's Deep Value Screener requires four filters applied through the Stock Screeners feature: Price-to-Earnings Ratio TTM ≤ 10, Price-to-Earnings Ratio TTM ≥ 1 (the floor that removes companies with negative earnings from results), Price-to-Book Ratio ≤ 1.5, and Debt-to-Equity Ratio ≤ 1.5. Set the sort to P/E ascending to surface the cheapest earnings multiples first. The resulting universe will concentrate in cyclical sectors — energy, materials, industrials, regional financials — and the sector composition matters as much as the individual results. A screen dominated by energy companies during a commodity price peak is a very different analytical situation than the same screen populated during a multi-year commodity trough.
GeminIQ's Quality Compounder Screener requires five filters: Gross Profit Margin TTM ≥ 40%, Return on Invested Capital TTM ≥ 20%, Revenue Growth 3Y ≥ 10%, Debt-to-Equity Ratio ≤ 0.5, and Net Profit Margin TTM ≥ 10%. Set the sort to ROIC descending to surface the highest-return businesses first. The result set will be small — this screen is designed to return a handful of candidates, not a long list. For highest-conviction work, a Revenue Growth 5Y ≥ 8% filter confirms that growth has been sustained over a longer horizon rather than driven by a recent three-year surge. The companies that clear every filter across both the 3-year and 5-year growth thresholds represent the narrowest, most defensible end of the quality universe.
Reading the Results: Beyond the Filter Numbers
Running either screen is the beginning of the research process, not the end of it. The filter numbers identify candidates; the trend behind those numbers determines whether the candidate is genuine.
For deep value results, the critical question is whether the current low multiple reflects a cyclical trough already reversing or a secular earnings decline with no floor in sight. GeminIQ's Visualizations view lets you chart revenue and net income across twelve or more quarters for any result in the screen. A company showing 7× P/E because earnings dropped sharply last year but had been stable or growing for the five years prior is a different research question than one where earnings have declined for three consecutive years and every quarterly filing shows a lower run rate. The trailing multiple cannot distinguish between those two companies. The trend can.
For quality results, the defining check is ROIC stability over time — not just the current level. GeminIQ's Calculated Metrics trend view plots ROIC across quarters, which immediately reveals whether a 20% ROIC business has been compounding at that level for years or declining toward it from a higher peak. A business that showed 40% ROIC three years ago and now shows 20% is not a compounder — it is a business under competitive pressure, and its current multiple likely still prices in economics it no longer has. The business that showed 18% ROIC three years ago and now shows 22% is building a moat, not losing one. Both pass the screen on the current number. Only the trend reveals which is which.
The second quality check is stock-based compensation as a fraction of revenue. High-ROIC businesses often distribute significant value through equity compensation, which is a non-cash expense but represents real economic dilution. A business with 25% ROIC and stock compensation running at 15% of revenue has a fundamentally different economic picture than one with 25% ROIC and 2% stock compensation — the first is paying its employees far more than the income statement suggests. The screen treats them identically. The filing does not.
Frequently Asked Questions
Which strategy is better for long-term investors?
Neither approach dominates over all time periods in isolation. The Fama-French value factor and AQR's quality factor both document roughly 4–6% annual excess returns over long horizons — but they underperform in different conditions and for different durations. Long-term investors who are regime-aware and willing to operate both screens systematically have historically achieved better risk-adjusted outcomes than those who commit permanently to either approach alone.
Can a stock appear in both screens simultaneously?
Rarely. Genuine quality compounders earning 20%+ ROIC with 40%+ gross margins almost never trade at P/E multiples below 10 or P/B ratios below 1.5 — the market prices exceptional economics into the stock. The intersection of genuine quality and genuine cheapness does exist but is small, and typically reflects a temporary dislocating event in an otherwise excellent business. The GARP investing framework attempts to capture this middle ground systematically, targeting quality characteristics at reasonable rather than premium multiples.
What is a value trap and how do I avoid it?
A value trap is a company that appears cheap on P/E or P/B metrics but is priced low because the business economics are structurally deteriorating — not temporarily depressed. The most reliable diagnostic is the earnings trend over time: a business with P/E of 8× whose earnings have declined for three consecutive years is categorically different from one where earnings are at a cyclical trough but stable over the longer term. GeminIQ's visualization tools let you chart revenue and net income across twelve or more quarters for any screener result. For a systematic overlay that adds nine fundamental quality tests to flag structural impairment before it shows up in the multiple, the Piotroski F-Score framework is the most widely applied tool for separating deep value candidates from traps.
Does quality investing require paying a premium valuation?
Quality compounders almost always carry premium valuations — that is the market's rational response to exceptional and durable economics. The question is not whether quality is expensive but whether the premium is warranted by the longevity of the competitive advantage. A business at 30× earnings with 25% ROIC sustained over ten years and a large remaining reinvestment runway can be a more compelling long-term holding than one at 8× earnings with declining returns on capital. For a structured framework evaluating whether the premium is justified by the underlying business quality, see Buffett Stock Criteria: What Makes a Quality Business Worth Owning.
What is the difference between deep value and net-net investing?
Deep value investing screens for companies trading at low multiples of earnings and book value while requiring profitability and manageable debt. Net-net investing — Benjamin Graham's most extreme application of the margin of safety concept — screens for companies trading below their net current asset value, meaning the stock can be purchased for less than the liquidation value of working capital alone, ignoring all fixed assets entirely. Net-nets operate at a deeper discount with more distress risk and typically surface only in severe market dislocations. For a full treatment of the net-net approach and how it differs from standard deep value screening, see Net-Net Stocks: Benjamin Graham's Deep Value Strategy.
Related Reading
- Quality Compounder Investing: Philosophy, Criteria, and Screener
- Return on Invested Capital (ROIC) Explained
- Piotroski F-Score: Separating Value from Value Traps
- Net-Net Stocks: Benjamin Graham's Deep Value Strategy
- GARP Investing: Peter Lynch's Growth at a Reasonable Price
- Buffett Stock Criteria: What Makes a Quality Business Worth Owning
- Gross Profit Margin: Business Model Analysis
Wall Street's data. Main Street's price.
Institutional terminals charge thousands a year for as-filed accuracy. GeminIQ gives you the same thing for a fraction of the cost: financials built directly from raw SEC EDGAR filings, not third-party APIs, with full XBRL traceability back to the original 10-K or 10-Q. No normalized guesswork, just calculated metrics, charts, screeners, and watchlists built on numbers exactly as the company reported them. Start researching now at GeminIQ.com.
Disclaimer: The content in this blog is for educational and entertainment purposes only and does not constitute financial, legal, or tax advice. Investing involves risk, including the loss of principal. The views expressed are my own and not intended as financial advice or a guarantee of future performance.